
Zcash Price Breaks Down Below $500, Bearish Pattern Hints At 27% Decline Ahead
Zcash price has weakened sharply, confirming the bearish ascending wedge that had been forming over recent weeks. ZEC broke down decisively, erasing prior gains and pushing the asset into a corrective phase.
While the decline signals growing downside risk, on-chain data suggests some investors may be positioning against a deeper collapse.
Zcash Traders Are In Trouble
Derivatives data highlights increasing stress among long-position traders. The liquidation heatmap displays a dense cluster of long liquidations between the current Zcash price and the $430 level. A move toward that zone could trigger forced closures worth approximately $28.46 million.
Such liquidations often accelerate price declines. As leveraged positions unwind, traders tend to flip bearish. This shift can increase short interest, amplifying downside pressure as short contracts begin to dominate the derivatives market.
Want more token insights like this? Sign up for Editor Harsh Notariya’s Daily Crypto Newsletter here.
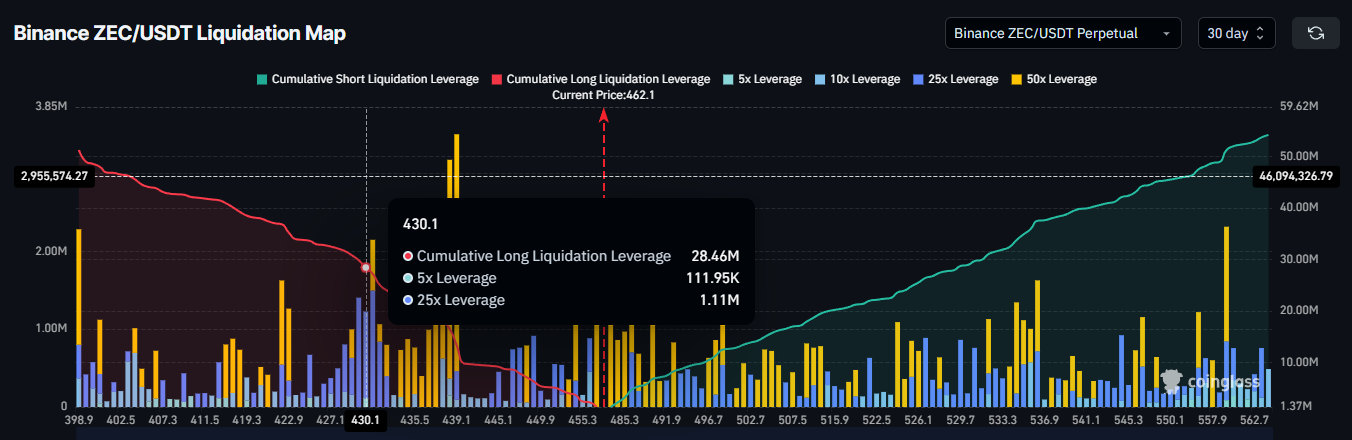 ZEC Liquidation Map. Source: Coinglass
If ZEC approaches the $430 range, sentiment may deteriorate quickly. Rising liquidation risk could encourage traders to anticipate further losses, reinforcing bearish momentum through additional short positioning.
Hints Of Recovery Arise
Despite price weakness, macro indicators present a mixed picture. The Chaikin Money Flow indicator is forming a bullish divergence. Over the past 10 days, the ZEC price has posted lower lows, while the CMF has registered higher lows.
CMF measures capital flow using price and volume to assess accumulation versus distribution. A rising CMF during falling prices suggests institutional accumulation. This pattern indicates that larger holders may still be adding exposure despite short-term losses.
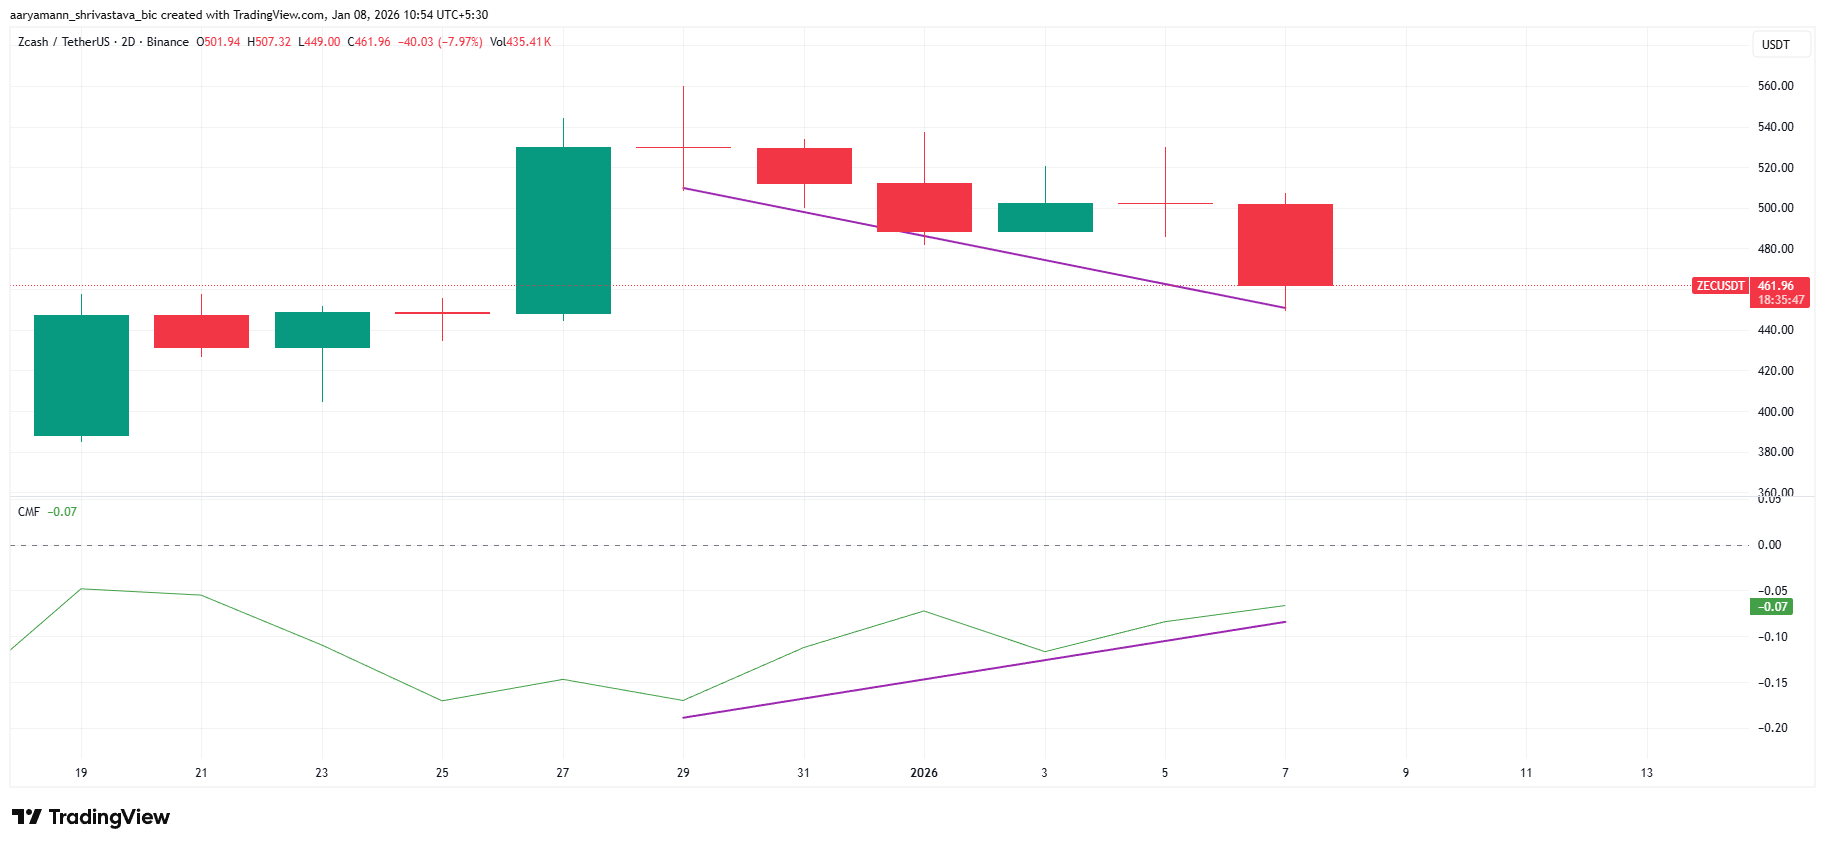 ZEC Bullish Divergence. Source: TradingView
Such divergence can precede reversals if supported by broader market stability. While not a guarantee, continued accumulation could slow selling pressure. If market conditions improve, this capital inflow may help ZEC stabilize and attempt recovery.
Is ZEC Price Still Vulnerable?
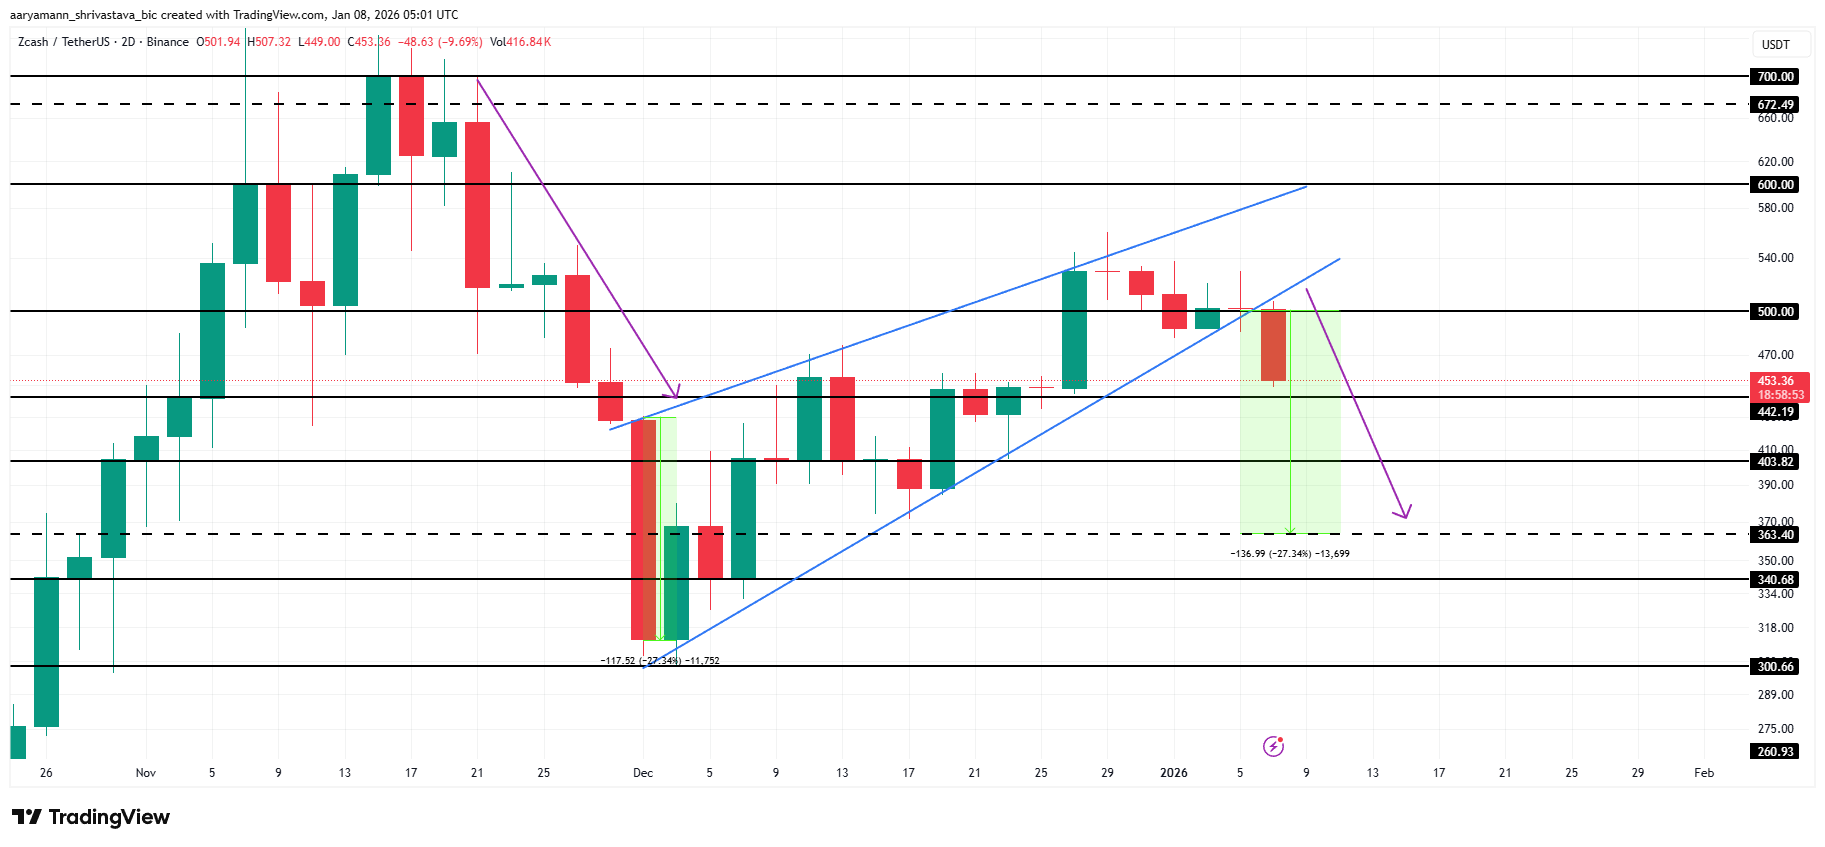
ZEC trades near $453 at the time of writing, down roughly 9% over the past 24 hours. The drop pushed the price below the $500 psychological support. This breakdown confirmed the bearish ascending wedge, increasing the likelihood of further downside.
However, a bullish alternative remains possible if accumulation strengthens. Should large holders continue adding exposure, ZEC may bounce off $442 and attempt to reclaim $500. Securing that level as support could open a move toward $550, signaling a trend reversal.
 ZEC Price Analysis. Source: TradingView
On the other hand, technical projections from the pattern still point to a potential 27% correction. Under this scenario, ZEC could fall toward $363. Sustained selling pressure would likely push the price below the $403 support, invalidating the bullish thesis.
Recommended Articles


