


Ethereum’s $4,400 Breakout Target Finds One Critical On-Chain Support
Ethereum price has traded almost flat over the past week, barely moving despite endless predictions. On the surface, nothing looks to be happening. But the chart and on-chain data together tell a very different story. A clean breakout structure is forming, and at the same time, selling pressure from long-term holders has collapsed.
That combination is rare. If it holds, Ethereum’s next major move may already be in motion.
Inverse Head-And-Shoulders Breakout Aligns With On-Chain Selling Collapse
On the daily chart, Ethereum is forming a well-defined inverse head-and-shoulders reversal pattern. The structure has a relatively flat neckline near the $3,400 zone, which is important. Flattish necklines tend to attract stronger follow-through when the price finally breaks through.
If Ethereum closes decisively above this neckline (around $3,400), the measured move from the then confirmed pattern points toward a target near $4,400. That target comes directly from the height of the head projected upward. From a technical perspective, the setup looks clean.
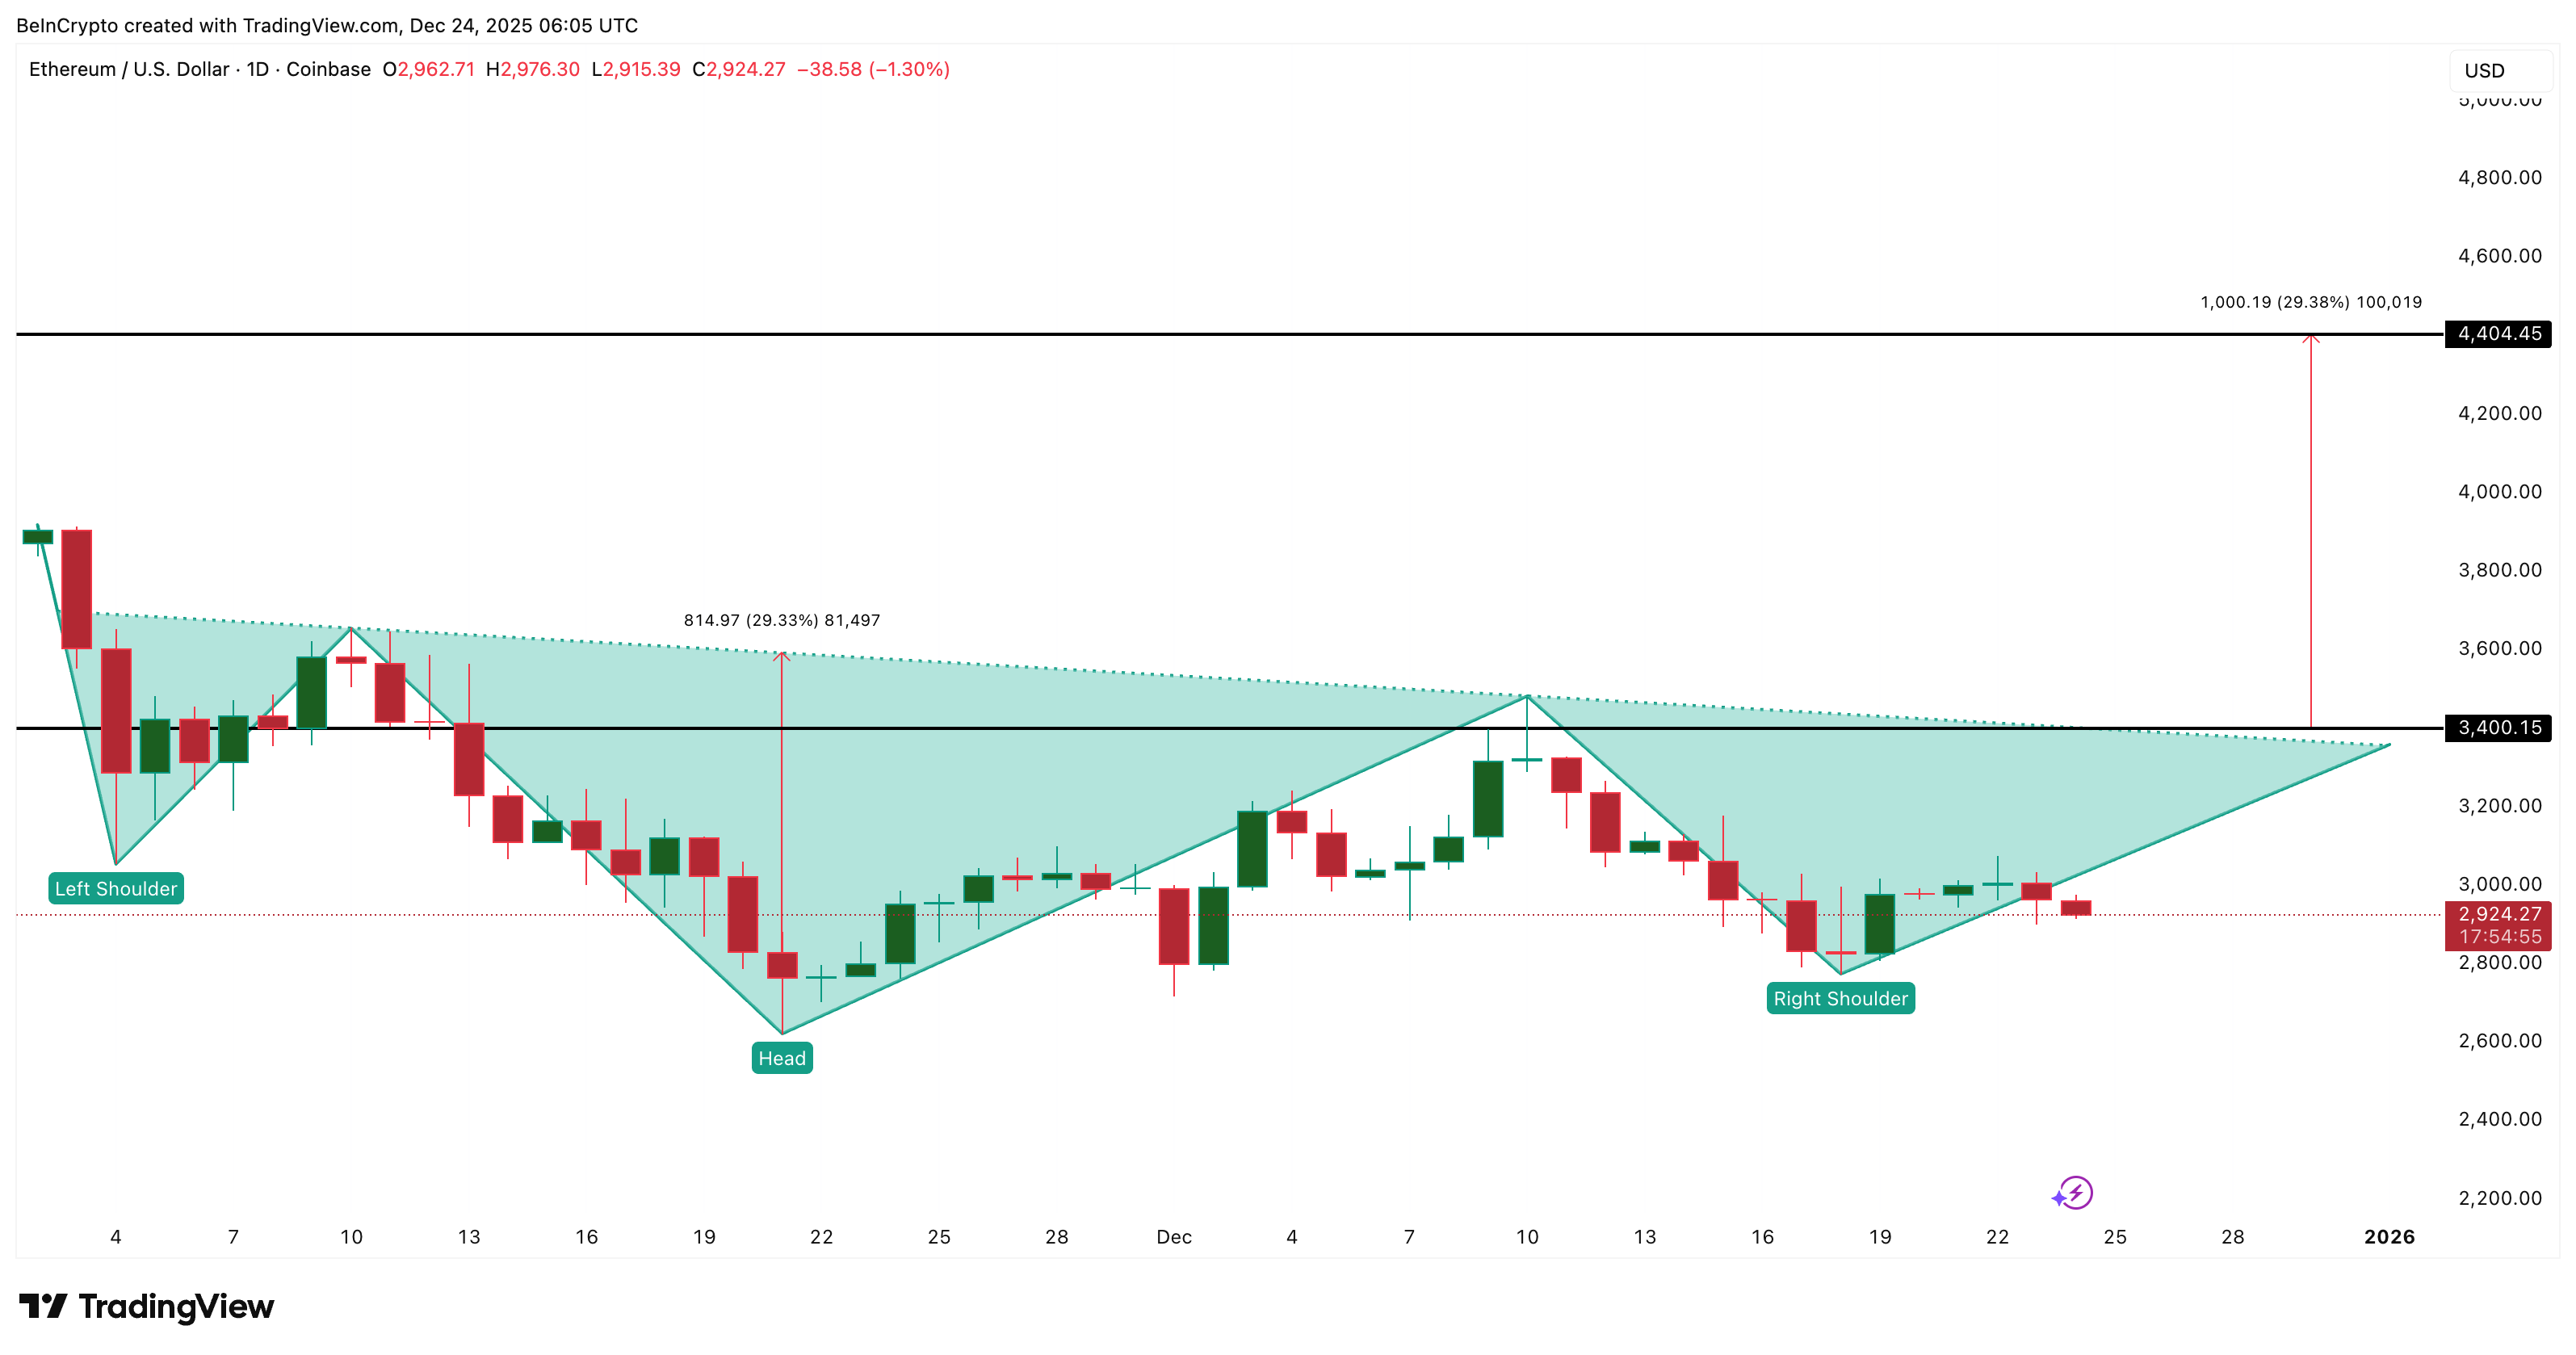 Ethereum Breakout Pattern: TradingView
Want more token insights like this? Sign up for Editor Harsh Notariya’s Daily Crypto Newsletter here.
What makes this pattern more compelling is what is happening on-chain.
Hodler Net Position Change measures whether longer-term holders are selling or accumulating. Since November 26, this metric has shifted dramatically. At that point, long-term holders were selling roughly 1.1 million ETH. By December 23, that number had dropped to just 54,427 ETH.
That is a reduction of more than 95% in selling pressure.
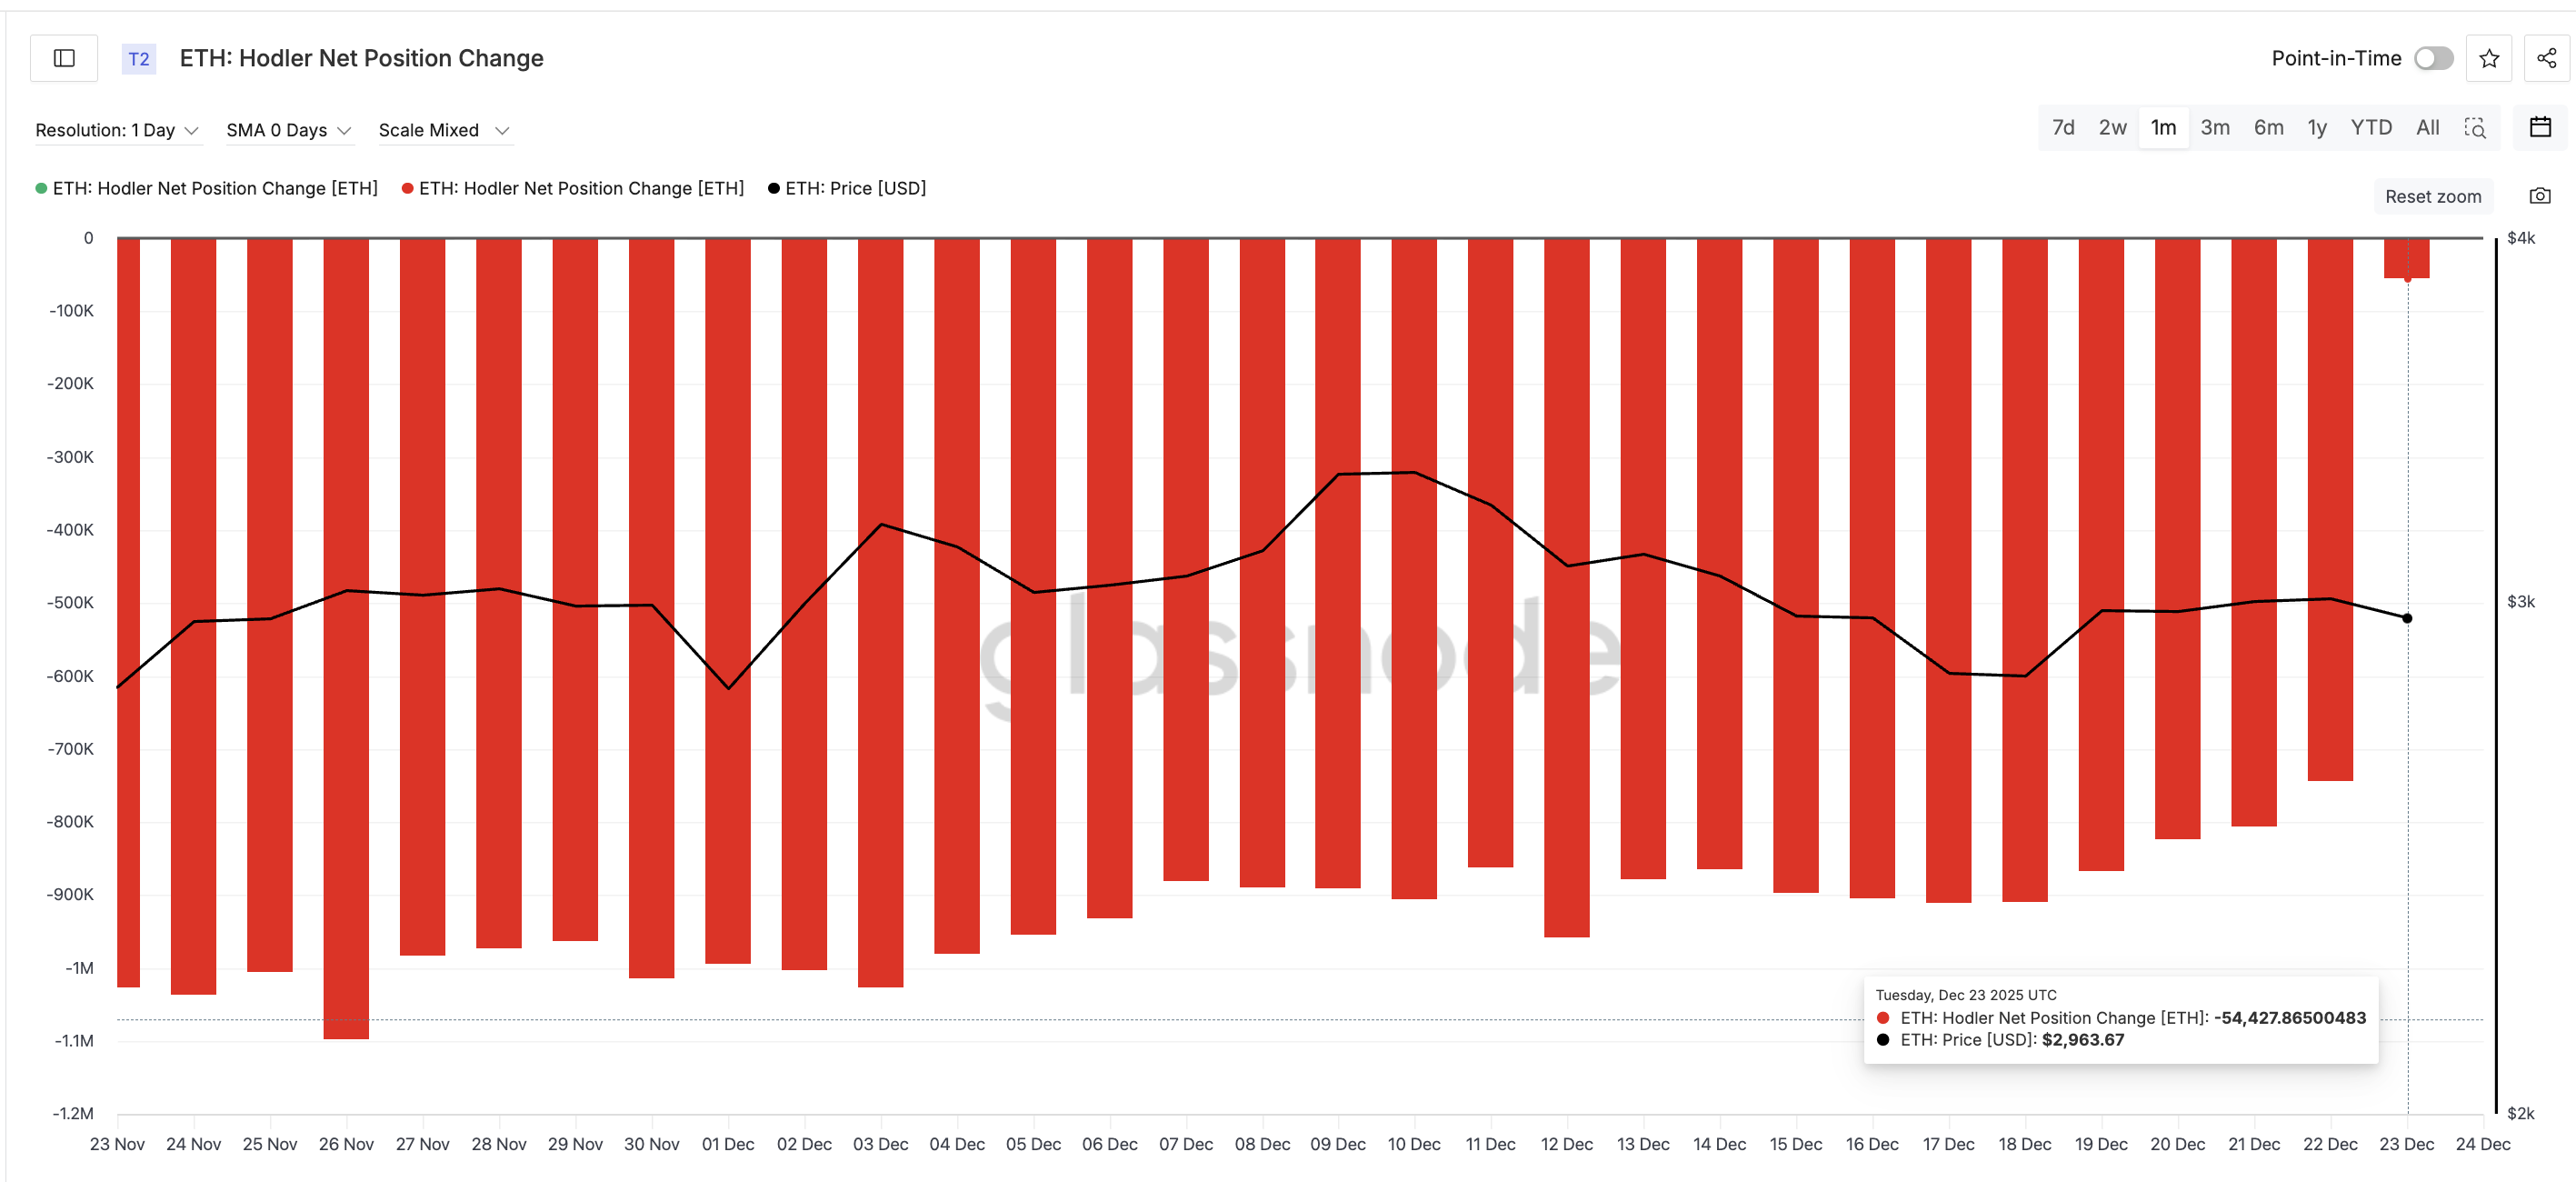 Holder Selling Dips 95%: Glassnode
This matters because long-term holders tend to reduce selling near important turning points. When a breakout pattern forms at the same time selling pressure collapses, it suggests supply is drying up rather than increasing. That creates a stronger base for any upside move above the neckline.
In simple terms, the chart is signaling a breakout, and the on-chain data shows fewer sellers standing in the way.
Cost Basis Levels And Key Ethereum Price Zones
The next question is whether Ethereum can realistically reach and breach the neckline.
Cost basis data helps answer that. Cost basis shows where large amounts of ETH were last acquired. These zones often act as resistance when price revisits them, because holders may sell near breakeven.
For Ethereum, the most important cost basis cluster sits between roughly $3,150 and $3,173. Around 2,940,000 ETH were accumulated in this range. That makes it the strongest supply wall on the way up.
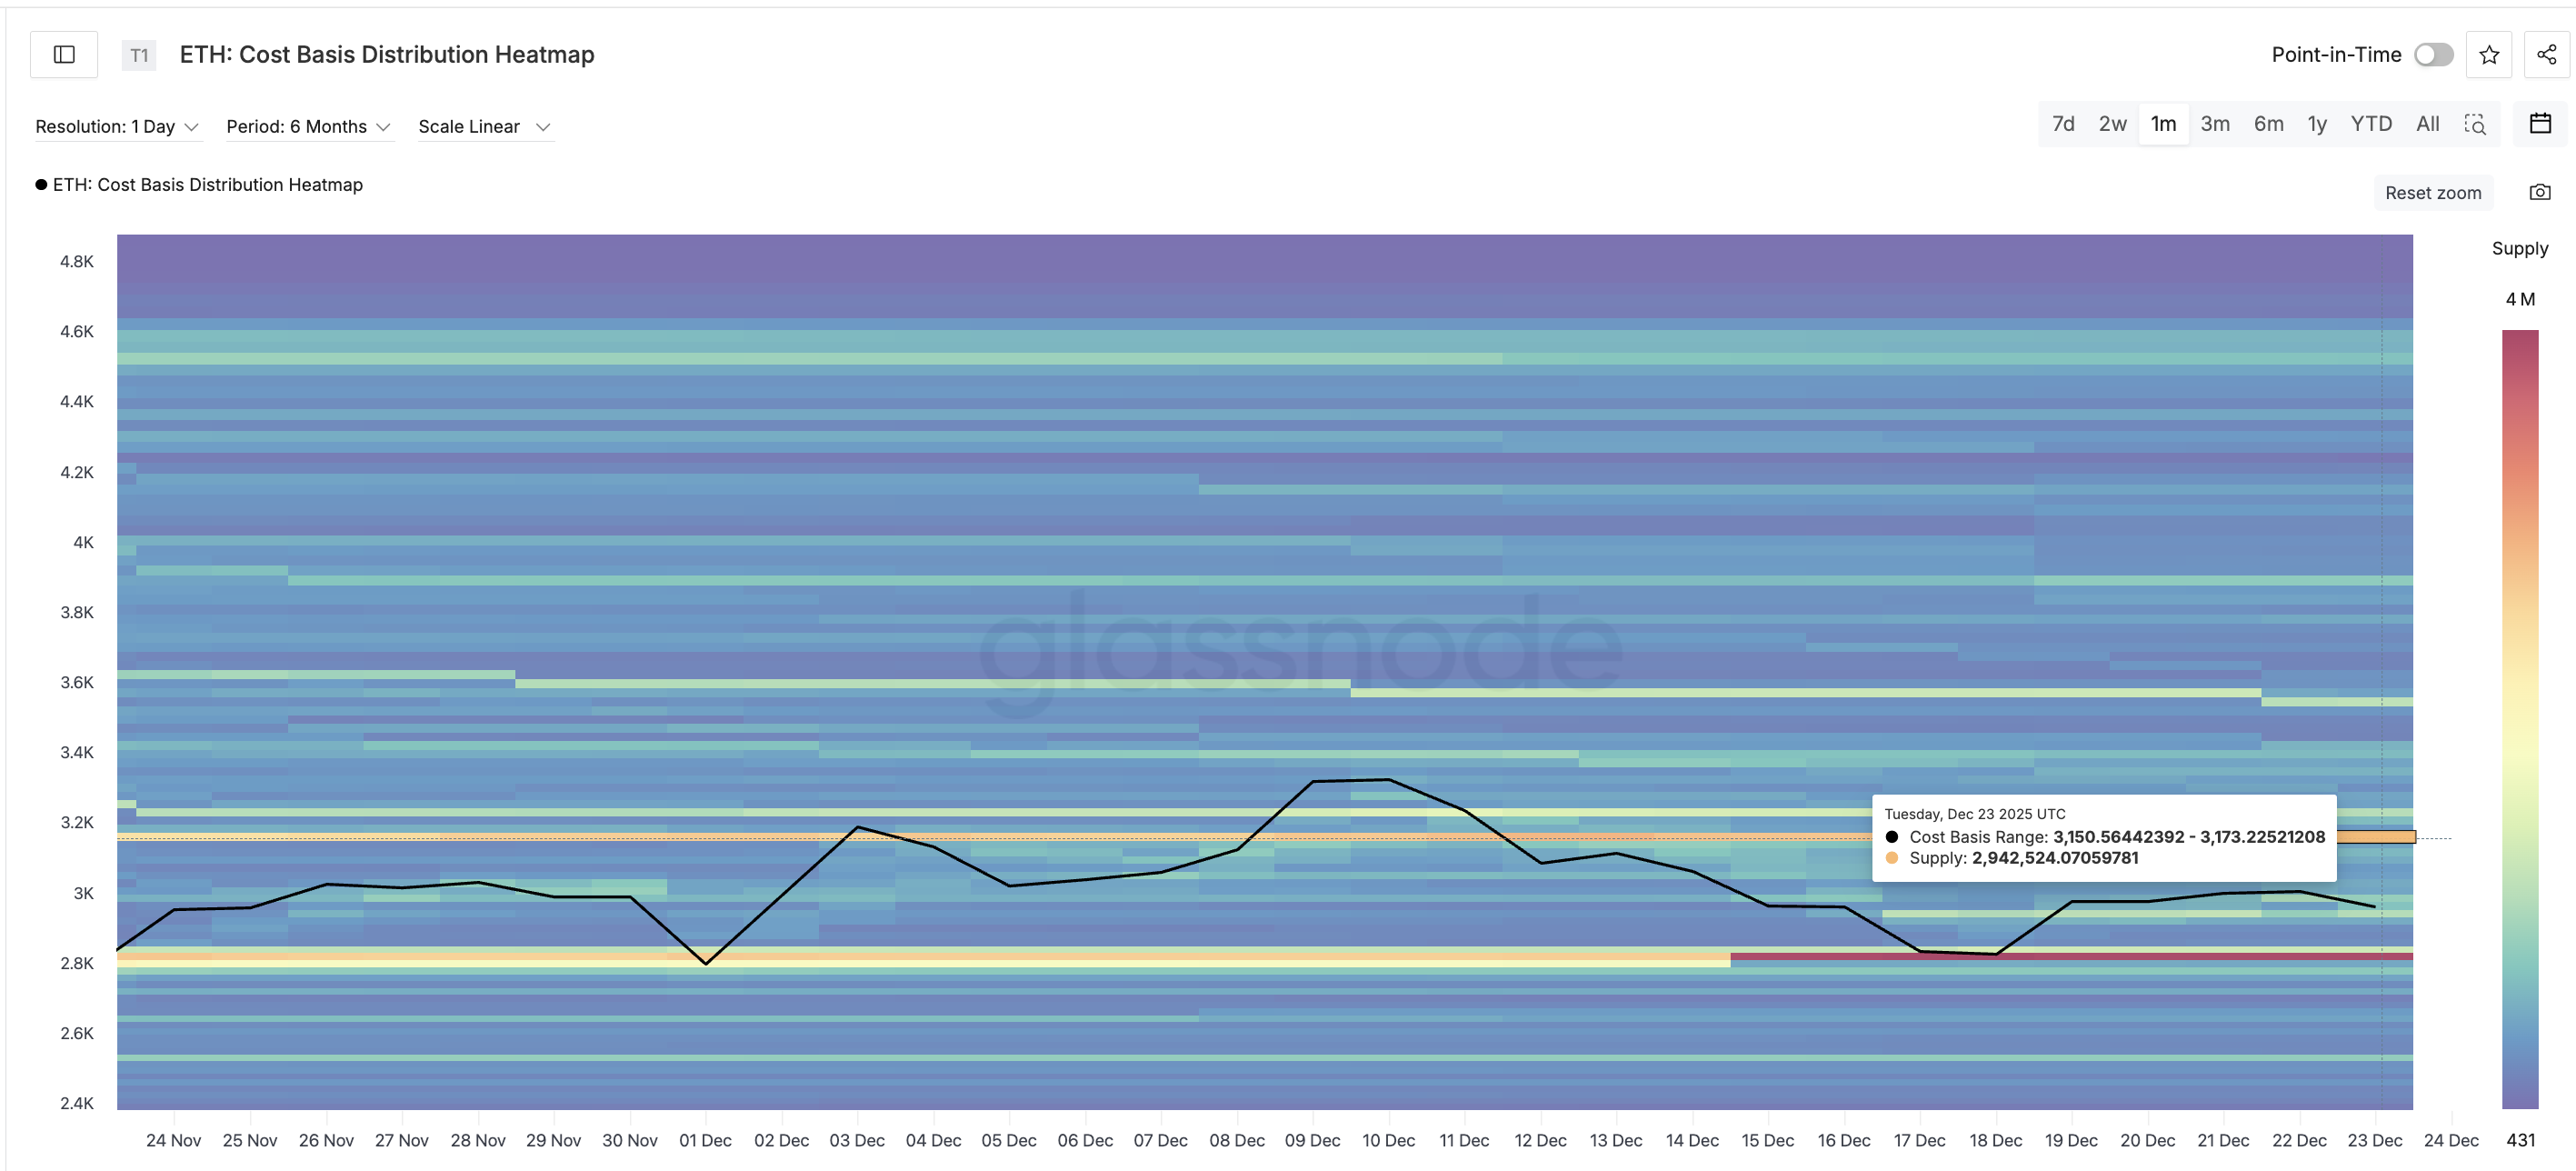 Most Critical ETH Supply Cluster: Glassnode
A sustained move above this zone would clear the path toward the $3,400 neckline. From current levels, that represents roughly a 7% advance. Do note that the $3,150 level also appears on the price chart, validating its importance.
Once above $3,400, the next key level comes near $3,480, followed by a relatively thin resistance zone until around $4,170.
If momentum builds after the breakout, the full inverse head-and-shoulders target near $4,400 comes into view.
Risk still exists, and it is well defined. If Ethereum loses $2,800, the structure weakens. A drop below $2,620 would fully invalidate the bullish setup and suggest sellers have regained control.
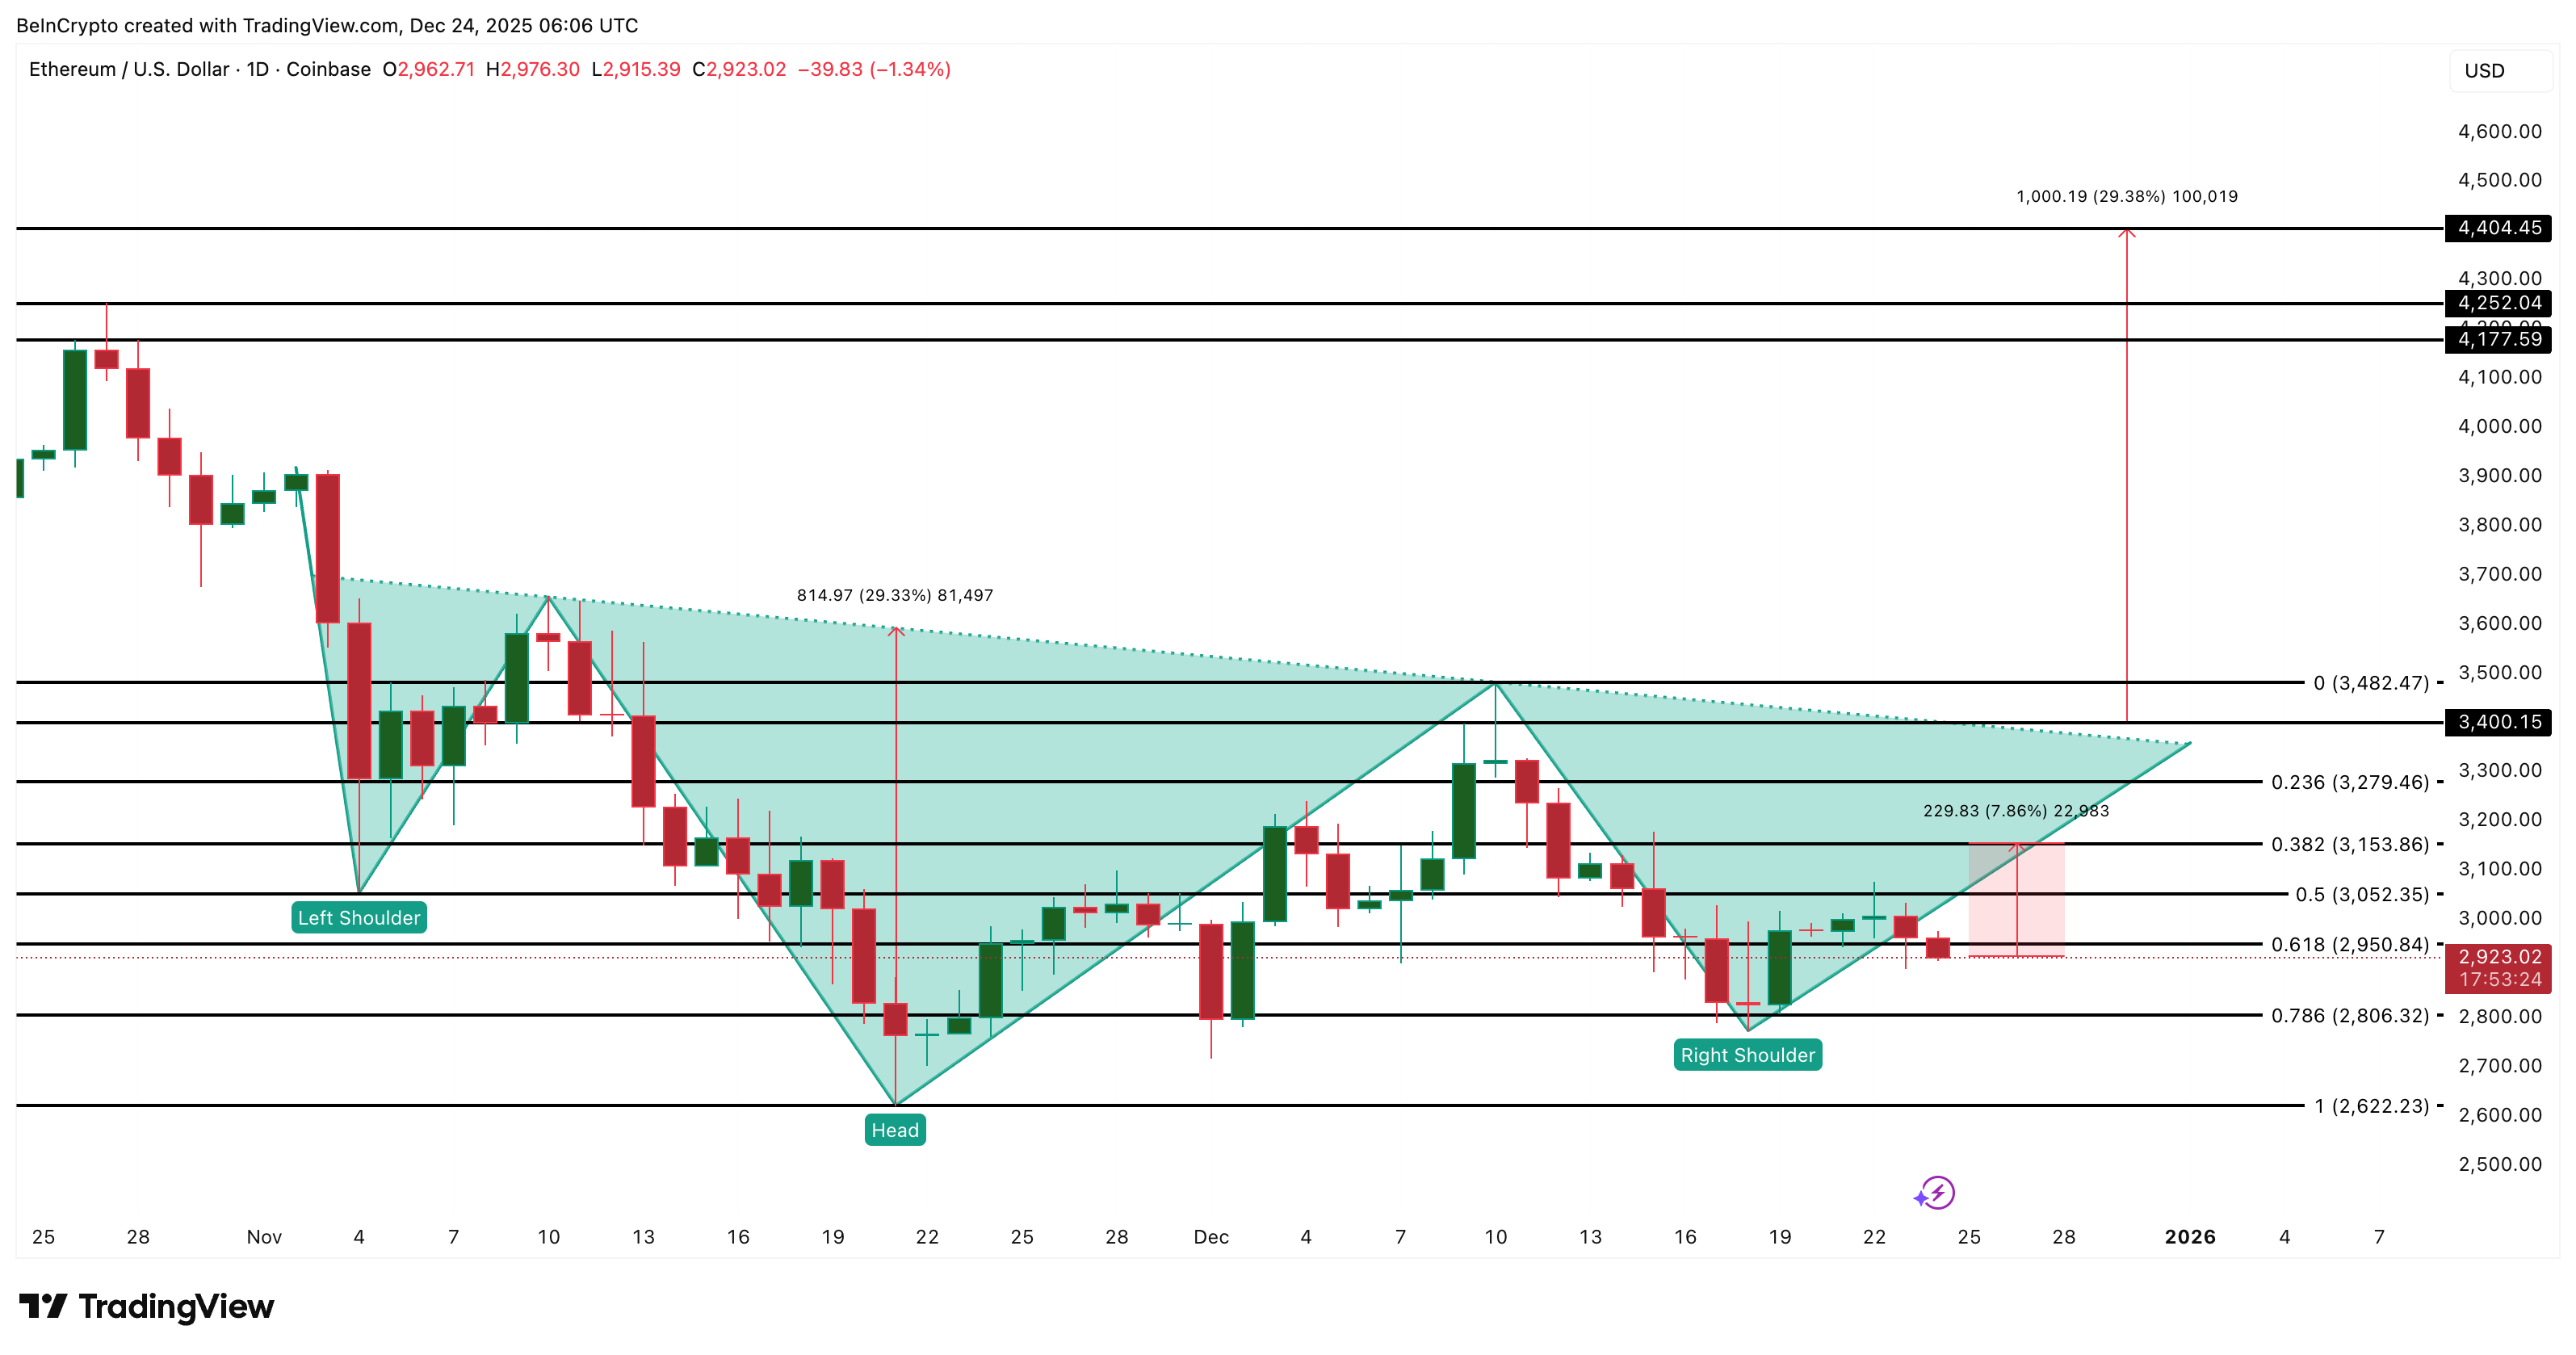 Ethereum Price Analysis: TradingView
For now, though, the balance favors the upside. A textbook reversal pattern, a sharp collapse in long-term selling, and a clearly defined resistance map all point to the same conclusion. Yet, the bullish theory succeeding clearly depends on a clean close above $3,150, the supply wall clearance zone.
Recommended Articles


