


Bitcoin’s 5% Whiplash Was No Accident — Charts Reveal The Full Story
Bitcoin’s violent move on December 17 caught traders off guard. In a single day, BTC surged to around $90,500 before reversing hard and sliding toward $85,200. From high to low, that was a swing of more than 5%, or roughly $5,000.
This was not news-driven. It was structure-driven. Three charts explain why the move happened, why it stalled exactly where it did, and why similar volatility remains possible.
Volume Breakdown Signaled Risk Before the Drop
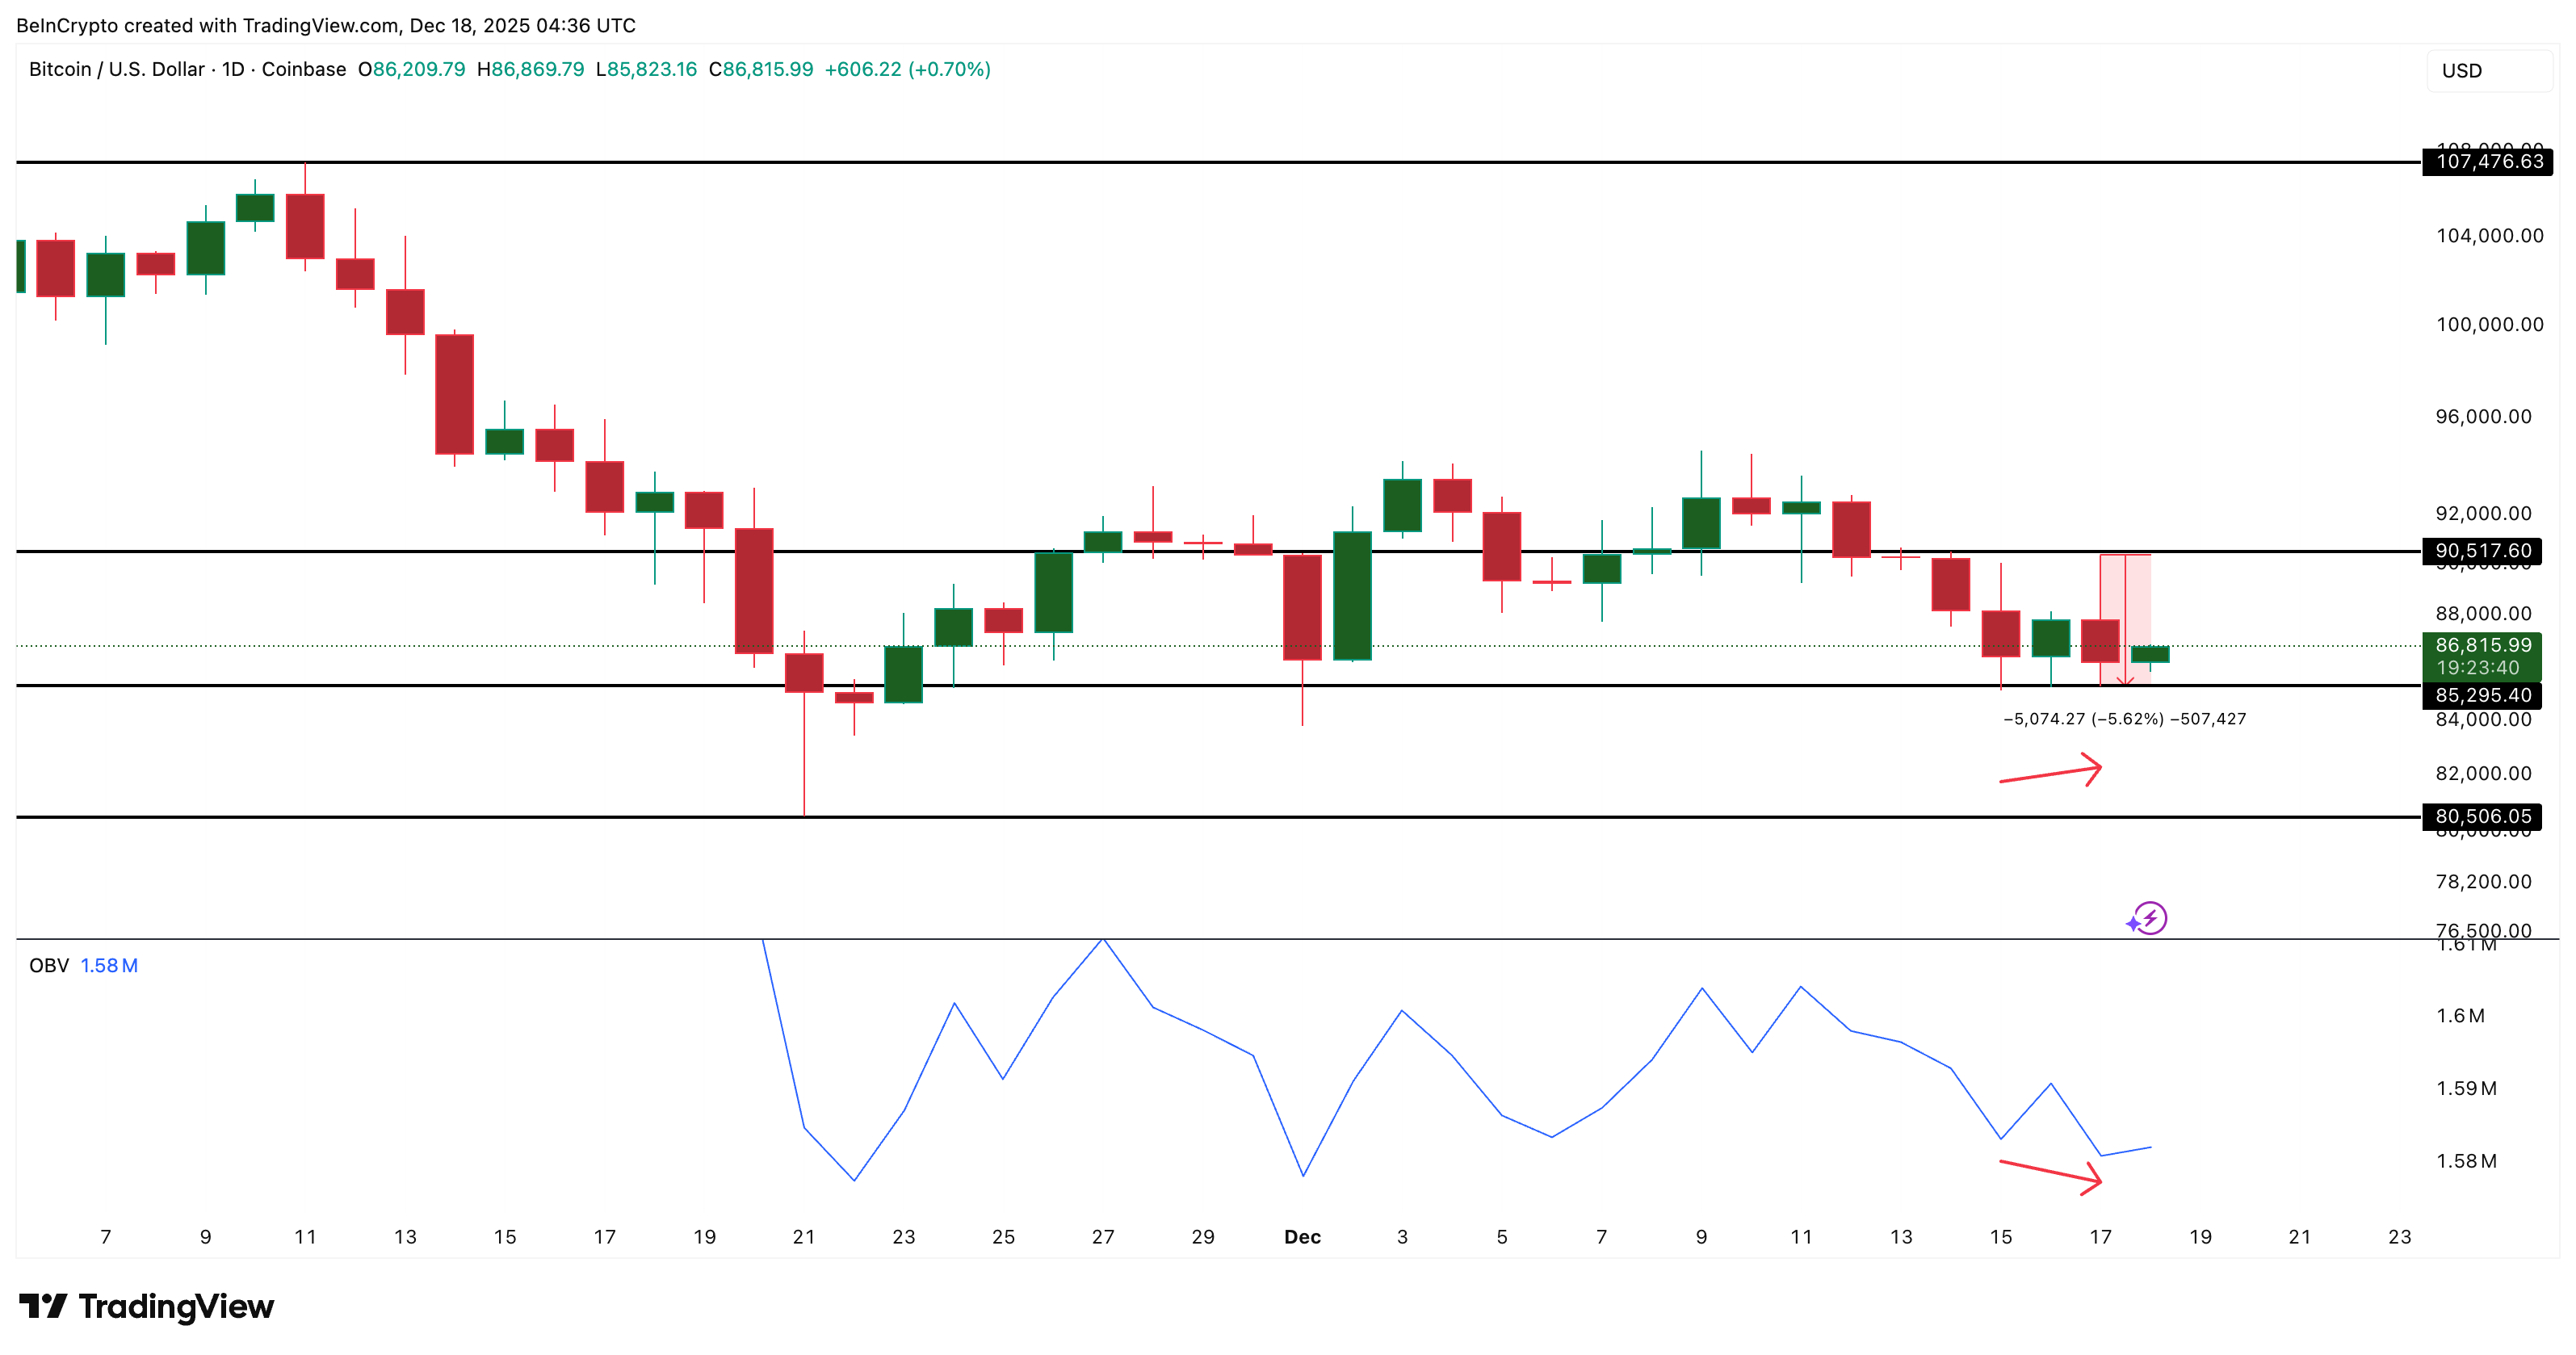
Before the sell-off, the BTC price action already showed stress. Between December 15 and December 17, the Bitcoin price printed a marginal higher low on the daily chart. On the surface, that looked stable. But On-Balance Volume told a different story.
OBV tracks whether volume confirms price moves. During this period, OBV failed to follow the price higher and instead made a lower low. That bearish divergence signaled distribution. In simple terms, price was holding up, but volume was quietly flowing out.
Want more token insights like this? Sign up for Editor Harsh Notariya’s Daily Crypto Newsletter here.
 First Trigger For The Volatile Price Swing: TradingView
When Bitcoin pushed toward $90,500, it did so with weak participation. That made the rally fragile. Once selling started, there was no volume support beneath, which turned a pullback into a sharp intraday whiplash.
In markets, whiplash refers to a rapid move up followed immediately by a sharp move down, or vice versa.
Cost Basis Heatmap Shows Why $90,500 Rejected and $85,200 Held
On-chain cost basis data explains the exact turning points.
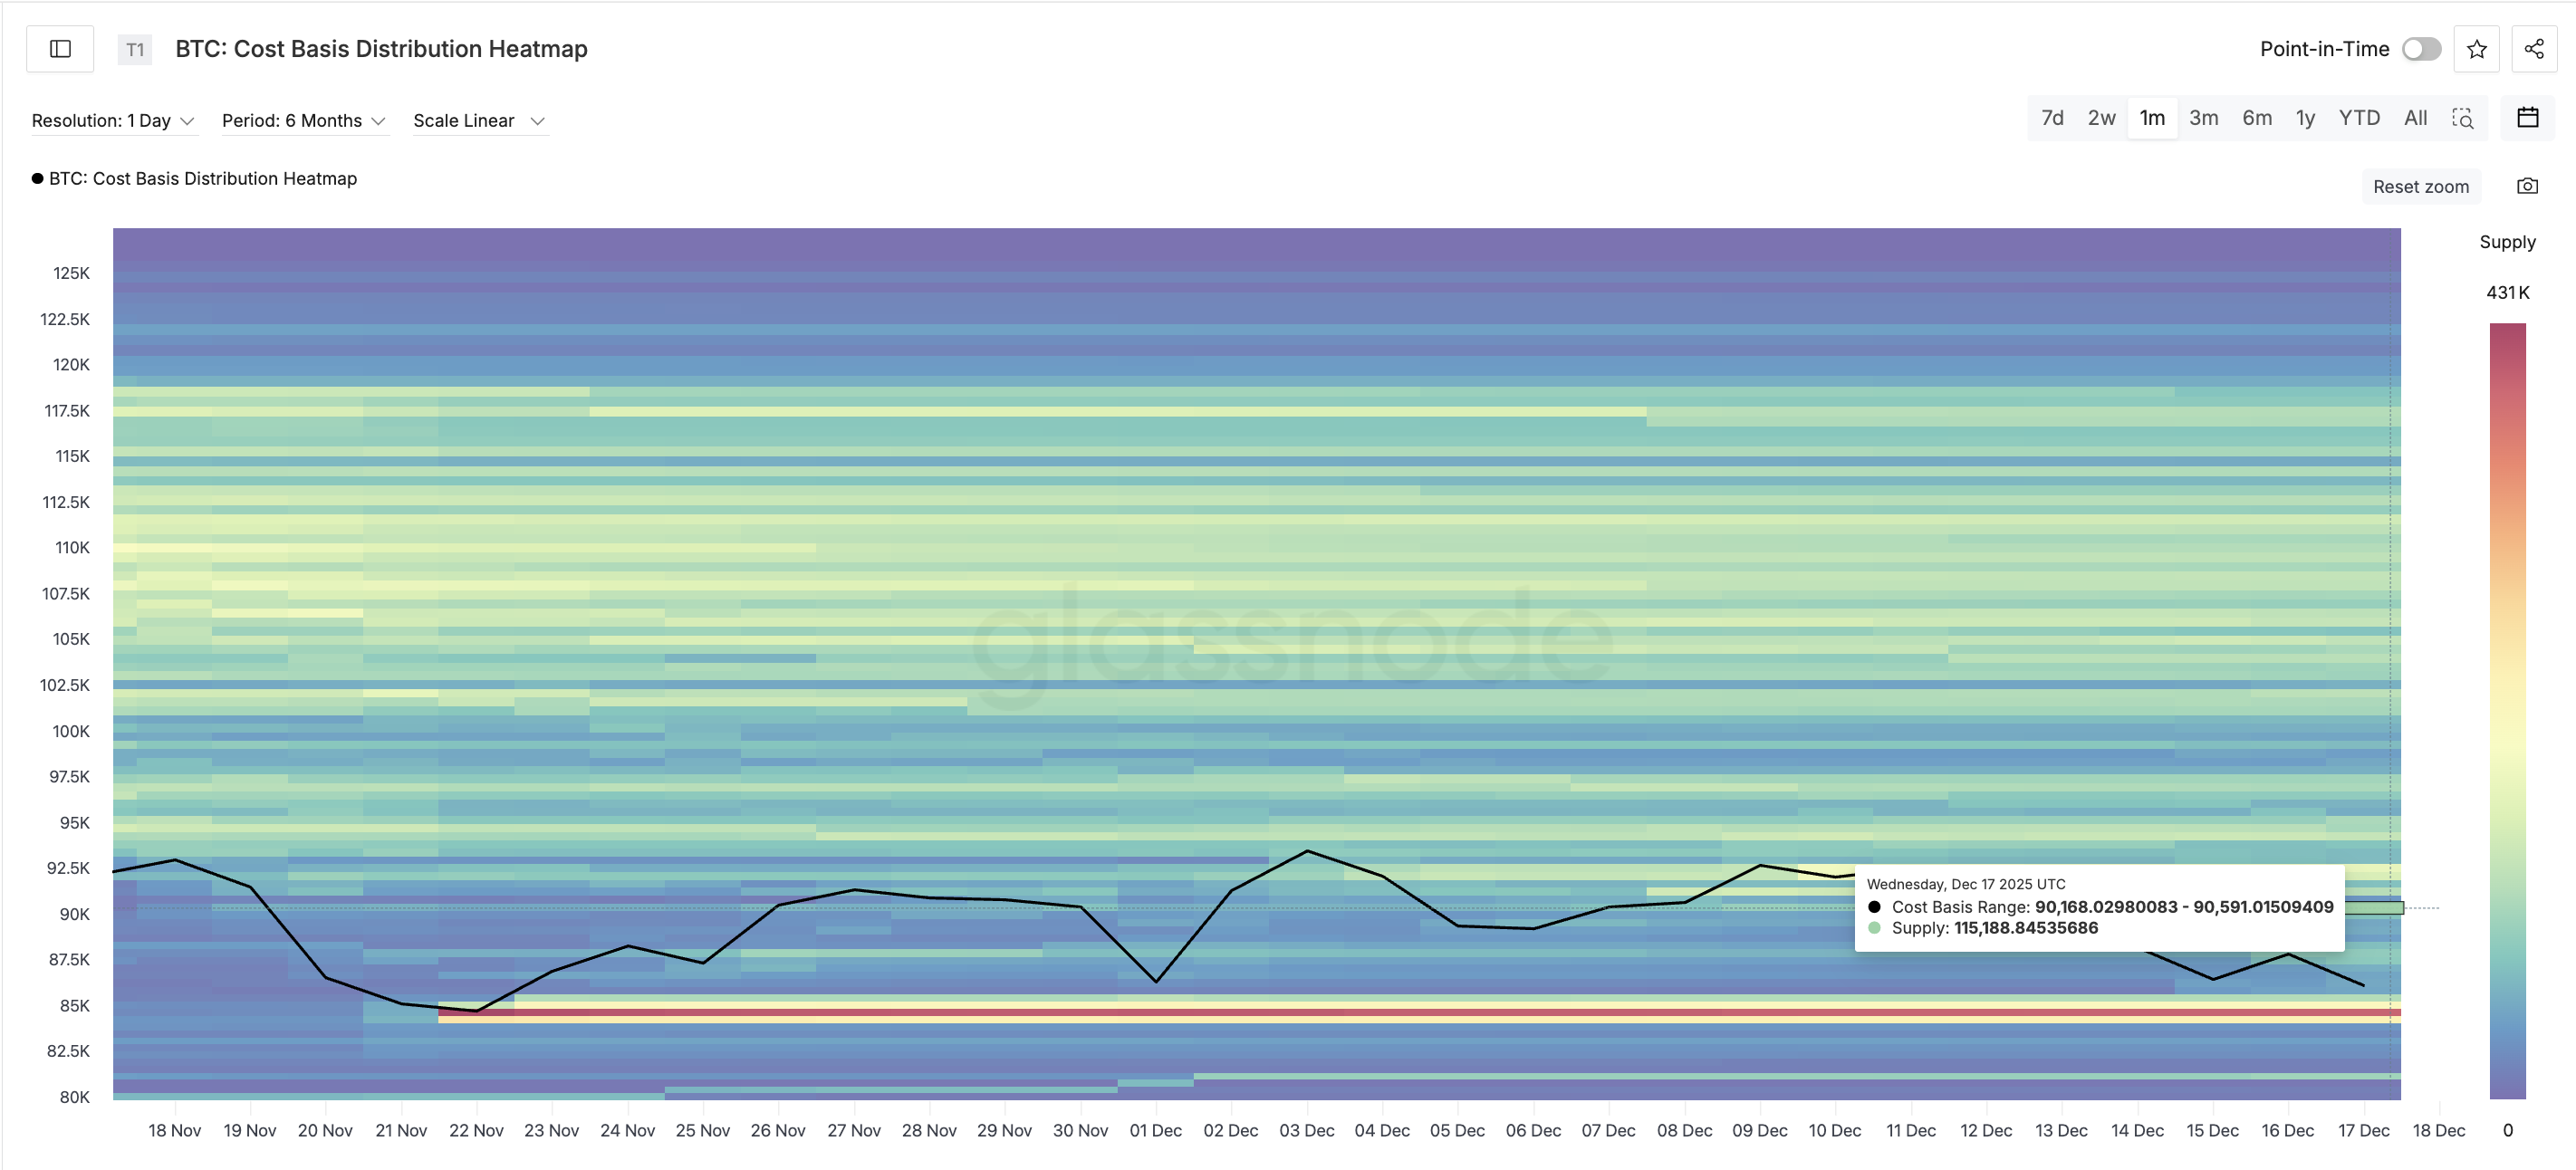
The cost basis heatmap shows a dense supply cluster between $90,168 and $90,591. Around 115,188 BTC were accumulated in this zone. When the price revisited this range, many holders reached break-even.
 BTC Supply Cluster: Glassnode
That could have created immediate sell pressure. Combined with OBV weakness, this cluster acted like a ceiling. The rally stalled, then reversed.
On the downside, the story changes.
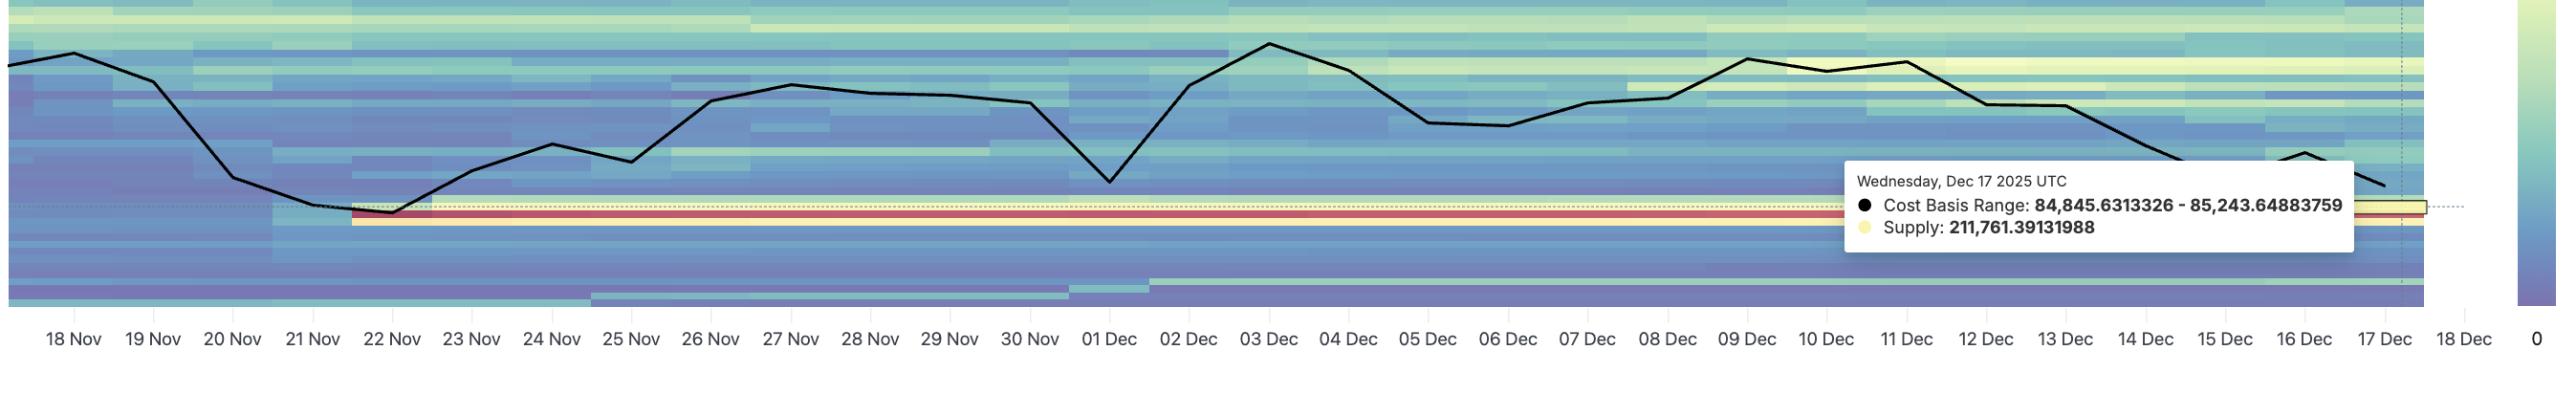
Another strong cluster sits between $84,845 and $85,243. This is the most concentrated near-term support zone on the chart. As the price fell, buyers stepped in aggressively here. That is why the Bitcoin price did not collapse further, even during forced liquidations.
 Key Support Cluster: Glassnode
So the move was boxed in. Sellers defended $90,500. Buyers defended $85,200. The whiplash happened inside those walls.
Bitcoin Price Levels Now Decide If Volatility Returns
Structurally, Bitcoin is still holding a mild uptrend from the November 21 low. That matters. Yesterday’s volatility event was inside the range.
For upside continuation, one level stands out. Bitcoin must post a clean daily close above $90,500. That level has not been reclaimed since December 13. Without a close above it, any rally risks another rejection.
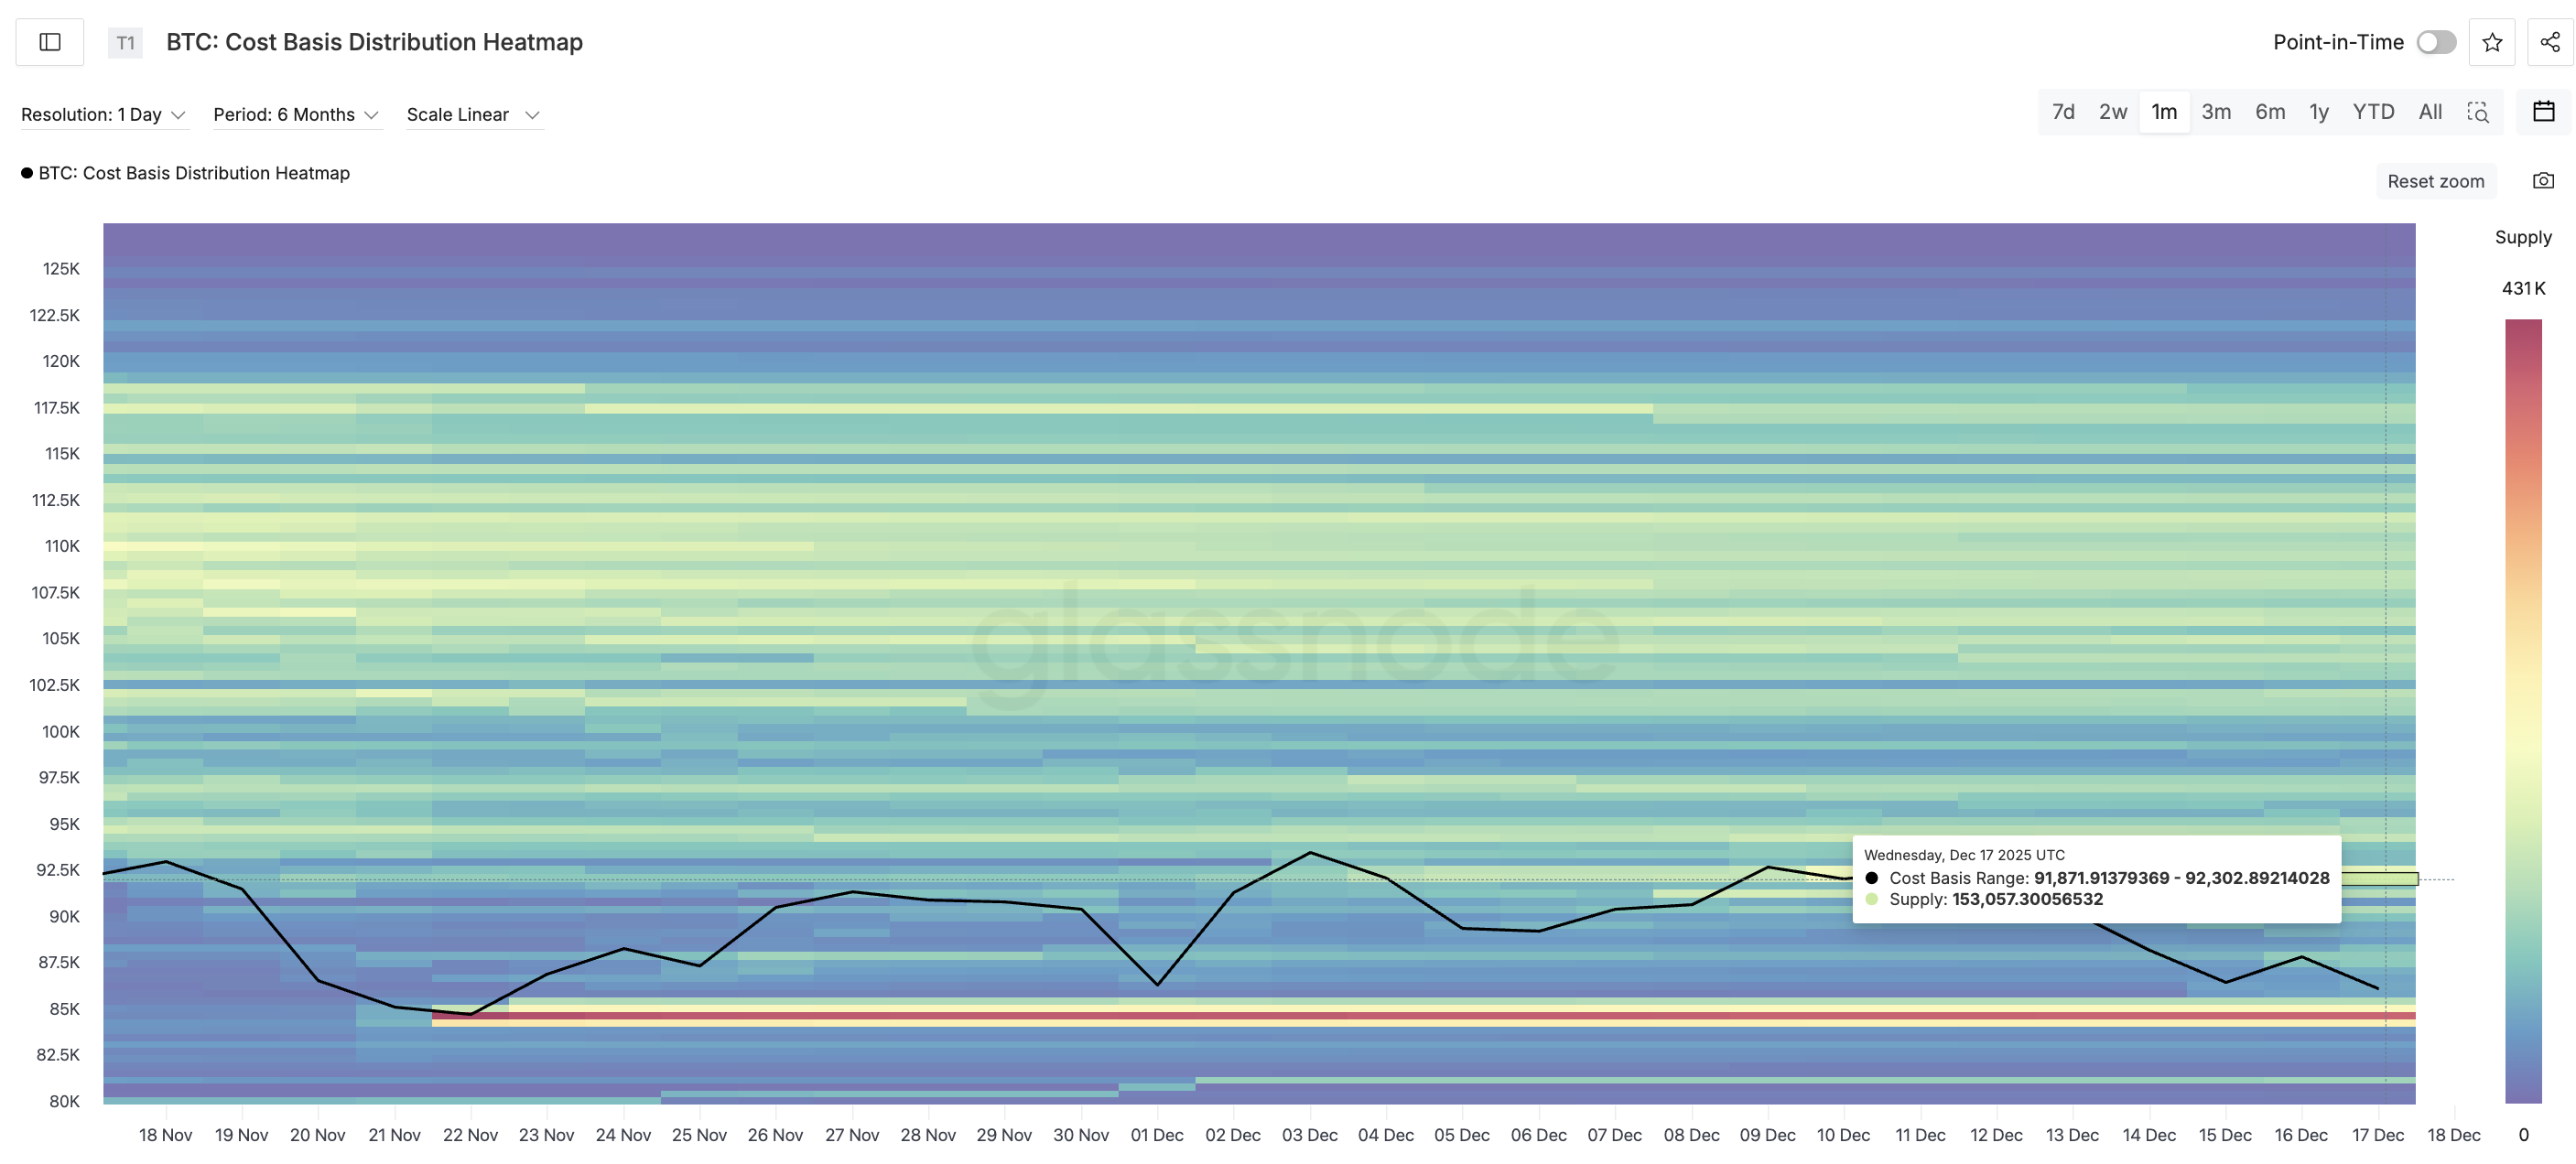
Above that, $92,200 to $92,300 becomes critical. On-chain data shows another supply cluster there. Traders should expect friction unless the price clears that zone decisively. Also, traders reading this might want to consider complete daily closes above key levels mentioned on the charts instead of wick-styled breakouts.
 Key Upside Clusters: Glassnode
On the downside, $85,000-$85,200 remains the key zone. As long as this cluster holds, a deeper downside is less likely. A failure there would expose $83,800, but breaching $85,000 would require fresh liquidation pressure.
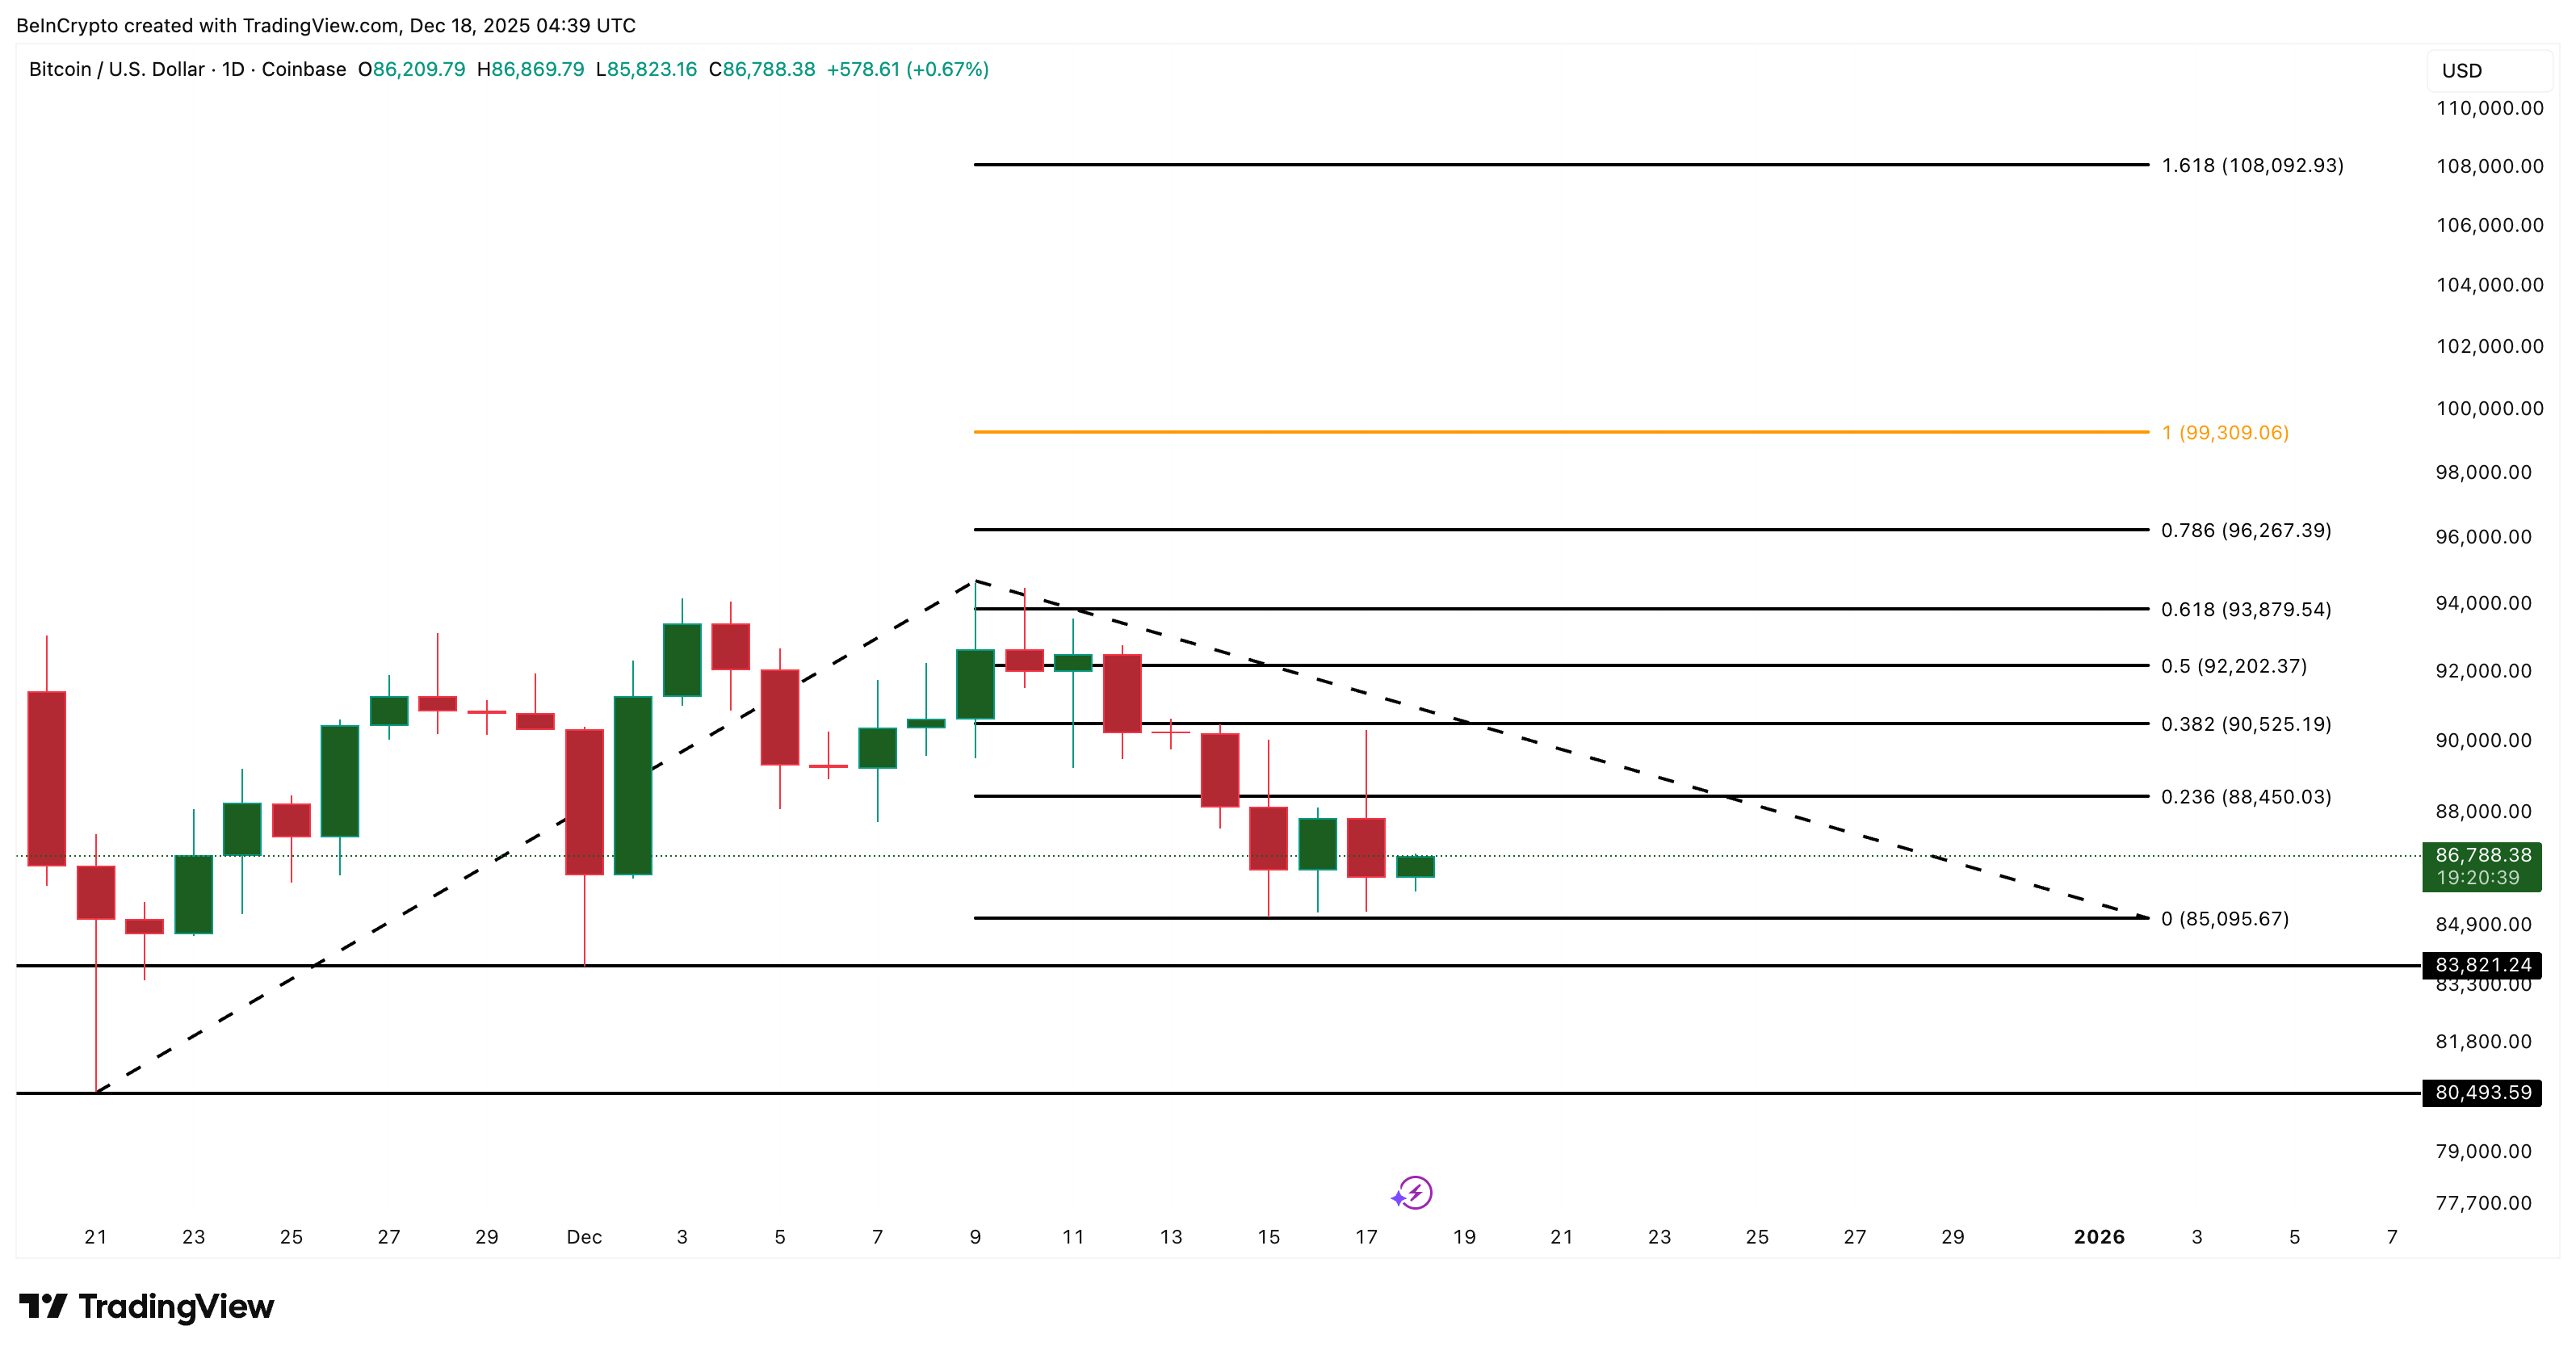 Bitcoin Price Analysis: TradingView
The takeaway is simple. Bitcoin’s 5%+ whiplash was not random. It was the result of weak volume, heavy supply at known cost levels, and tight liquidity. Until those structures change, sharp moves like this remain part of the crypto market’s reality.
Recommended Articles


