

Traders eyeing long positions could have their rally soon as funding rates flip negative

Source Fxstreet
  • Bitcoin funding rate chart has been flipping negative of late, signaling a shift in market sentiment.
  • Shorts are paying longs, which often precipitates the creation of bullish momentum.
  • A potential market correction or squeeze could be on the horizon.

Bitcoin (BTC) price remains on a load-shedding exercise, a sentiment that has spilled over to the broader market. Nevertheless, the bleed seen across the cryptocurrency market could end soon amid possible shifting market sentiment.

Also Read: Bitcoin price defends $60K as whales hold onto their BTC despite market dip

Funding rates flipping negative could be the silver lining for longs

After a prolonged downtrend in the market, fortunes could be starting to change as funding rates flip negative.
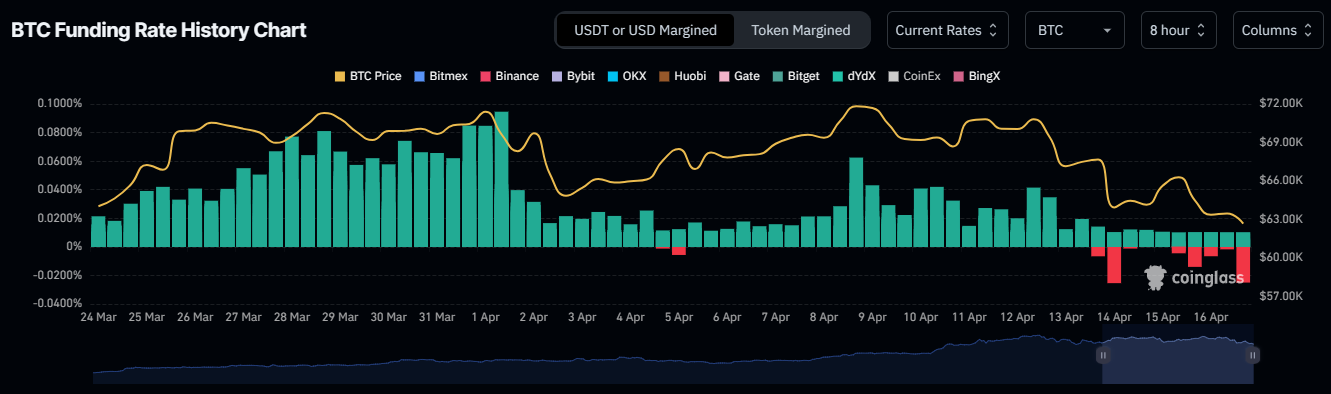
BTC funding rate

During a bearish market like the one currently at play, the funding rate shifting negative leads to short traders paying long traders. On the other hand, when the market sentiment is bullish, the funding rate becomes positive and long traders pay short traders.

Funding rates can reflect market sentiment and liquidity. A positive funding rate, where long position holders pay shorts suggests that traders are willing to pay a premium to bet on rising prices, which indicates bullish sentiment. A negative funding rate could mean bearish sentiment with shorts paying longs, suggesting that traders expect prices to fall.

If the bearish sentiment prevails, Bitcoin price could continue to fall, which would justify the negative funding rate. An overly negative funding rate for a prolonged duration, however, could cause a change in sentiment, causing a possible twist in the BTC price action to turn bullish.

The shorts could get squeezed, compelled to buy Bitcoin at a higher price in efforts to cover their losses as the BTC price rises unexpectedly. This unexpected surge in buying pressure can lead to even more price increases. The result would be a snowball effect where more short sellers rush to cover their positions. This can result in rapid and significant price spikes in the cryptocurrency market.

Open Interest, funding rate FAQs

Higher Open Interest is associated with higher liquidity and new capital inflow to the market. This is considered the equivalent of increase in efficiency and the ongoing trend continues. When Open Interest decreases, it is considered a sign of liquidation in the market, investors are leaving and the overall demand for an asset is on a decline, fueling a bearish sentiment among investors.

Funding fees bridge the difference between spot prices and prices of futures contracts of an asset by increasing liquidation risks faced by traders. A consistently high and positive funding rate implies there is a bullish sentiment among market participants and there is an expectation of a price hike. A consistently negative funding rate for an asset implies a bearish sentiment, indicating that traders expect the cryptocurrency’s price to fall and a bearish trend reversal is likely to occur.

Disclaimer: For information purposes only. Past performance is not indicative of future results.
placeholder
Bitcoin Drops Below $83,000 as US Government Transfers Over 10,000 BTC, Sparking Panic Over Potential Selling PressureUS government transfers over 10,000 BTC as Bitcoin extends losses to breach $83,000, but a further sharp decline remains unlikely.On October 8, Bitcoin (BTC) extended its recent losses, f
Author  TradingKey
13 hours ago
US government transfers over 10,000 BTC as Bitcoin extends losses to breach $83,000, but a further sharp decline remains unlikely.On October 8, Bitcoin (BTC) extended its recent losses, f
placeholder
Gold falls to a two-month low as real yields bite — can $4,000 hold?Gold hit a two-month low on 7 October, with spot touching roughly $4,090 and COMEX December futures closing at $4,140.70, even as the New York Fed's one-year inflation expectation rose to 3.9% — its highest since May 2023. The paradox resolves through real yields: the 30-year Treasury yield reached 5.732% intraday, its highest since 2002. Here are the levels, the institutional split, and the scenarios into tonight's jobless claims and 30-year auction.
Author  Irene Q.
13 hours ago
Gold hit a two-month low on 7 October, with spot touching roughly $4,090 and COMEX December futures closing at $4,140.70, even as the New York Fed's one-year inflation expectation rose to 3.9% — its highest since May 2023. The paradox resolves through real yields: the 30-year Treasury yield reached 5.732% intraday, its highest since 2002. Here are the levels, the institutional split, and the scenarios into tonight's jobless claims and 30-year auction.
placeholder
Gold Price Forecast: Gold Drops Below $4,100, Could Test $4,000 in Short TermAs of the Asian session on October 8, gold prices (XAUUSD) maintained a weak rebound trend today, with the latest price trading around $4,120; yesterday, gold prices briefly fell below $4
Author  TradingKey
13 hours ago
As of the Asian session on October 8, gold prices (XAUUSD) maintained a weak rebound trend today, with the latest price trading around $4,120; yesterday, gold prices briefly fell below $4
placeholder
Euro slides to a 17-month low as France's budget crisis spreads — can 1.12 hold?EUR/USD touched 1.1162 on 5 October, its weakest level in 17 months, as France's budget standoff pushed the 10-year OAT above 5% and the OAT-Bund spread to roughly 160bp — the widest since the 2011-12 eurozone debt crisis. The euro now trades near 1.1215 ahead of US jobless claims and a $22 billion 30-year Treasury auction. Here are the levels and the two scenarios to watch.
Author  Irene Q.
14 hours ago
EUR/USD touched 1.1162 on 5 October, its weakest level in 17 months, as France's budget standoff pushed the 10-year OAT above 5% and the OAT-Bund spread to roughly 160bp — the widest since the 2011-12 eurozone debt crisis. The euro now trades near 1.1215 ahead of US jobless claims and a $22 billion 30-year Treasury auction. Here are the levels and the two scenarios to watch.
placeholder
Today’s Market Recap: 10-Year Treasury Yield Hits Highest Since 2002,U.S. Stocks Fall as Brent Barely Holds $100Tracking the Market TrendTradingKey - On October 7, U.S. Eastern Time, the 10-year Treasury yield climbed to an intraday high of 5.36%, its highest level since 2002, while all three major U.S. stock i
Author  TradingKey
20 hours ago
Tracking the Market TrendTradingKey - On October 7, U.S. Eastern Time, the 10-year Treasury yield climbed to an intraday high of 5.36%, its highest level since 2002, while all three major U.S. stock i
Related Instrument
goTop
quote