Bitcoin To $40,000? Signal Behind Past 60% Crashes Is Back

Source Newsbtc

A cryptocurrency analyst has pointed out how a technical analysis (TA) signal that led into major price declines in the past has returned for Bitcoin.

Monthly MACD Has Turned Bearish For Bitcoin

In a new post on X, analyst Ali Martinez has talked about a signal that has formed in the Moving Average Convergence/Divergence (MACD) for Bitcoin. MACD is a TA indicator that’s generally used for timing buys and sells in an asset’s price chart.

The indicator consists of two lines: MACD line and signal line. The first of these, the MACD line, is found by subtracting the 26-period exponential moving average (EMA) of the price from its 12-period EMA. The signal line tracks the 9-period EMA of this difference.

Crossovers between the two lines can provide buy or sell signals for the asset. The MACD line breaking above the signal line could be considered a bullish signal, while the reverse type of crossover a bearish one.

Now, here is the chart shared by Martinez that shows how the monthly MACD has changed for Bitcoin over the last several years:

Bitcoin MACD

As displayed in the above graph, the Bitcoin MACD has registered a crossover recently. The MACD line has plunged as the asset has witnessed its bearish momentum and it’s now sitting under the signal line.

As mentioned earlier, such a signal can be a bearish one. In the chart, the analyst has highlighted the past instances of this pattern. It would appear that the last three sell signals from the indicator all led into declines of more than 60% for the cryptocurrency.

“If that repeats, the chart points to $40,000,” noted Martinez. It now remains to be seen whether the MACD will hold for Bitcoin, or if a different trend from the past will follow this time around.

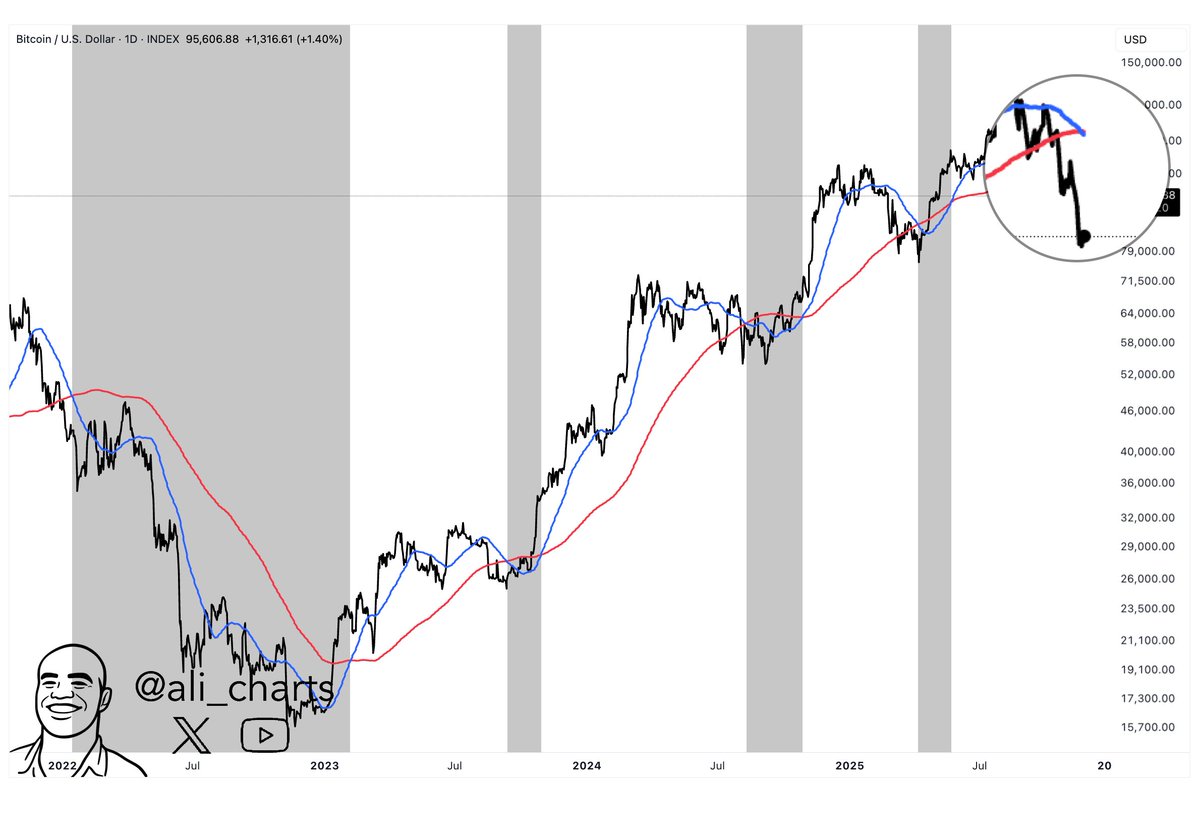
The MACD line falling under its signal line isn’t the only bearish crossover that BTC has faced recently. As the analyst has pointed out in another X post, a classic death cross has also appeared between the asset’s 50-day simple moving average (SMA) and 200-day SMA.
Bitcoin Death Cross

From the chart, it’s apparent that the 50-day SMA has declined below the 200-day SMA alongside the latest Bitcoin market downturn. During the past couple of years, each such signal has marked local bottoms for BTC, but in 2022, this crossover kicked off the bear market.

So far since the death cross has appeared, the asset has continued to decline, a potential sign that this death cross may be different from the recent ones.

BTC Price

At the time of writing, Bitcoin is floating around $88,800, down over 4% in the last seven days.

Bitcoin Price Chart
Disclaimer: For information purposes only. Past performance is not indicative of future results.
placeholder
Top 3 Price Prediction: Bitcoin, Ethereum, Ripple – BTC, ETH and XRP Look for a Foothold After a Sharp ShakeoutBitcoin trades near $92,600 after a dip below $90,000, while Ethereum around $3,118 and XRP near $2.21–$2.23 sit on key support zones, as BTC, ETH and XRP all try to turn a sharp correction into a tradable rebound rather than a deeper slide.
Author  Mitrade
Nov 19, Wed
Bitcoin trades near $92,600 after a dip below $90,000, while Ethereum around $3,118 and XRP near $2.21–$2.23 sit on key support zones, as BTC, ETH and XRP all try to turn a sharp correction into a tradable rebound rather than a deeper slide.
placeholder
Bitcoin Volatility Spikes: Is Options-Driven Pricing Making a Comeback?Bitcoin's volatility is surging, suggesting a shift back to options-driven price action seen before Bitcoin ETFs were launched.
Author  Mitrade
Yesterday 03: 23
Bitcoin's volatility is surging, suggesting a shift back to options-driven price action seen before Bitcoin ETFs were launched.
placeholder
2025 Black Friday is coming! Which stocks may see volatility?Coming on the day right after Thanksgiving in the United States, Back Friday marks the start of the holiday shopping season. Sales data from this shopping frenzy day reflects investor confidence and consumer trends. The National Retail Federation (NRF) predicts that holiday season (Nov and Dec) retail sales in 2025 will likely exceed $1 trillion for the very first time, which represents a year-over-year increase of 3.7 to 4.2 percent. Historic data from the past decade show that the retail sector has generally outperformed the S&P 500 during the weeks before and after Black Friday. The following retailing companies are expected to be big winners:
Author  Insights
Yesterday 05: 37
Coming on the day right after Thanksgiving in the United States, Back Friday marks the start of the holiday shopping season. Sales data from this shopping frenzy day reflects investor confidence and consumer trends. The National Retail Federation (NRF) predicts that holiday season (Nov and Dec) retail sales in 2025 will likely exceed $1 trillion for the very first time, which represents a year-over-year increase of 3.7 to 4.2 percent. Historic data from the past decade show that the retail sector has generally outperformed the S&P 500 during the weeks before and after Black Friday. The following retailing companies are expected to be big winners:
placeholder
Top 3 Price Prediction: Bitcoin, Ethereum, Ripple – BTC, ETH and XRP Attempt Recovery Post-SelloffBitcoin trades back above $87,700 after a 20% drop, while Ethereum rebounds from support around $2,749 and XRP recovers above $2.08 off its $1.96 floor, as BTC, ETH and XRP all try to turn last week’s steep correction into the start of a broader recovery.
Author  Mitrade
Yesterday 05: 58
Bitcoin trades back above $87,700 after a 20% drop, while Ethereum rebounds from support around $2,749 and XRP recovers above $2.08 off its $1.96 floor, as BTC, ETH and XRP all try to turn last week’s steep correction into the start of a broader recovery.
placeholder
Gold Price Forecast: XAU/USD rises to near $4,150 as Fed rate cut bets growGold price (XAU/USD) attracts some buyers to around $4,140 during the early Asian session on Tuesday. The precious metal rises on growing expectations of a US Federal Reserve (Fed) interest rate cut in the December policy meeting.
Author  FXStreet
12 hours ago
Gold price (XAU/USD) attracts some buyers to around $4,140 during the early Asian session on Tuesday. The precious metal rises on growing expectations of a US Federal Reserve (Fed) interest rate cut in the December policy meeting.
goTop
quote