

Top 3 Price Prediction Bitcoin, Gold, Silver: Flash Reversal Signals at Key Technical Levels
Bitcoin, Gold, and Silver prices have reached major price levels where the market could soon flip direction, because early technical indicators suggest a possible reversal.
As of this writing, the prices of BTC, XAU, and XAG were testing critical support levels, amid elevated fear levels in the market and concerns over the pioneer cryptocurrency’s death cross.
Bitcoin Bulls Show Up Amid Death Cross Fears
Throughout the past weekend, crypto traders and investors discussed the death cross, a technical formation on the BTC/USDT trading pair that is expected to determine Bitcoin’s next directional bias.
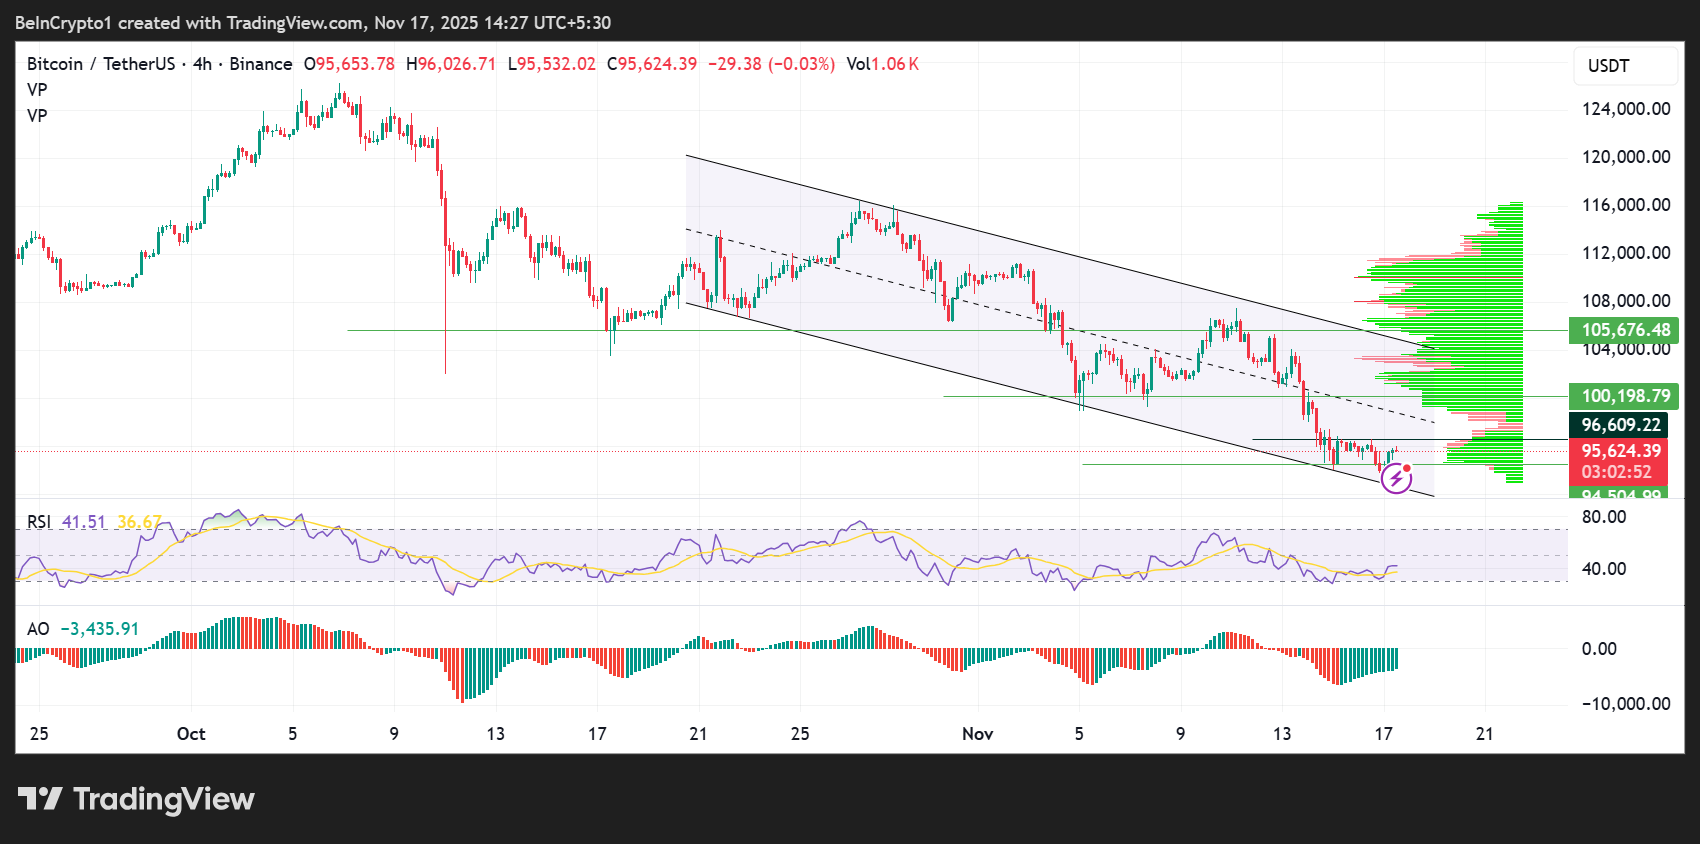
Bitcoin was trading for $95,624 as of this writing, continuing its descent within a well-defined descending channel that has governed price action since early October.
Each attempt to break above the upper boundary has failed, and the price is now testing the lower channel support. The consolidation at current levels suggests that BTC is preparing for a decisive move.
The Volume Profile highlights a major liquidity cluster at $100,000–$105,600, which could present an overhead resistance. However, with the green horizontal bars representing bullish volume profiles, bulls are waiting to interact with the BTC price in these areas. Such bullish dominance could see the pioneer crypto.
BTC repeatedly rejected the $100,200 level, signaling strong sell pressure from trapped longs and larger players distributing near the psychological six-figure mark.
The RSI (Relative Strength Index) at 41 indicates bearish momentum, but with the potential for bullish divergence forming as the price nears the channel bottom. The Awesome Oscillator (AO) remains negative but is moderating, indicating weakening downside strength. This is a typical precursor to a relief rally.
 Bitcoin (BTC) Price Performance. Source: TradingView
Immediate support lies at $94,504, marking the lower boundary of the channel. A breakdown risks a deeper decline toward $92,000–$90,000, where the next VPVR (Volume Profile Visible Range) support band sits.
However, if bulls defend this zone and force a rebound, BTC could overcome the immediate resistance at $98,000, followed by the critical breakout zone at $100,198.
The next major trend shift hinges on whether Bitcoin holds the channel support. A confirmed breakout above $100,000–$102,000 would signal a bullish trend shift, while a breakdown risk accelerates the downtrend.
Gold Needs to Fill the Imbalance due to the FVG
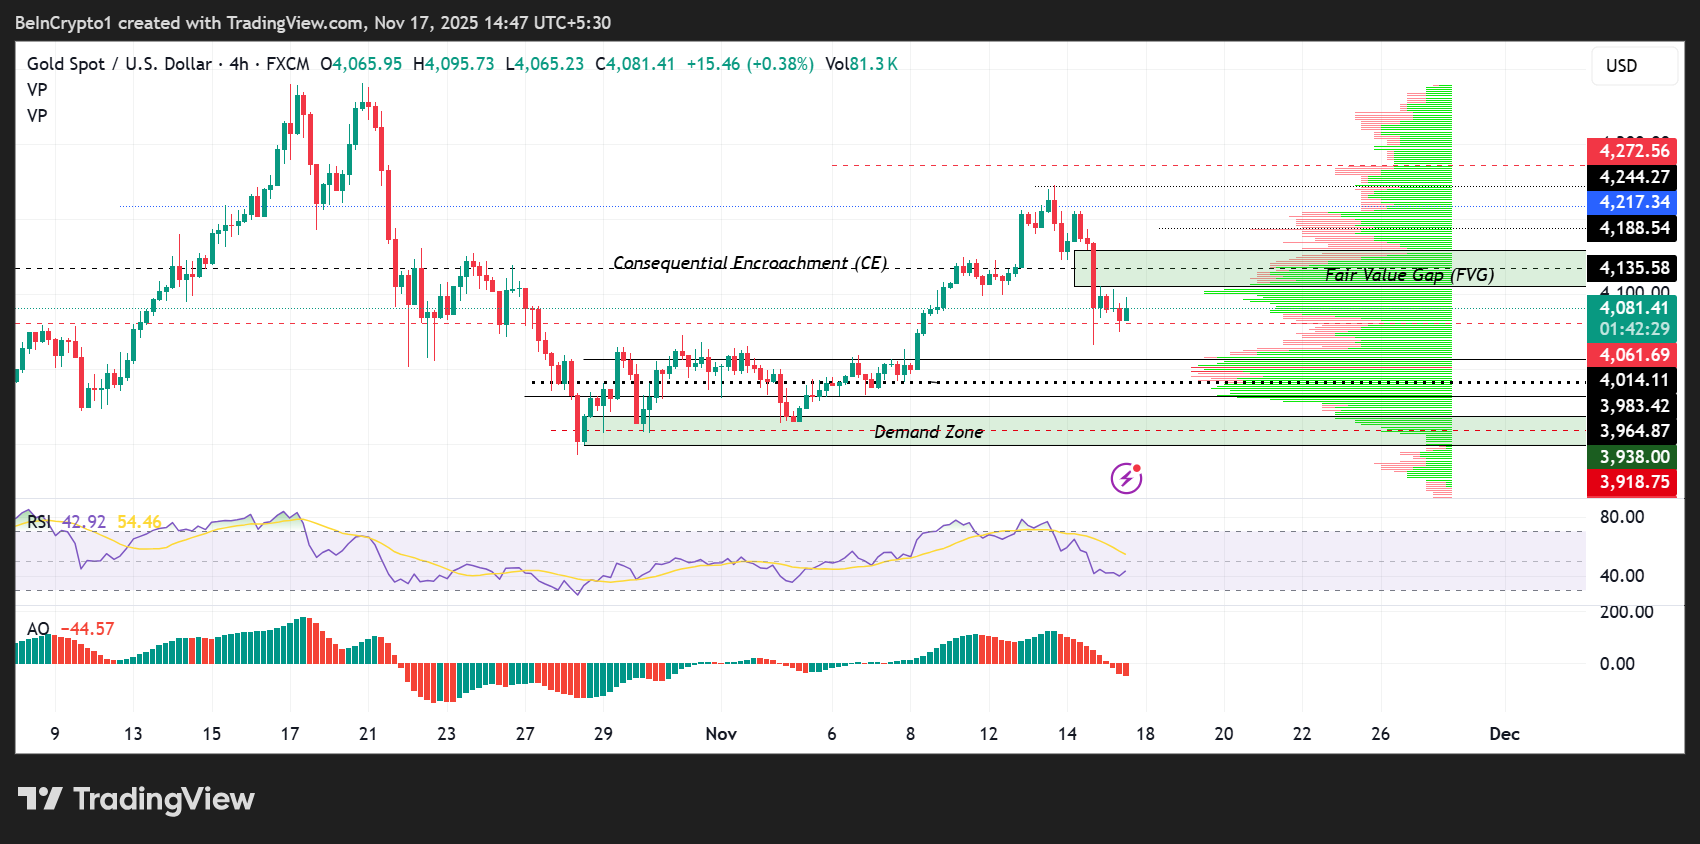
Gold trades near $4,081, consolidating after a brief price drop on November 14, as indicated by the long red candlestick. This drop resulted in a Fair Value Gap (FVG) of approximately $4,135–$4,188, representing an inefficiency in the XAU/USD market that needs to be addressed.
The chart shows a textbook example of a supply overhang, where bearish volume profiles (red horizontal bars) overlap with the midline of the FVG (Consequential Encroachment or CE) at $4,135.
A break and close above this midline on the 4-hour timeframe will confirm the continuation of the uptrend.
The gold price is now trading at $4,081, with bullish volume profiles (green horizontal bars) overhanging above it, indicating XAU is in the hands of the bulls. This adds credence to the thesis that the gold price could extend its rally to fill the imbalance due to the FVG.
 Gold (XAU) Price Performance. Source: TradingView
Beneath this sits a deeper Demand Zone at $3,983–$3,938, which historically attracted strong buying. If the price dips into this zone, a sharp bullish reaction is likely.
Momentum remains soft. The RSI at 42 is attempting a mild recovery but remains below the equilibrium level, indicating sellers still dominate.
The AO is deeply negative, confirming ongoing bearish momentum, although the histogram bars are shrinking, showing early signs of exhaustion.
For upside continuation, gold must reclaim the FVG at $4,135. A clean break and candle close above this zone would signal a bullish continuation toward $4,188 and the macro resistance at $4,244–$4,272. Conversely, failure to hold $4,061 risks a slide into the demand zone before any recovery.
Silver Risks Losing Support Due to the Trendline
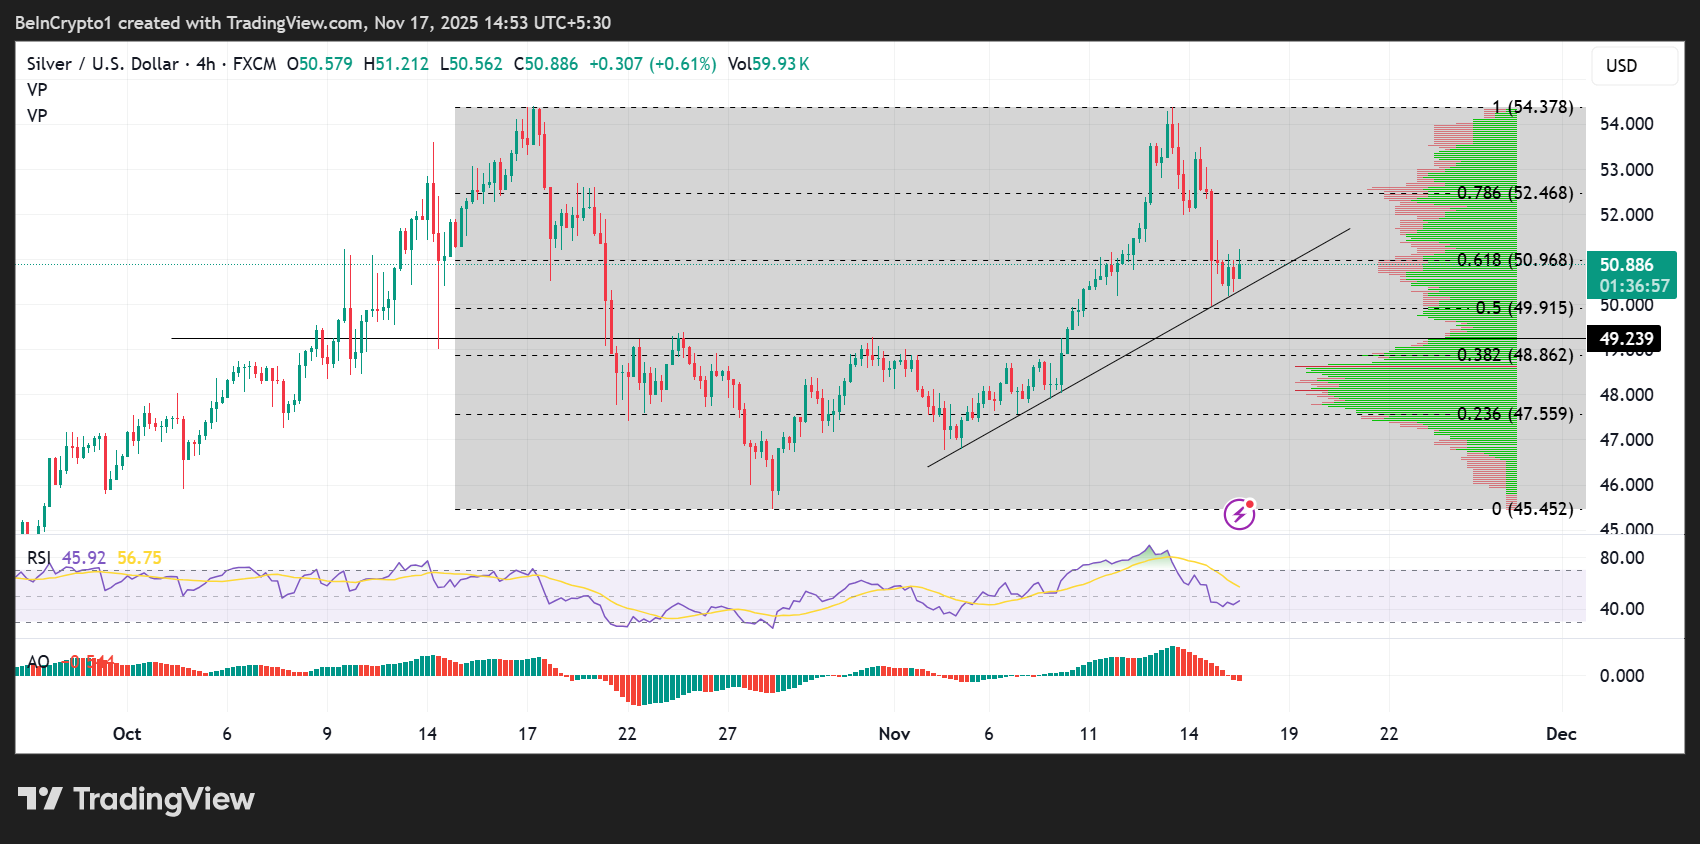
Silver is currently trading around $50.88, attempting to stabilize after a sharp pullback from the recent high at $54.37.
The correction found temporary support near the 61.8% Fibonacci retracement at $50.96, which has now turned into resistance, aligning with a rising trendline of support. This suggests buyers and sellers are defending this zone aggressively.
The Volume Profiles show a heavy node between $49.80–$51.20, indicating high liquidity and strong interest; this zone acts as a magnet for price.
A decisive close above the 61.8% Fibonacci retracement level could open the door back toward the 78.6% Fibonacci level at $52.46 and ultimately retest $54.37.
 Silver (XAG) Price Performance. Source: TradingView
However, a breakdown below the trendline would expose key supports at the 50% midrange of the Fibonacci indicator, at $49.91, and the 38.2% Fibonacci retracement level, at $48.86, both of which sit within strong previous consolidation.
Momentum indicators lean neutral-bearish. The RSI at 45 indicates a recovery attempt but remains below its midline, suggesting indecision following recent selling pressure.
The Awesome Oscillator is printing red bars, hinting that bearish momentum remains in control but is weakening.
Overall, silver is at a critical support, where bulls must hold the trendline. A bounce from here could fuel a new rally, while a breakdown risks a deeper correction toward $48–$49.
Recommended Articles


