

Cardano Price Forecast: ADA slips below $0.58 as bearish momentum and trader short bets intensify
- Cardano price drops over 6% on Monday, extending last week’s 10% slide amid continued selling pressure.
- On-chain and derivatives data suggest a bearish picture with daily active addresses declining and short positions at their highest level this month.
- The technical indicators show a downside outlook, with momentum signals suggesting further correction ahead.
Cardano (ADA) price slips 6%, trading below $0.58 at the time of writing on Monday, extending last week’s 10% fall. Weakening on-chain activity and rising short positions among traders signal growing bearish sentiment. The technical outlook suggests further correction, as momentum indicators signal weakness.
Cardano’s on-chain and derivatives show bearish bias
Santiment's Daily Active Addresses index, which helps track network activity over time, aligns with the bearish outlook. A rise in the metric signals greater blockchain usage, while declining addresses point to lower demand for the network.
In Cardano's case, Daily Active Addresses have fallen to 24,280 on Monday from 32,115 on October 11 and have been constantly dropping since August. This fall indicates that demand for ADA's blockchain usage is decreasing, which could drive a further drop in Cardano’s price.
 [10-1762145847128-1762145847130.12.33, 03 Nov, 2025].png)
Cardano’s Daily Active Addresses chart. Source: Santiment
On the derivatives side, CoinGlass’s ADA long-to-short ratio, which stands at 0.75 on Monday, is the lowest value in a month. This ratio, below one, reflects bearish sentiment in the markets, as more traders are betting on the asset price to fall.
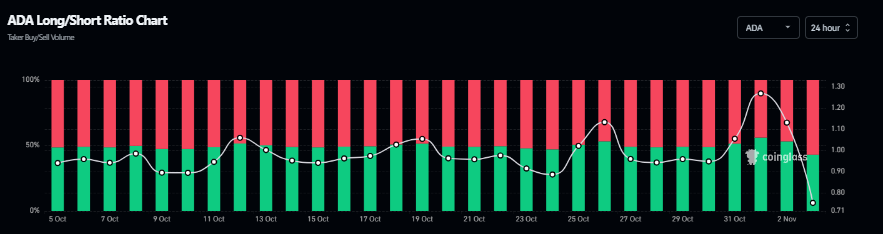
Cardano’s long-to-short ratio chart. Source: Coinglass
Cardano Price Forecast: ADA momentum indicators show bearish signs
Cardano's price faced rejection at the daily $0.70 level last week and declined by over 10%. At the time of writing on Monday, ADA is trading down at $0.57.
If ADA continues its downward trend, it could extend the correction toward the next daily support at $0.49.
The Relative Strength Index (RSI) on the daily chart reads 32, below the neutral level of 50, indicating strong bearish momentum. The Moving Average Convergence Divergence (MACD) lines are also converging, with decreasing green histogram bars signaling fading bullish momentum.
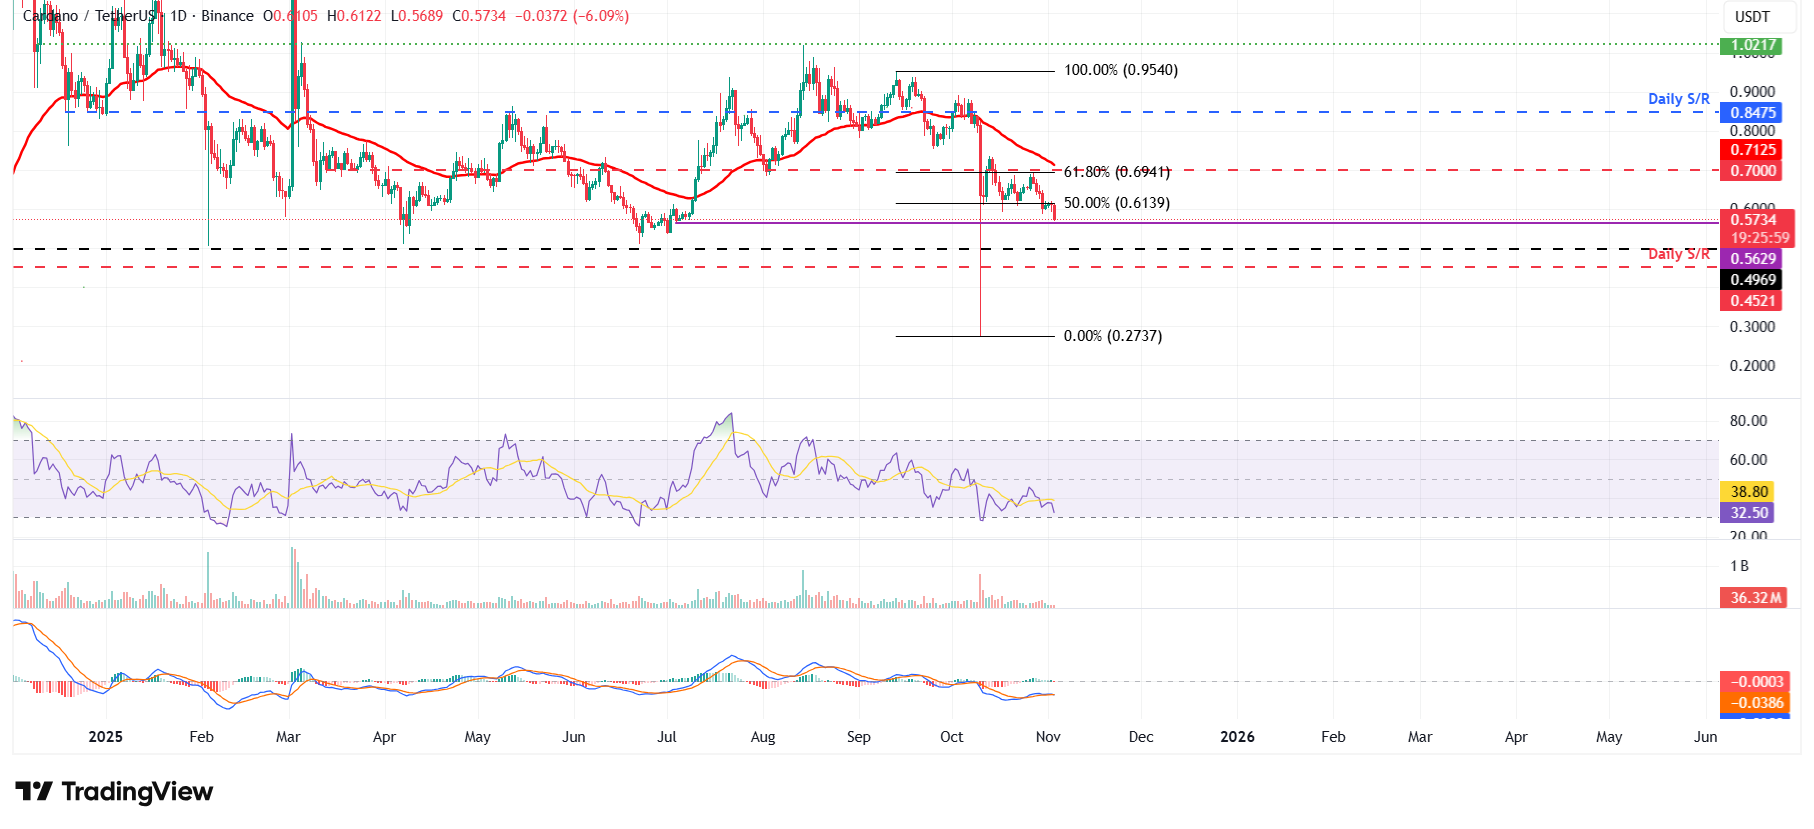
ADA/USDT daily chart
On the other hand, if ADA recovers, it could extend the recovery toward the daily resistance level at $0.70.
Recommended Articles


