


Pi Coin Is Pumping — Price Rally Could Extend If This Key Breakout Holds
Pi Coin (PI) price has rallied nearly 24% in the past 24 hours at press time, cutting its monthly losses to about 4%. But even with this rebound, the token is still down over 40% in the past three months, meaning the broader downtrend hasn’t ended.
While the move looks impressive, several signals suggest that this might be a short-term bounce inside a larger bearish setup unless the Pi Network token clears one critical resistance level.
Buying Momentum Fades Despite the Jump
PI’s price has recovered sharply, but key indicators show that underlying strength may not support this rally for long. Between October 6 and October 27, the PI price made a lower high, while the Relative Strength Index (RSI), a measure of buying and selling strength, formed a higher high.
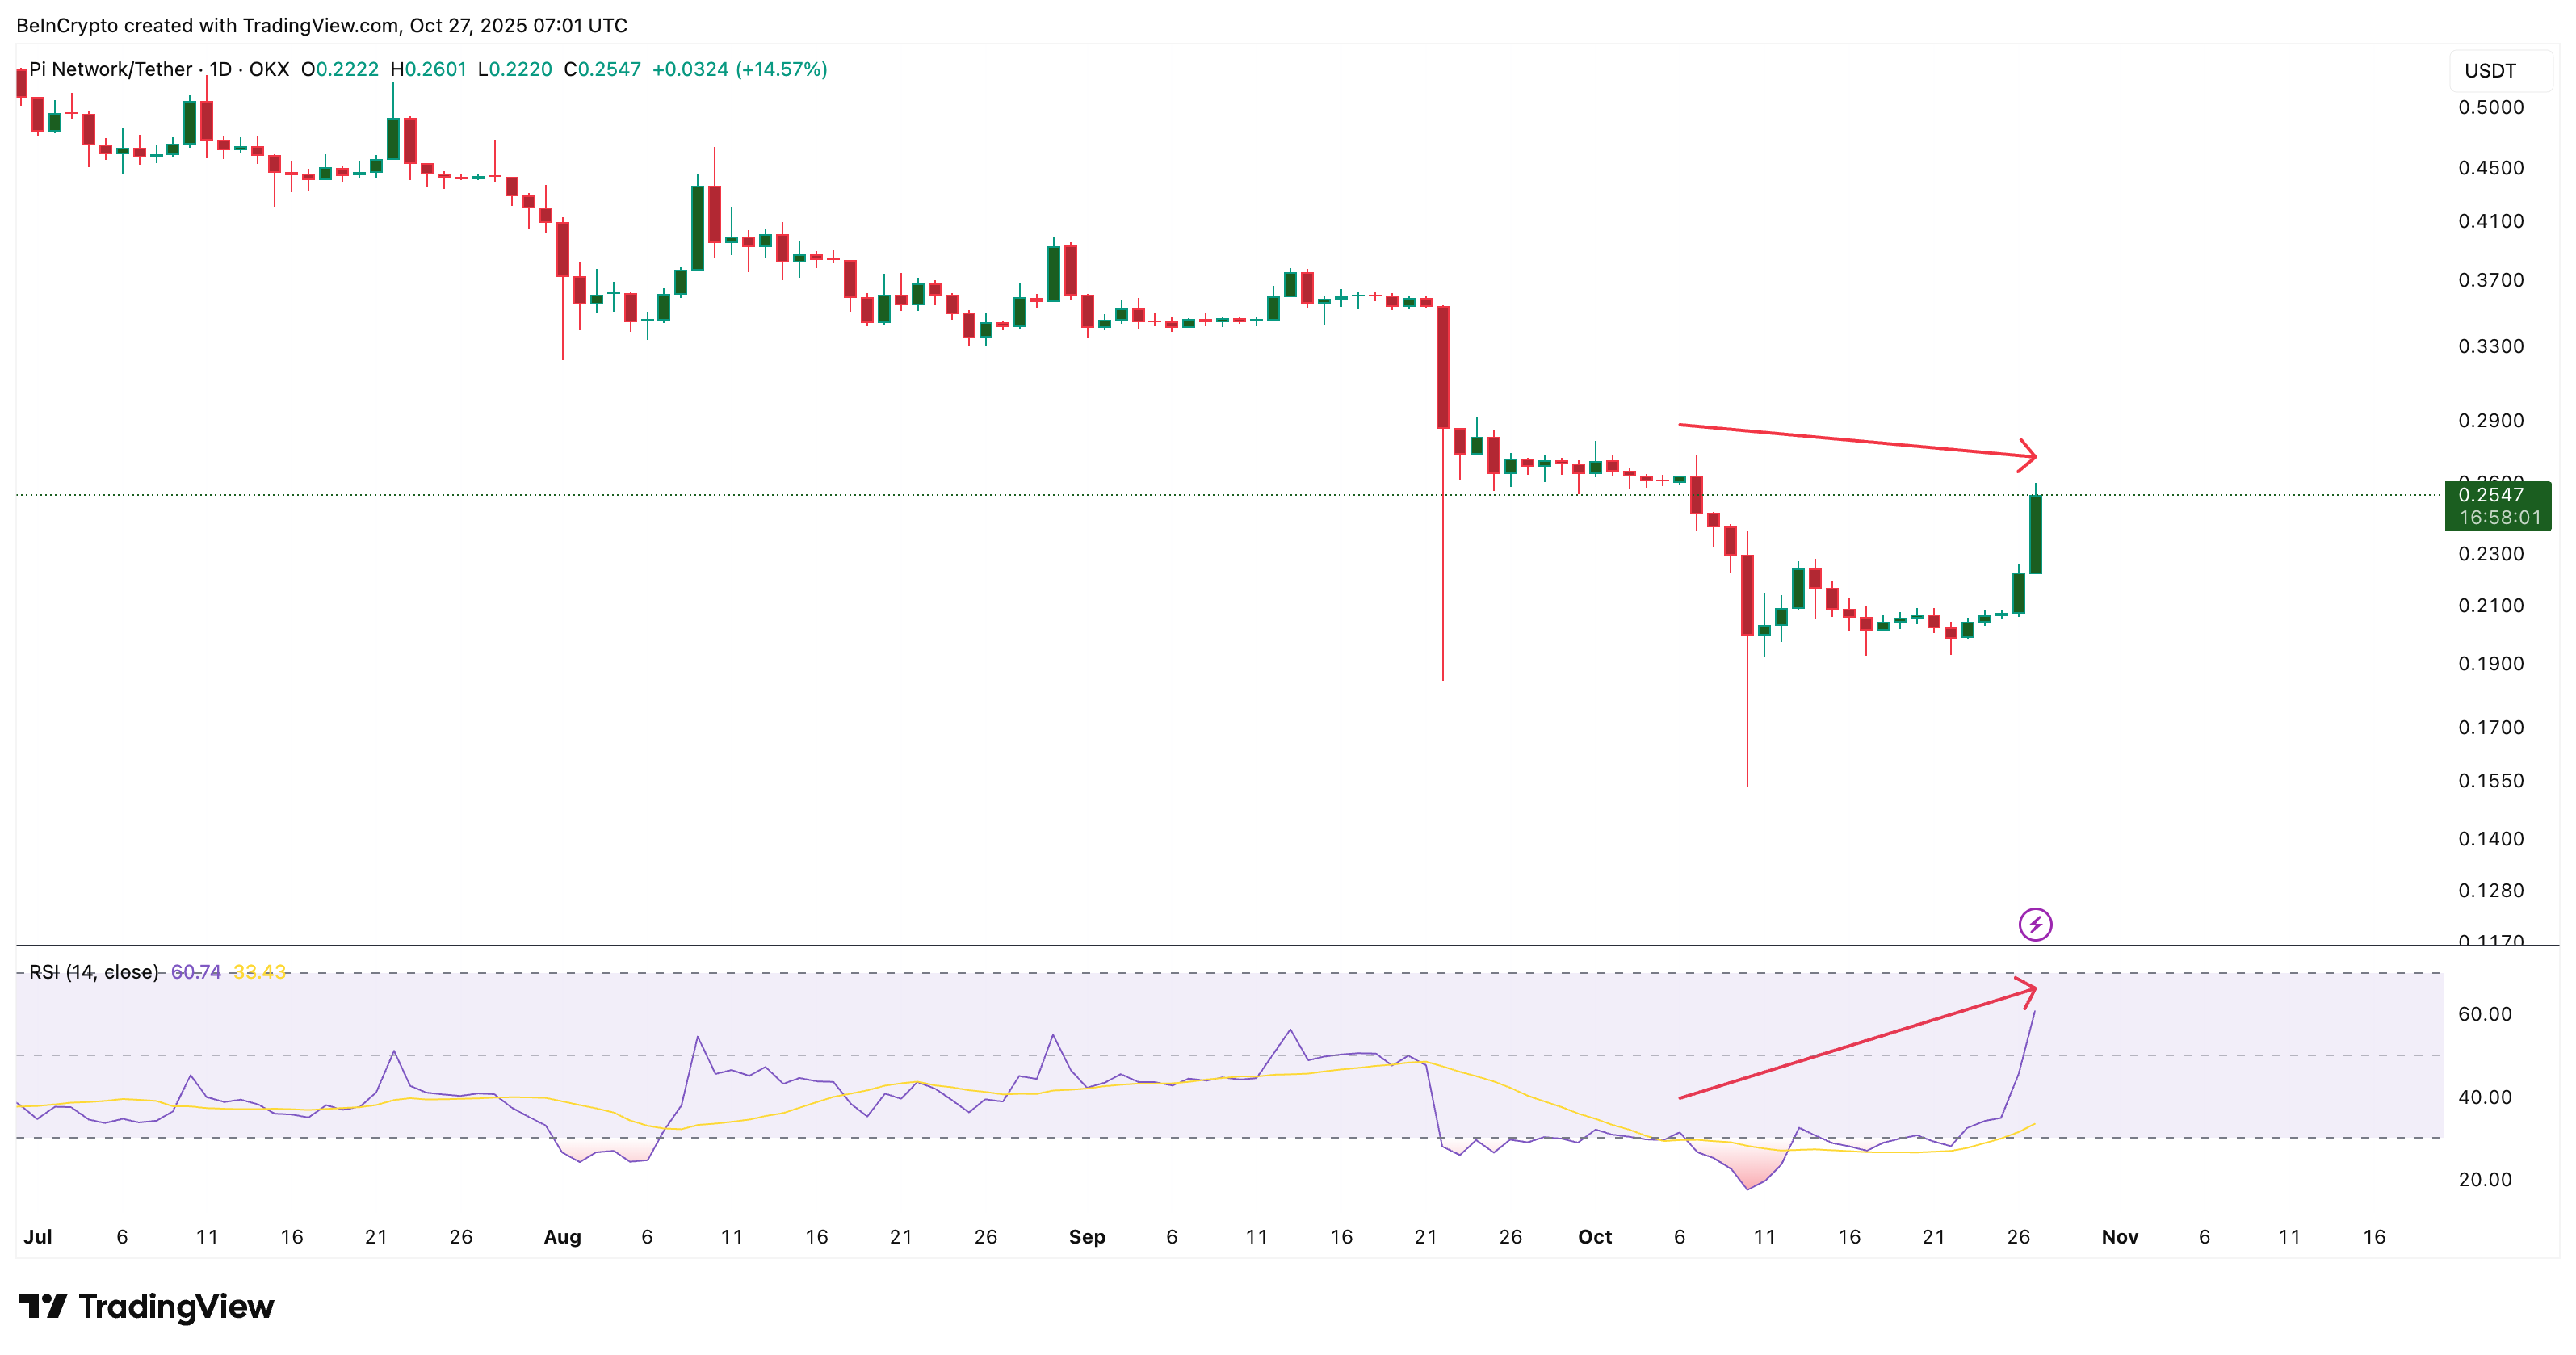 Pi Coin And Hidden Bearish Divergence: TradingView
Want more token insights like this? Sign up for Editor Harsh Notariya’s Daily Crypto Newsletter here.
That pattern is a hidden bearish divergence, which typically means the broader downtrend could continue despite a short-term rise. This indicates that while prices are rebounding, they’re doing so within a weak underlying structure.
The Money Flow Index (MFI), which tracks real capital inflows, tells a similar story. Since October 24, the price has made a higher high, but the MFI has printed a lower high, meaning there’s less new money entering the market even as prices push higher.
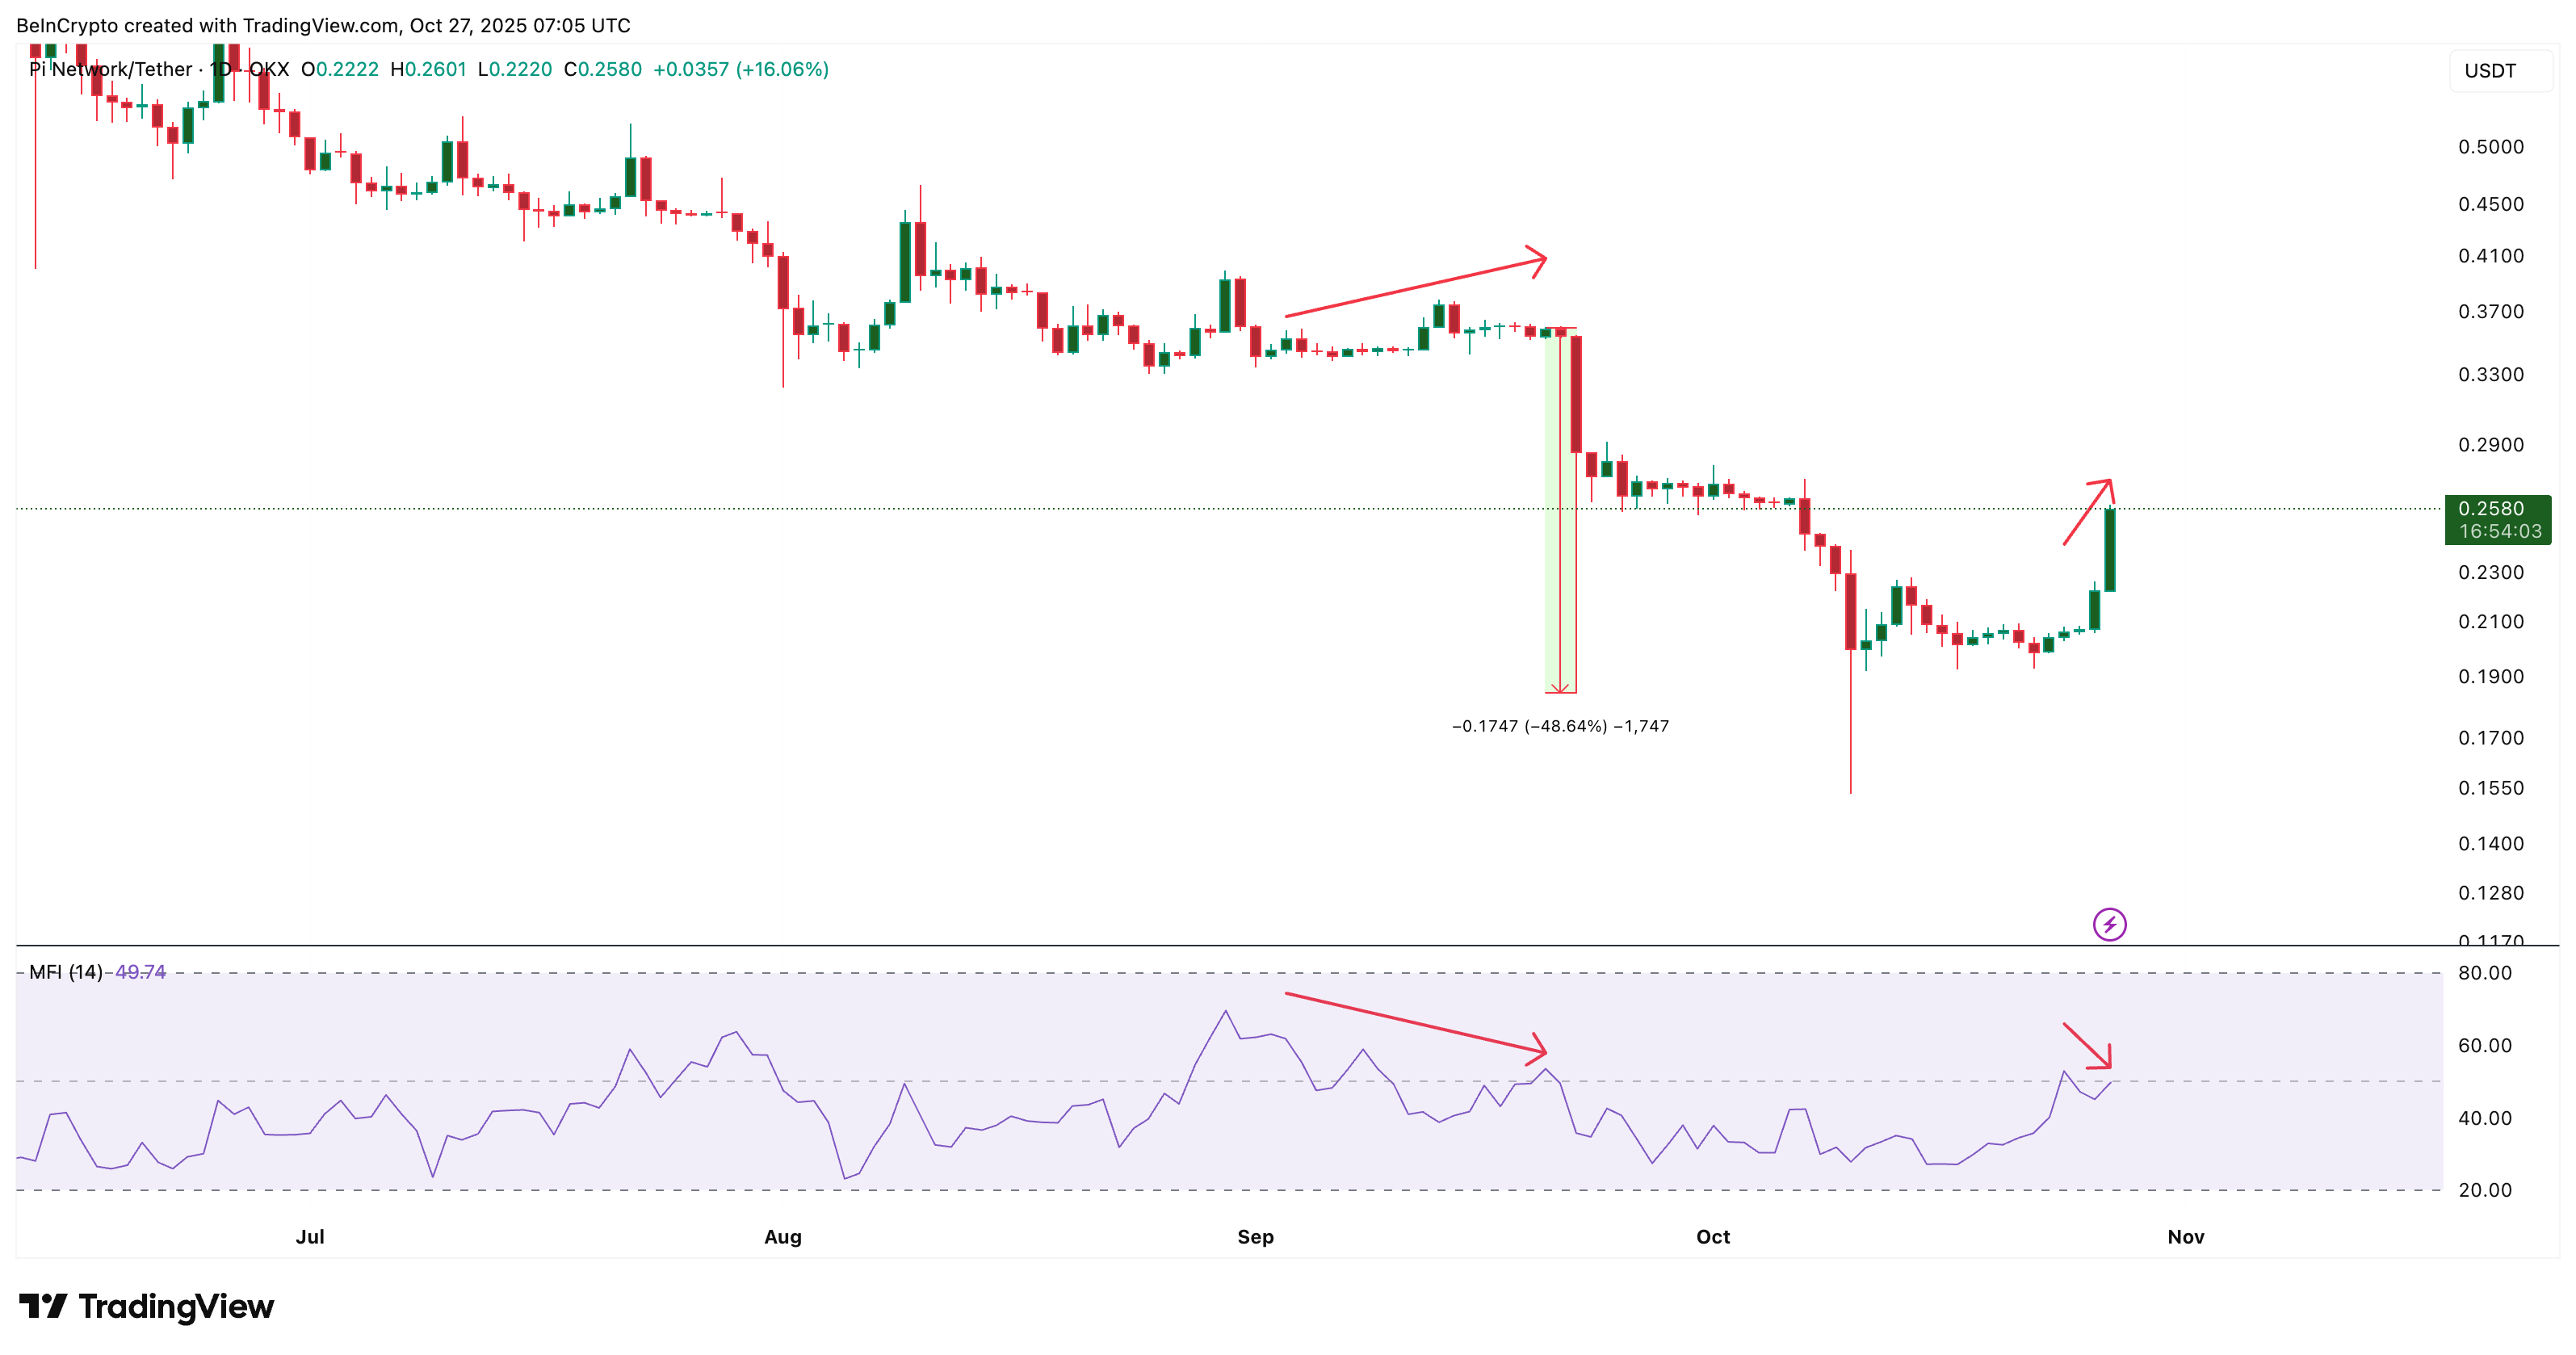 Money Flows Not As Strong: TradingView
This same combination appeared between September 3 and September 20, and the Pi Coin price dropped about 48% shortly after. While not a guarantee of a repeat, the pattern suggests that this rally could lose steam once buying pressure slows.
Short-Term Charts Still Show Some Upside
Despite those bearish divergences, the short-term trend still leaves room for a bit more upside.
On the 4-hour chart, the 20-period Exponential Moving Average (EMA), a fast-reacting average that tracks recent price momentum, has crossed above the 50-period EMA, signaling a possible short-term bullish phase.
The 20-period EMA is now approaching the 100-period EMA, and if it crosses above, it could trigger another burst of buying. This type of EMA crossover is often seen when traders start building short-term long positions after a rebound.
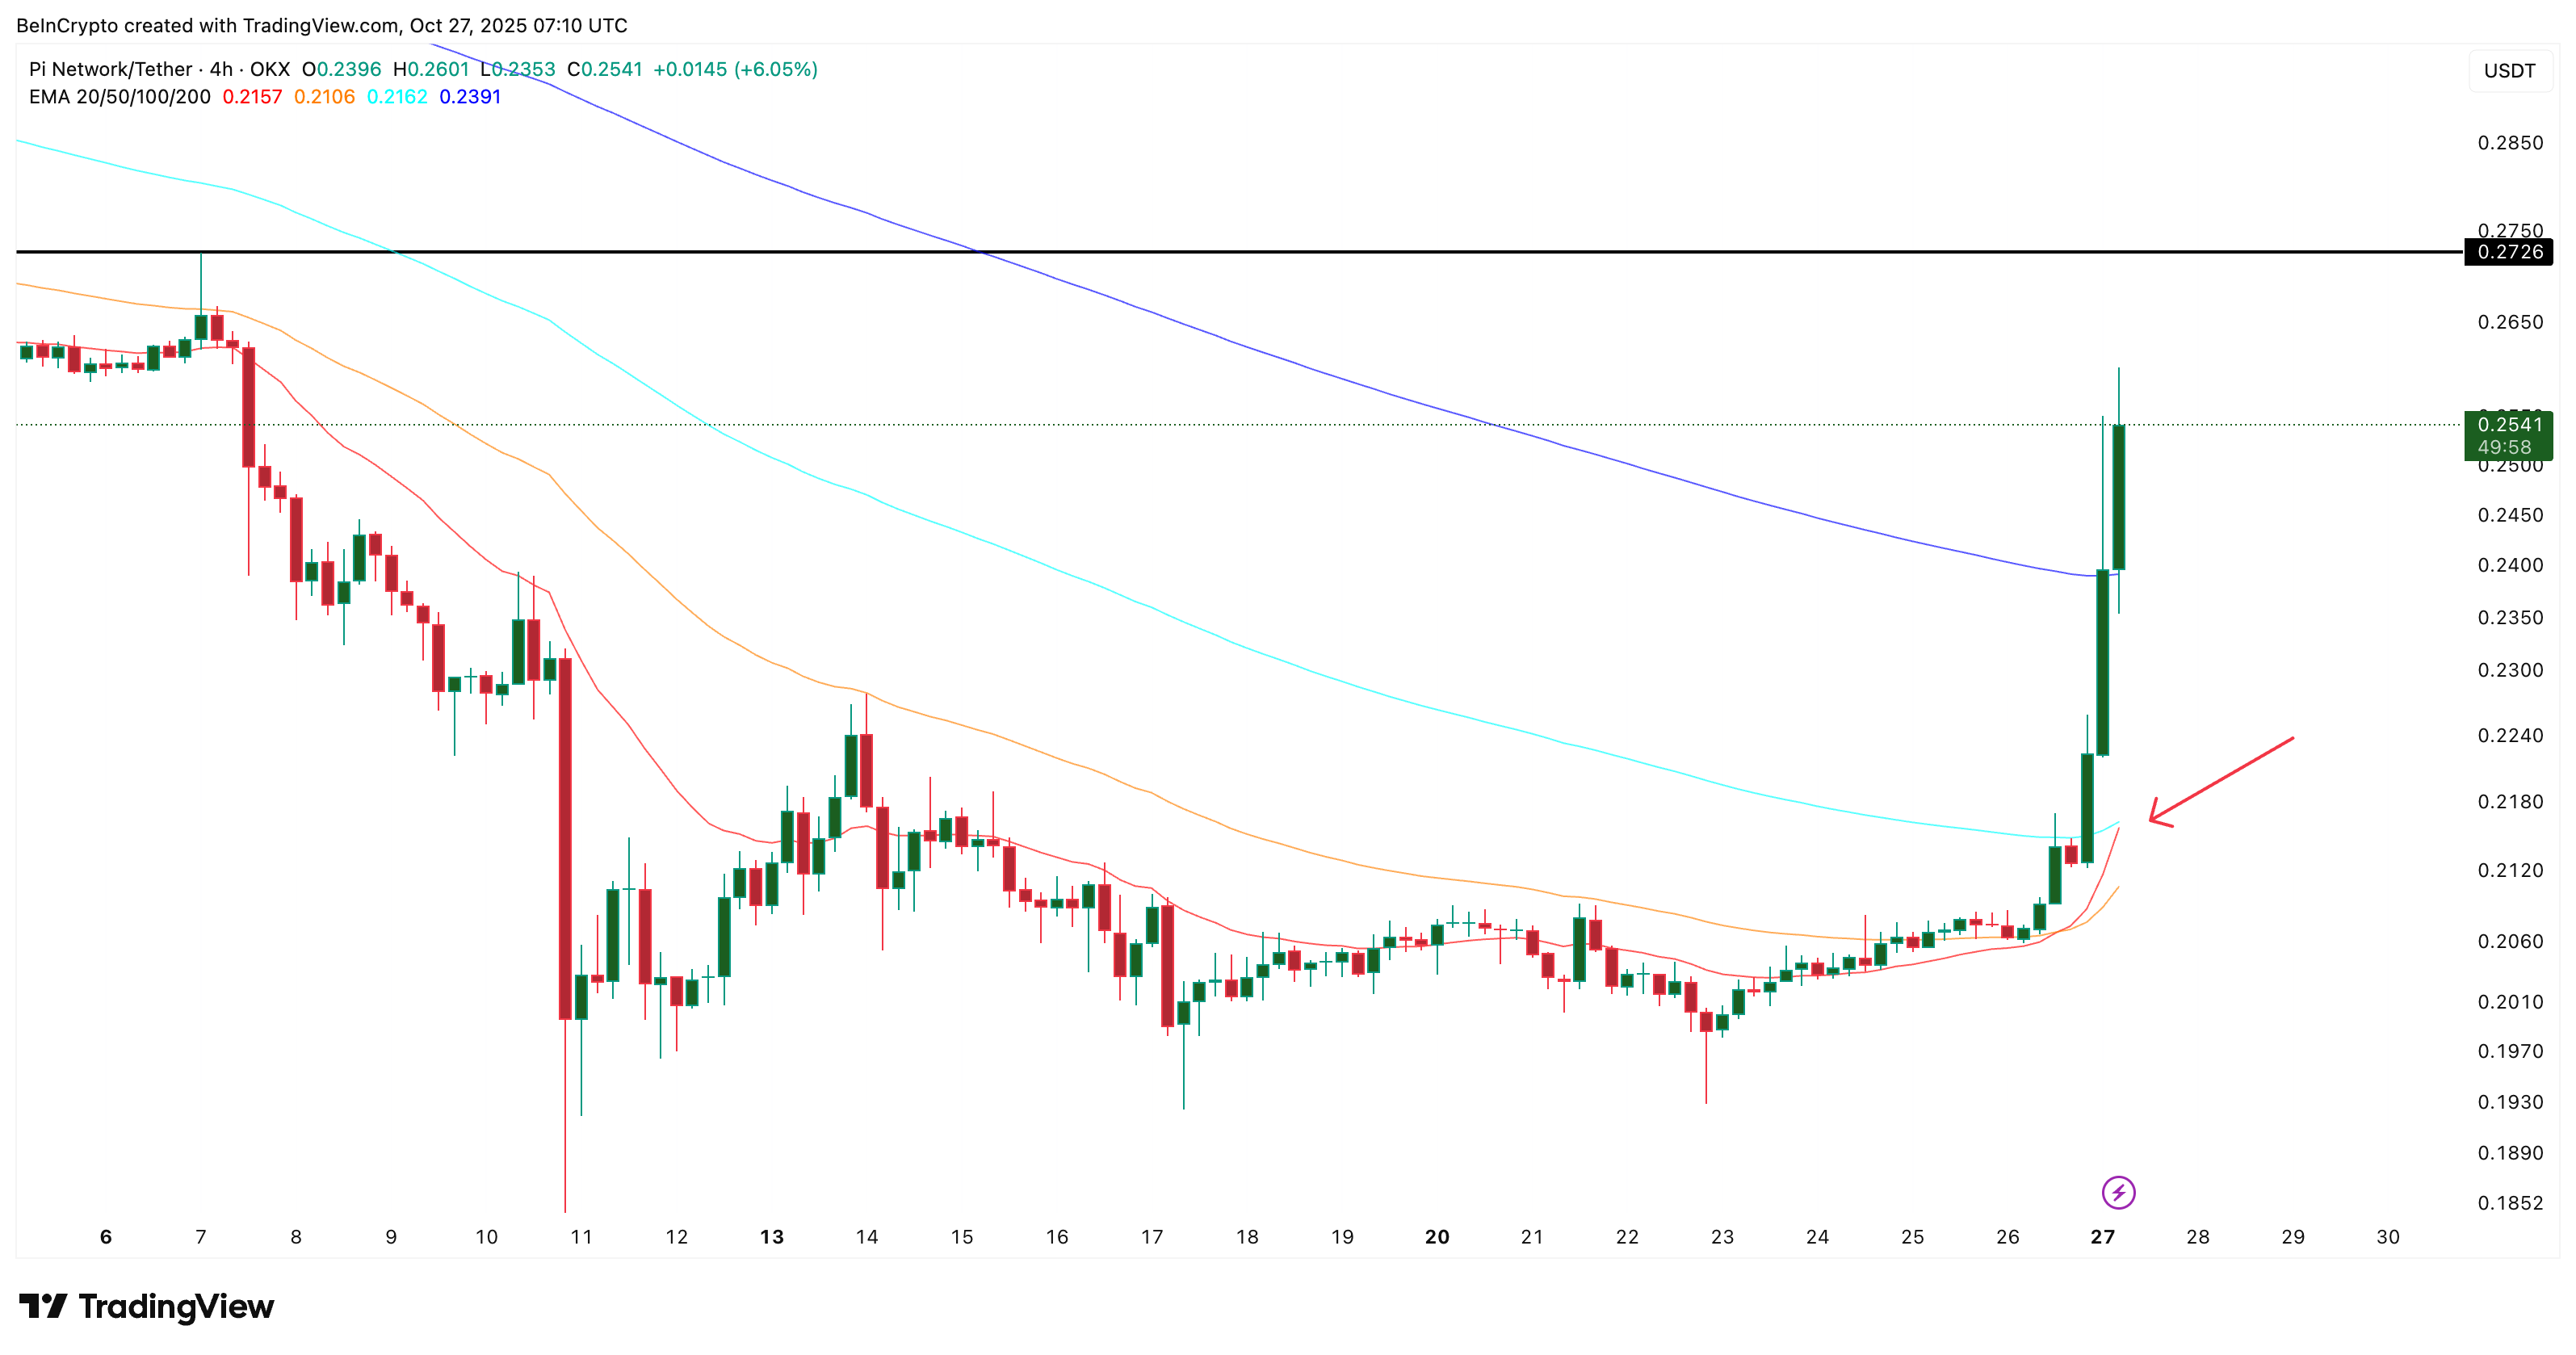 Pi Coin 4-Hour Price Chart: TradingView
If that happens, Pi could rise toward $0.27, a nearby resistance level.
Key Resistance Could Decide The Next Pi Coin Price Move
On the daily chart, Pi Coin remains within a falling broadening wedge, which is typically a bullish reversal pattern. This structure often forms during extended downtrends and can signal that selling pressure is weakening.
Right now, the Pi Coin price faces a crucial resistance zone at $0.28. It is worth noting that while the shorter-term chart hints at a move towards $0.27, a stronger rally will only continue post-clearing $0.28.
A daily candle close above that key level would confirm a breakout from the wedge and could open the way toward $0.36, a gain of about 41% from current levels.
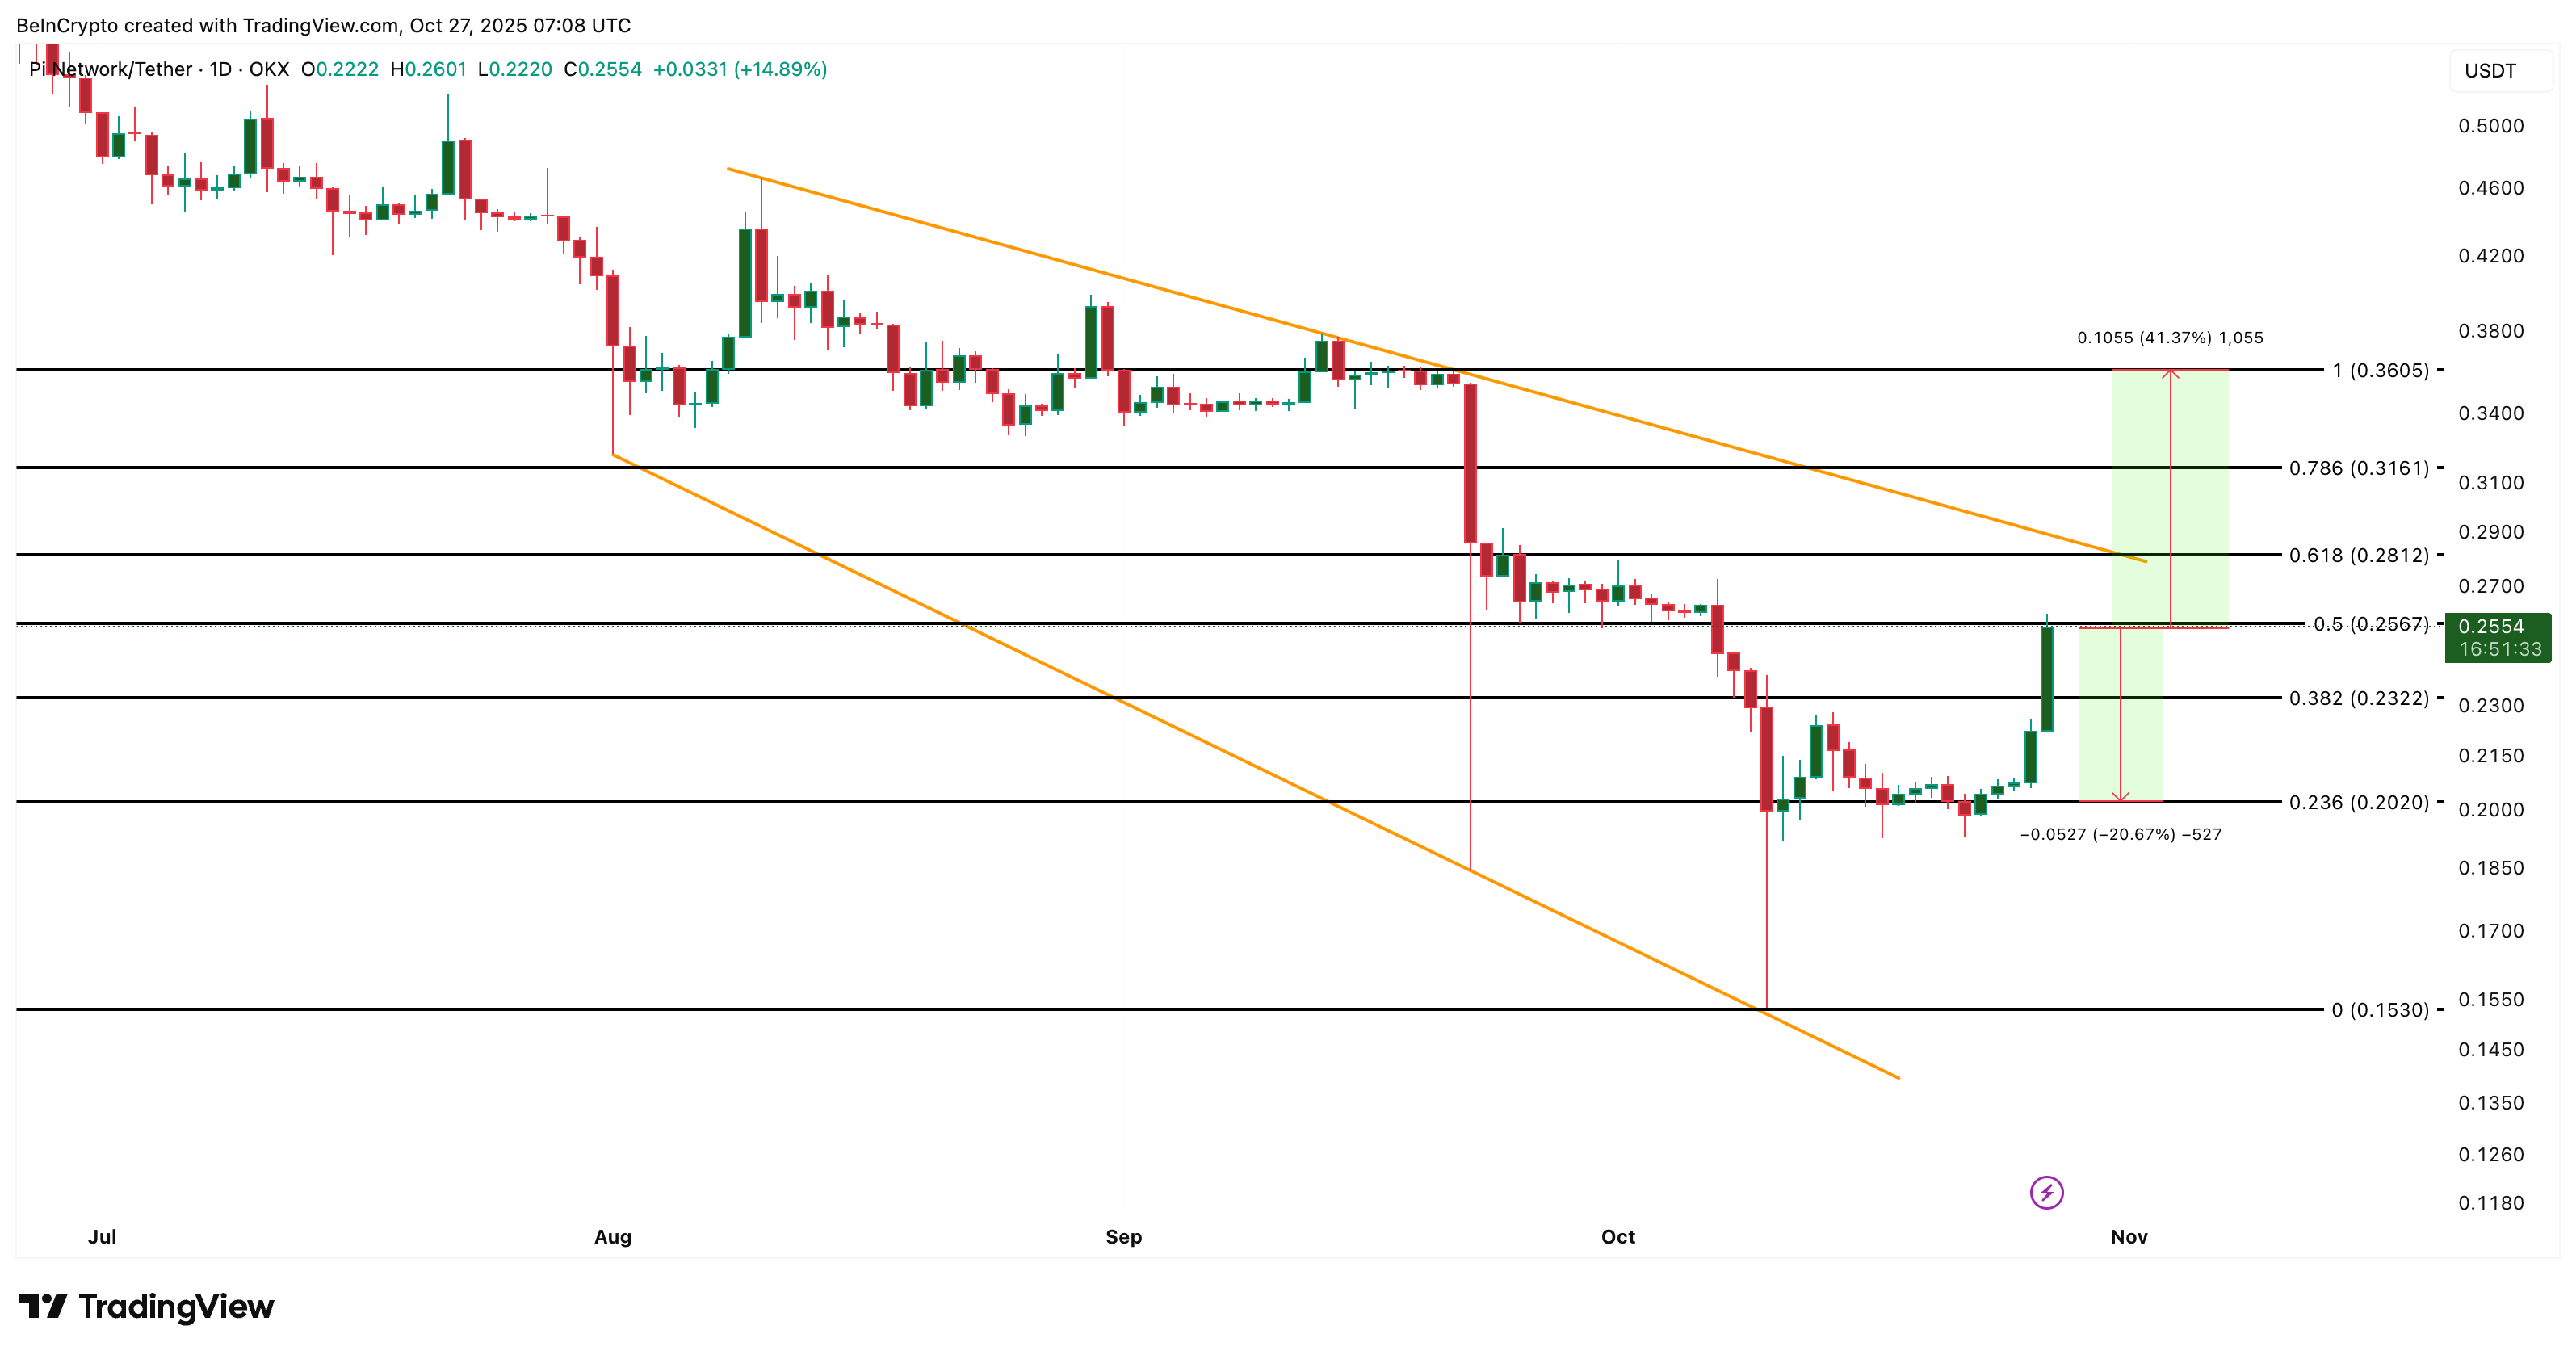 Pi Coin Price Analysis: TradingView
However, if PI fails to clear this level, sellers could return quickly. A drop below $0.20 (a 20% drop) would expose the token to further declines toward $0.15.
Recommended Articles


