


XRP Flashes TD Buy Signal: Start Of Fresh Rally?
A cryptocurrency analyst has pointed out how a rebound could be about to begin for XRP after the Tom Demark (TD) Sequential flashed a buy signal.
TD Sequential Has Given A Buy Signal For XRP
In a new post on X, analyst Ali Martinez has talked about a TD Sequential signal that has appeared on XRP’s 4-hour price chart. The TD Sequential refers to a technical analysis (TA) indicator that’s generally used for locating points of probable reversal in any asset’s price.
The indicator involves two phases: the setup and countdown. In the first of these, it counts up candles of the same color up to nine. These candles don’t have to be consecutive. Once the nine candles are in, it signals that the prevailing trend has reached a state of exhaustion, with the price now potentially reaching a turnaround.
Naturally, this signal is a sell one if the candles leading up to the setup’s completion were green. Similarly, the asset could be assumed to have hit a bottom if nine red candles were involved instead. As soon as the setup is over, the countdown picks off. This phase works in much the same manner, with the only difference being that it lasts for thirteen candles, not nine. Once these thirteen candles are also in, the price attains another top/bottom.
Now, here is the chart shared by Martinez that shows the TD Sequential signal that has recently formed for the 4-hour XRP price:
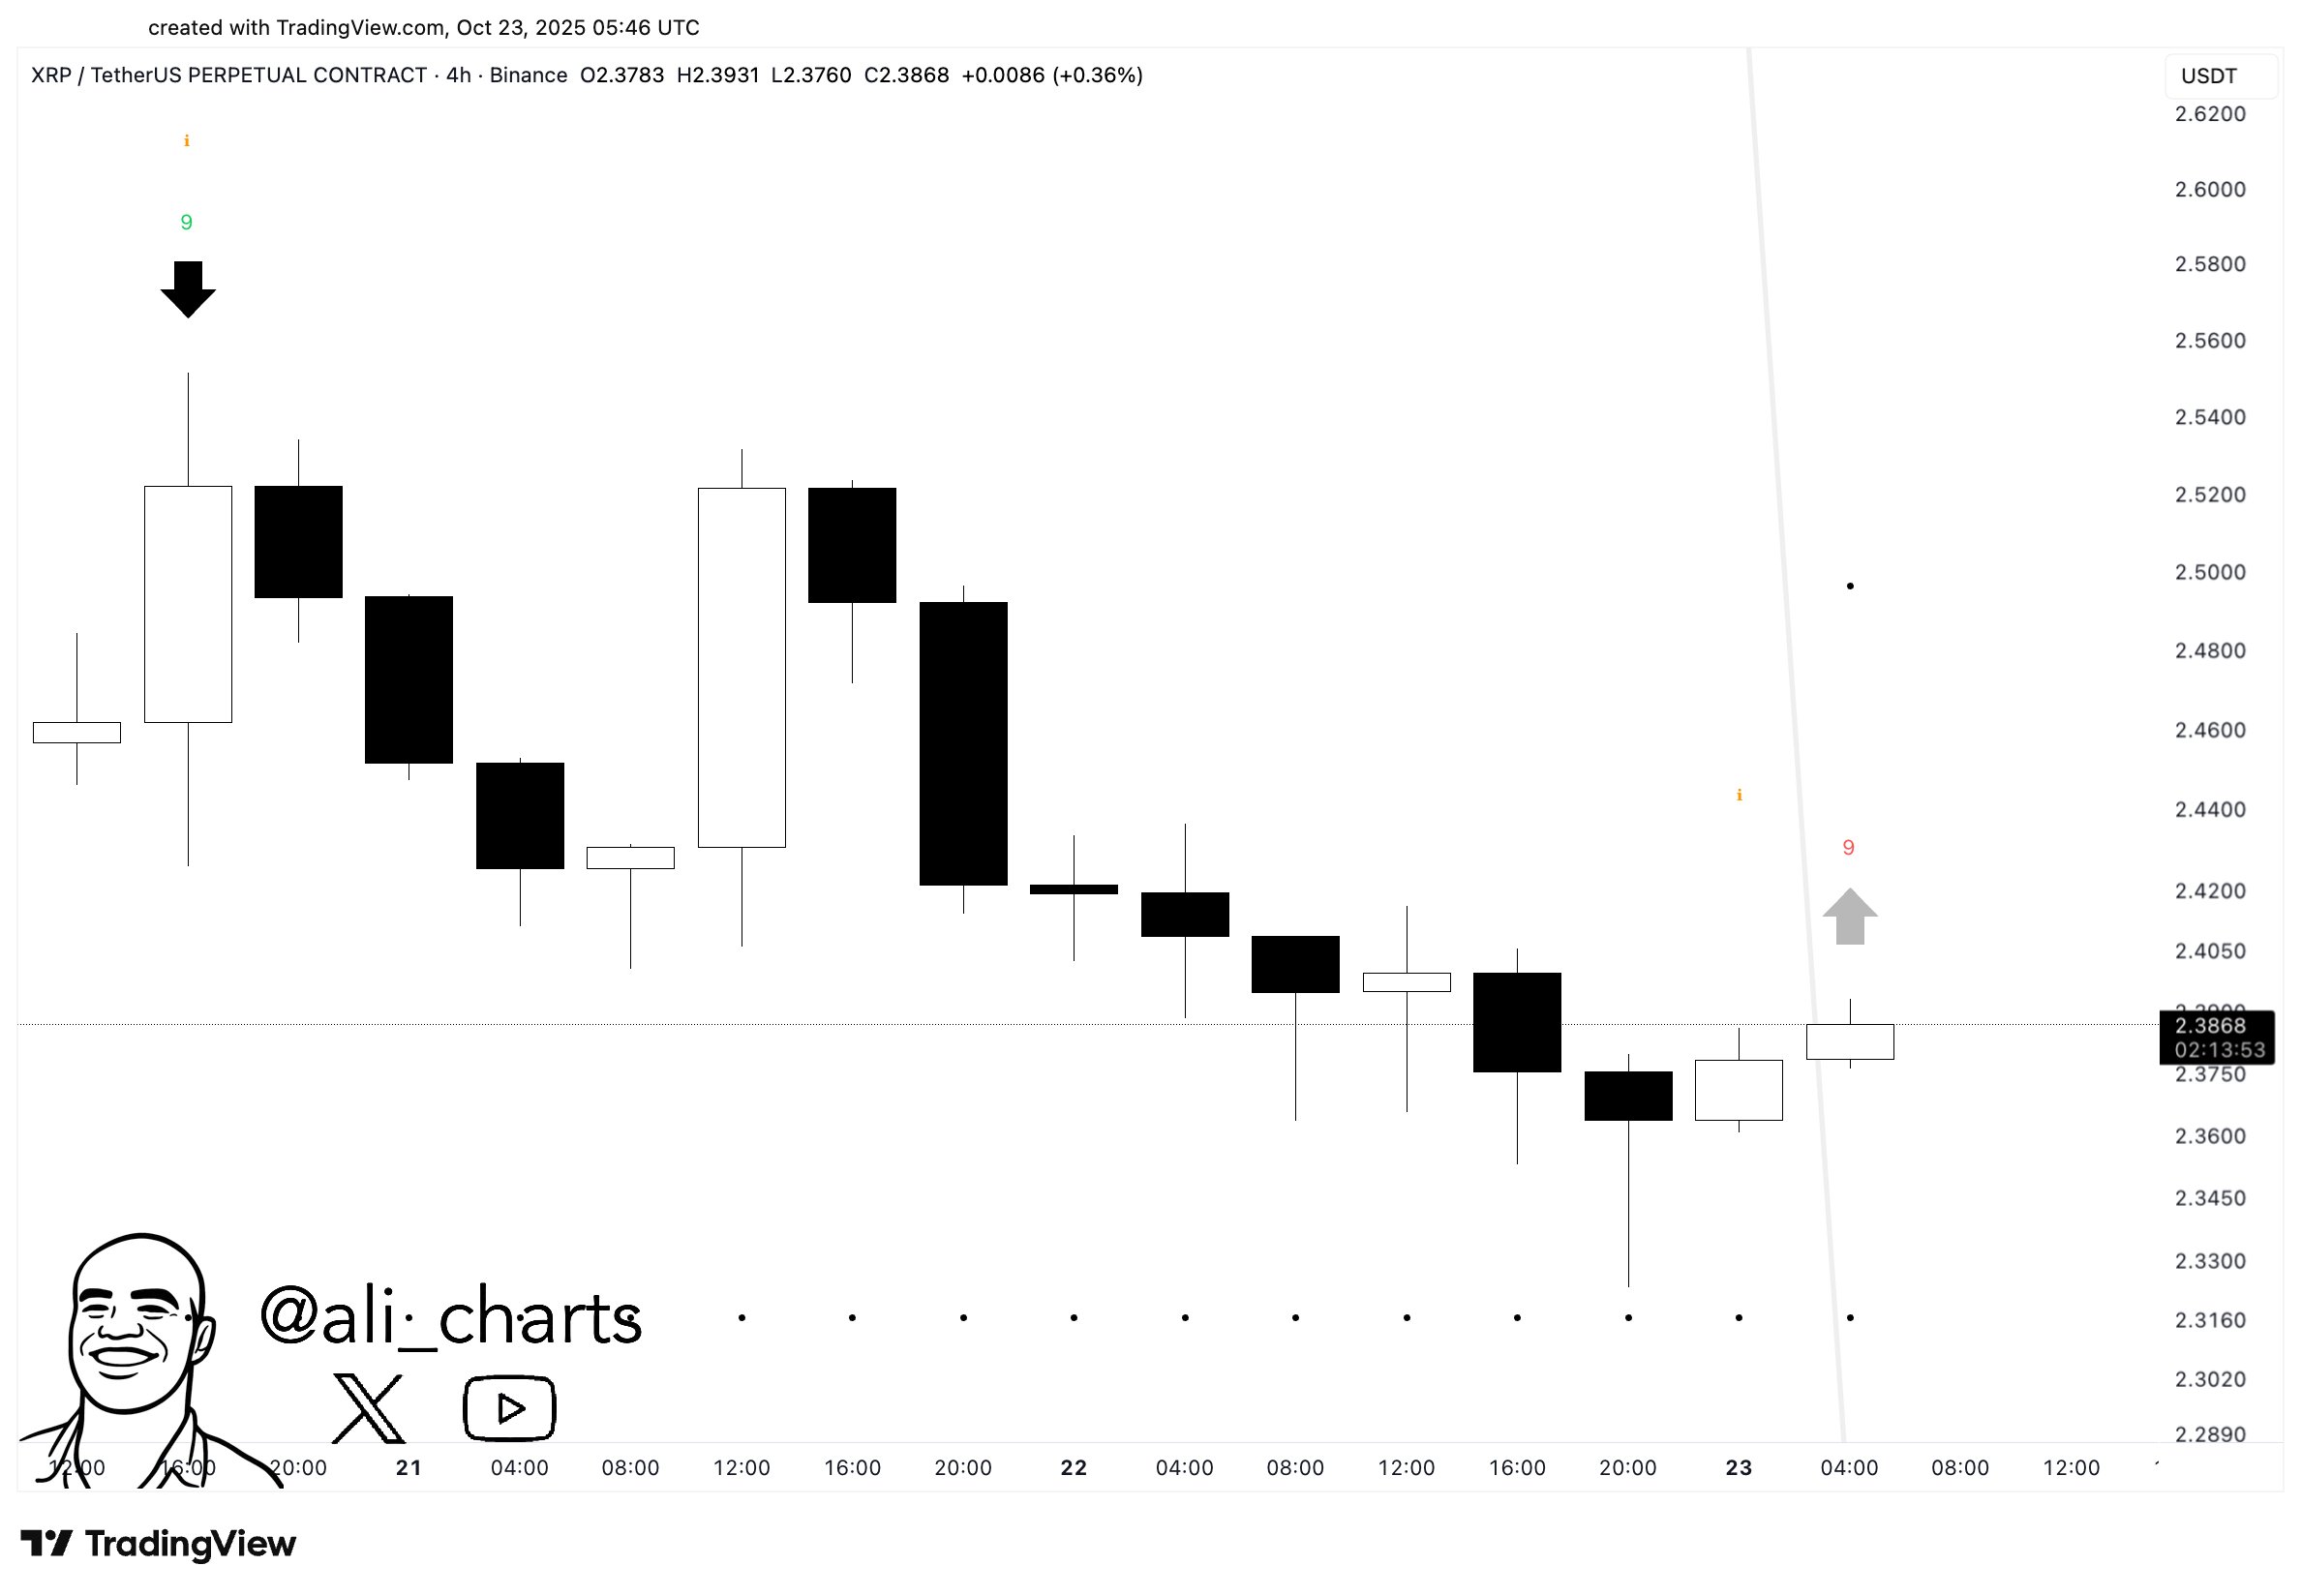
As displayed in the above graph, this TD Sequential setup has appeared after a drawdown in the XRP price, suggesting the coin may be due for a reversal to the upside. “Looks like the rebound is about to begin!” noted the analyst.
Since the signal has appeared, the asset has already witnessed a bounce, implying that its bullish effect could be in action. It now remains to be seen whether this would lead to a fresh rally for the asset, or if the recovery will fizzle out before long.
XRP isn’t the only altcoin that has seen a TD Sequential setup recently. As Martinez has explained in another X post, Chainlink (LINK) has also witnessed the same signal on its 4-hour price chart.
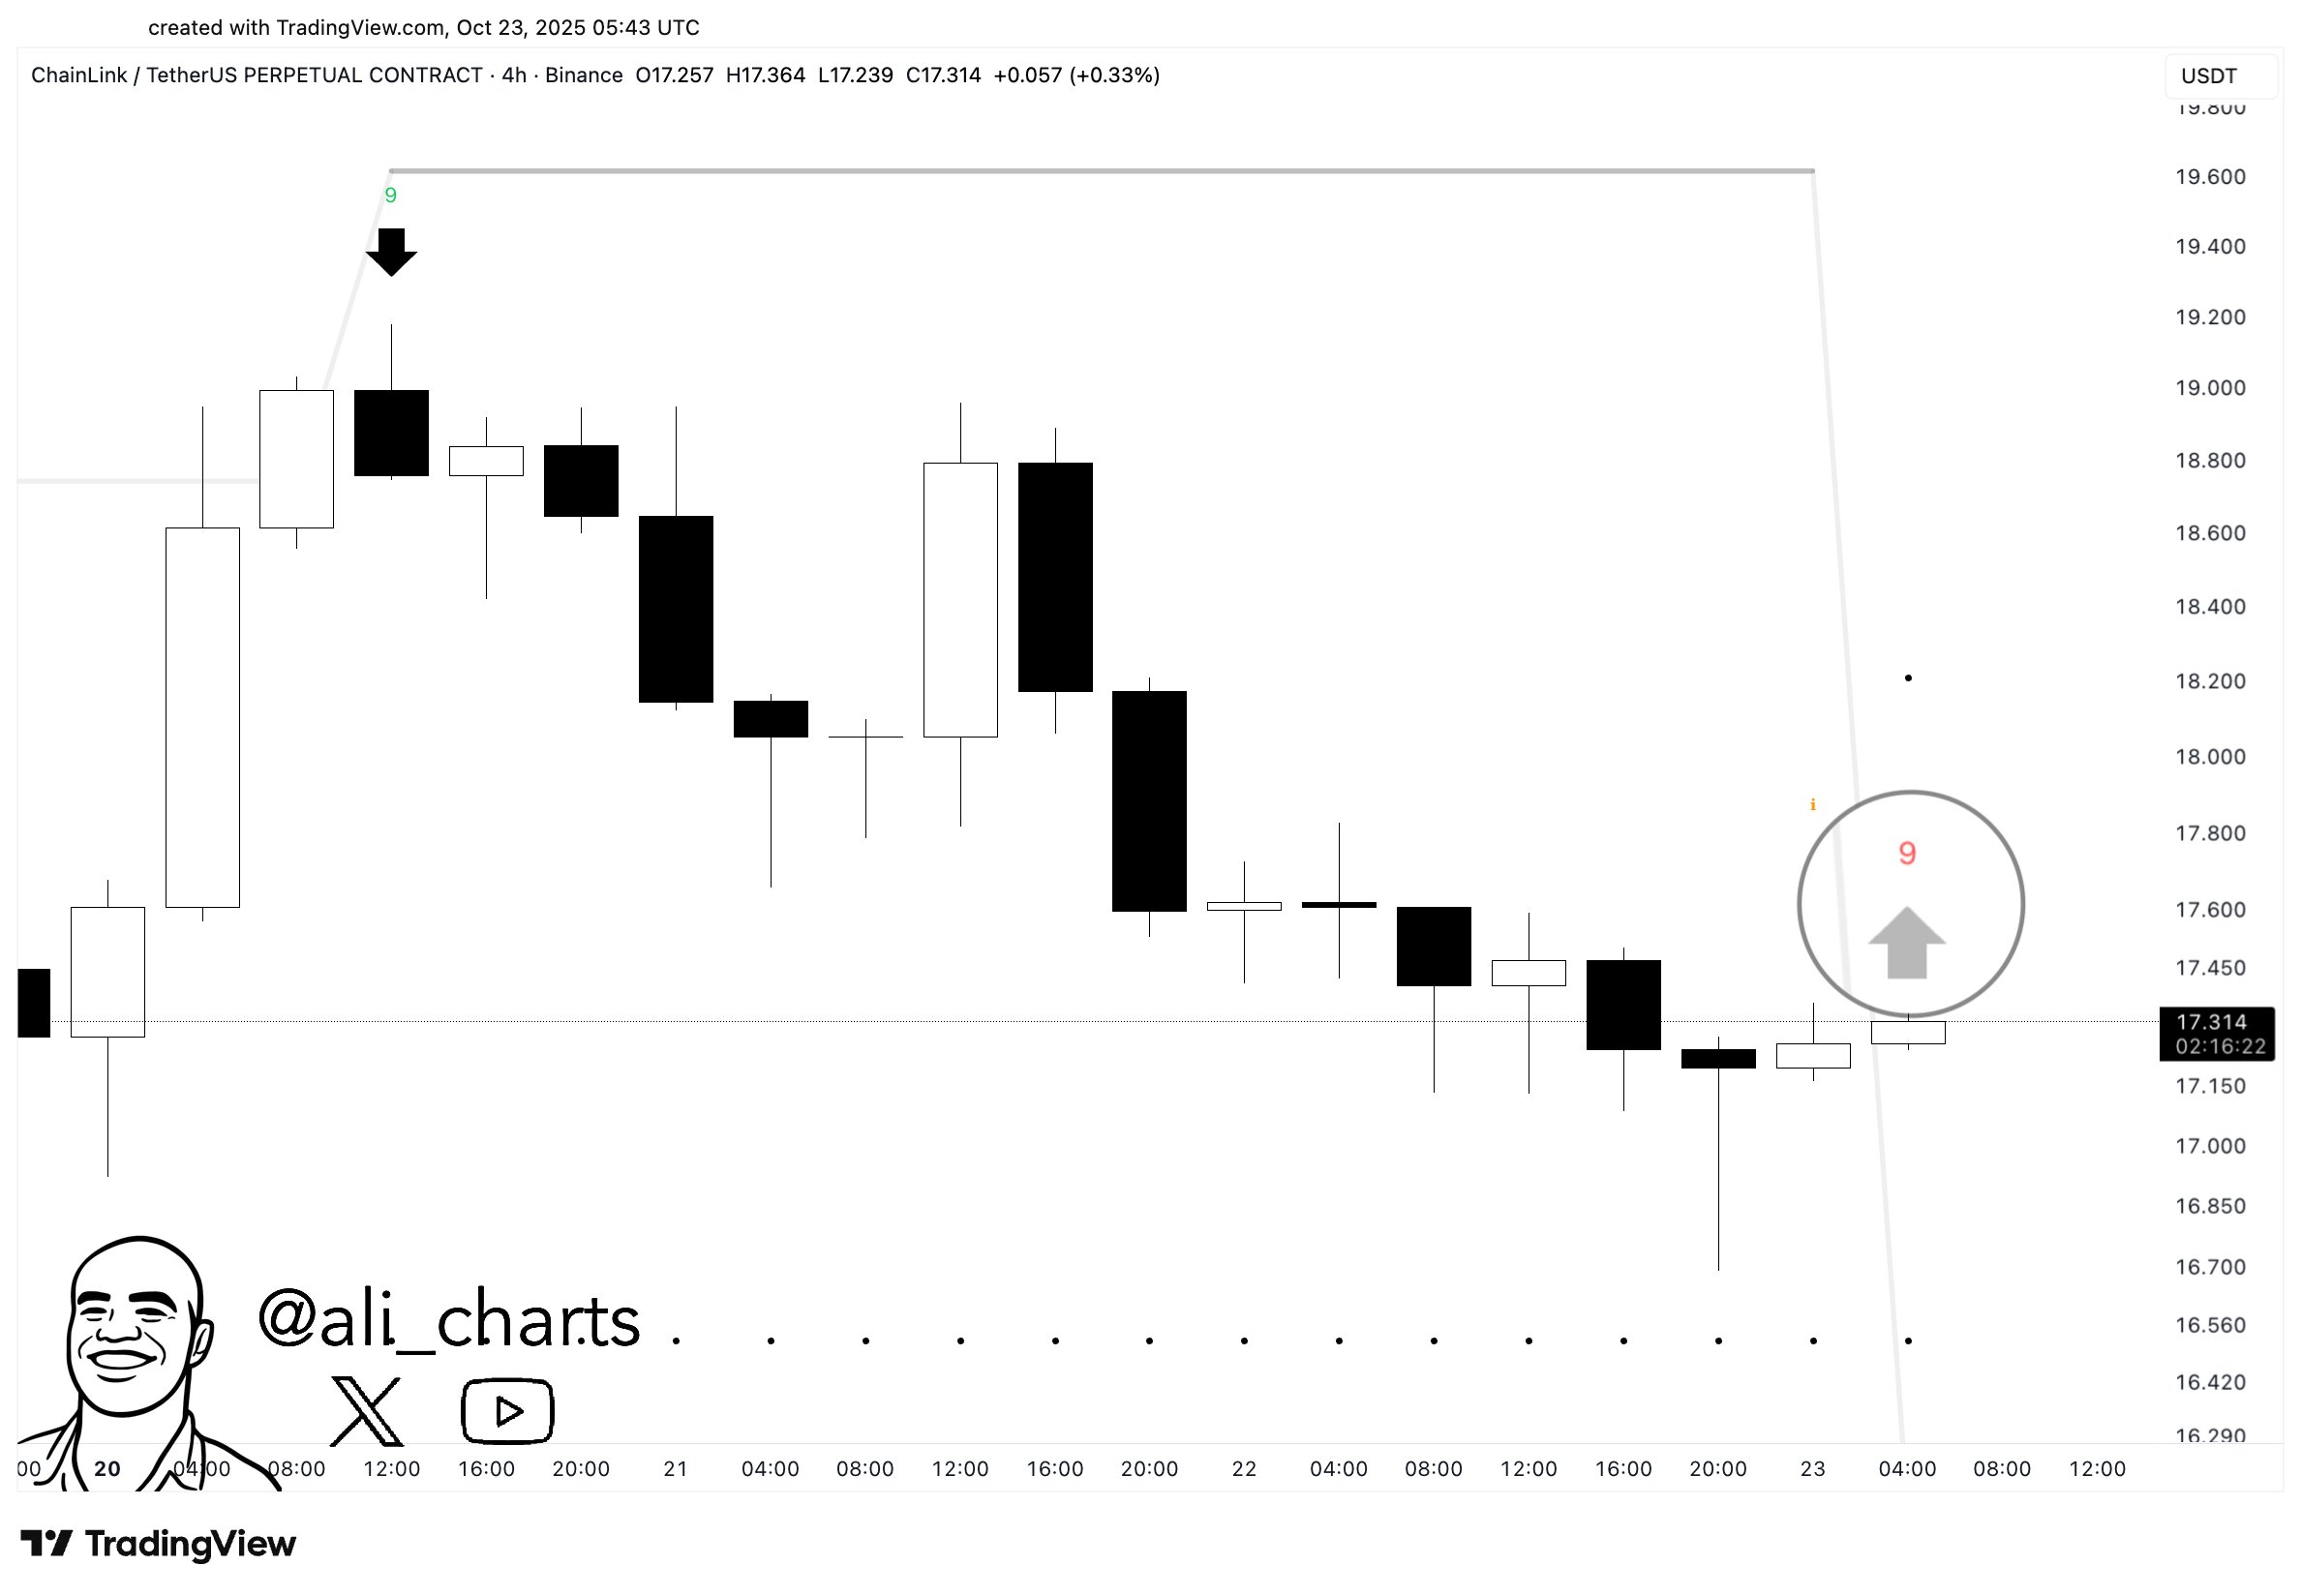
From the graph, it’s visible that LINK has also completed this TD Sequential setup with nine red candles, indicating that the cryptocurrency may also be heading toward bullish price action. “The bounce could start any moment now!” said the analyst.
XRP Price
At the time of writing, XRP is floating around $2.45, up more than 9% over the last seven days.
Recommended Articles


