

Crypto Today: Bitcoin, Ethereum, XRP stabilize amid ETF inflows resurgence
- Bitcoin struggles to hold above the 200-day EMA as institutional investors increase demand for ETFs.
- Ethereum declines for the third consecutive day, targeting $3,680 support.
- Bears tighten grip on XRP as Death Cross pattern highlights a weakening technical structure.
Bitcoin (BTC) steadies above $108,000 at the time of writing on Wednesday, after facing rejection from resistance at $114,000 the previous day. However, a resurgence of BTC spot Exchange Traded Funds (ETFs) inflows supports a short-term bullish outlook.
Meanwhile, Ethereum (ETH) and Ripple (XRP) show signs of weakness amid negative market sentiment due to macroeconomic uncertainty, profit booking and the lack of key price catalysts to sustain their recovery.
Data spotlight: Bitcoin, Ethereum ETF inflows signal institutional demand
Bitcoin spot ETFs listed in the US saw inflows of approximately $477 million on Tuesday, breaking four consecutive days of outflows. The bullish comeback reflects steady demand from institutional investors, with the cumulative total net inflow near $62 billion.
ETFs have been a significant driver of Bitcoin’s rally, often signaling growing investor interest. If inflows continue to trickle in, the odds of a rebound toward the range high of $114,000 will significantly increase as selling pressure is absorbed.
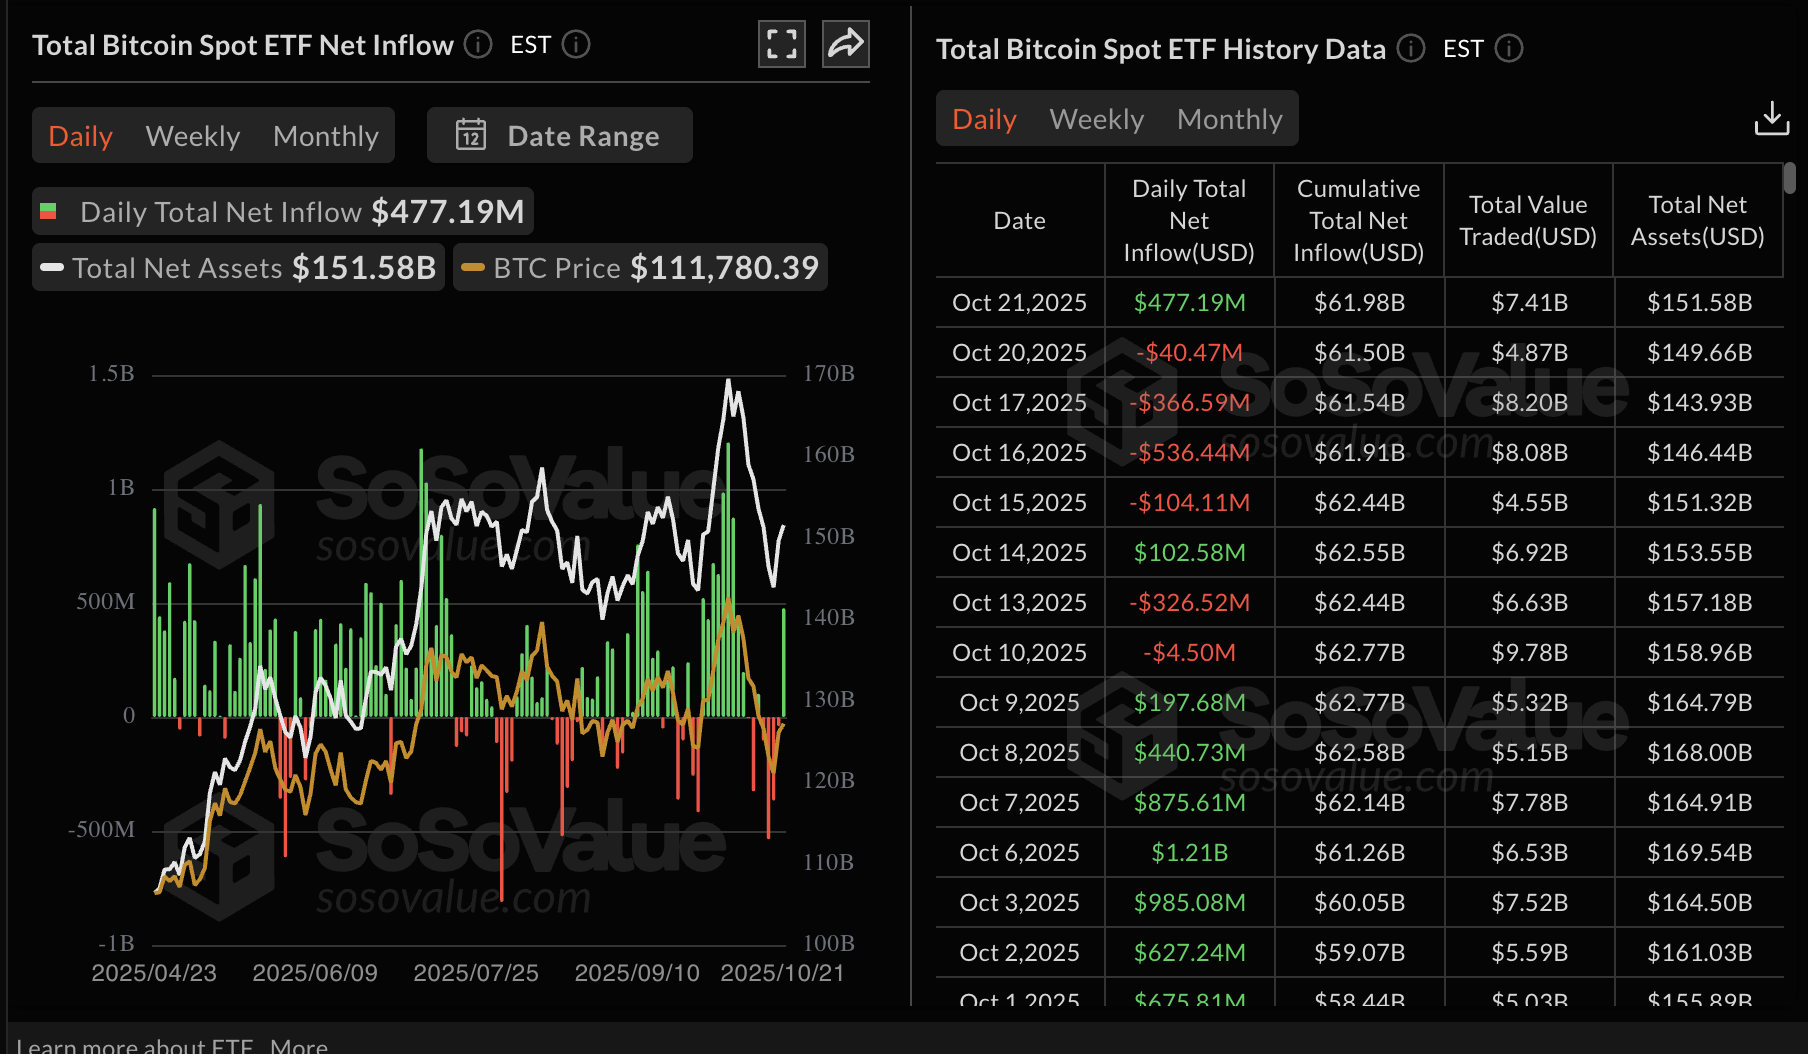
Bitcoin ETF stats | Source: SoSoValue
On the other hand, Ethereum spot ETFs experienced inflows of nearly $142 million on Tuesday, signaling the risk-on sentiment surrounding the largest smart contracts token.
Cumulatively, Ethereum ETFs have a total net inflow of approximately $15 billion with net assets averaging $27 billion.
To sustain the Ethereum price above the $4,000 level, institutions need to steadily pile into ETFs, which often boosts confidence for retail investors.
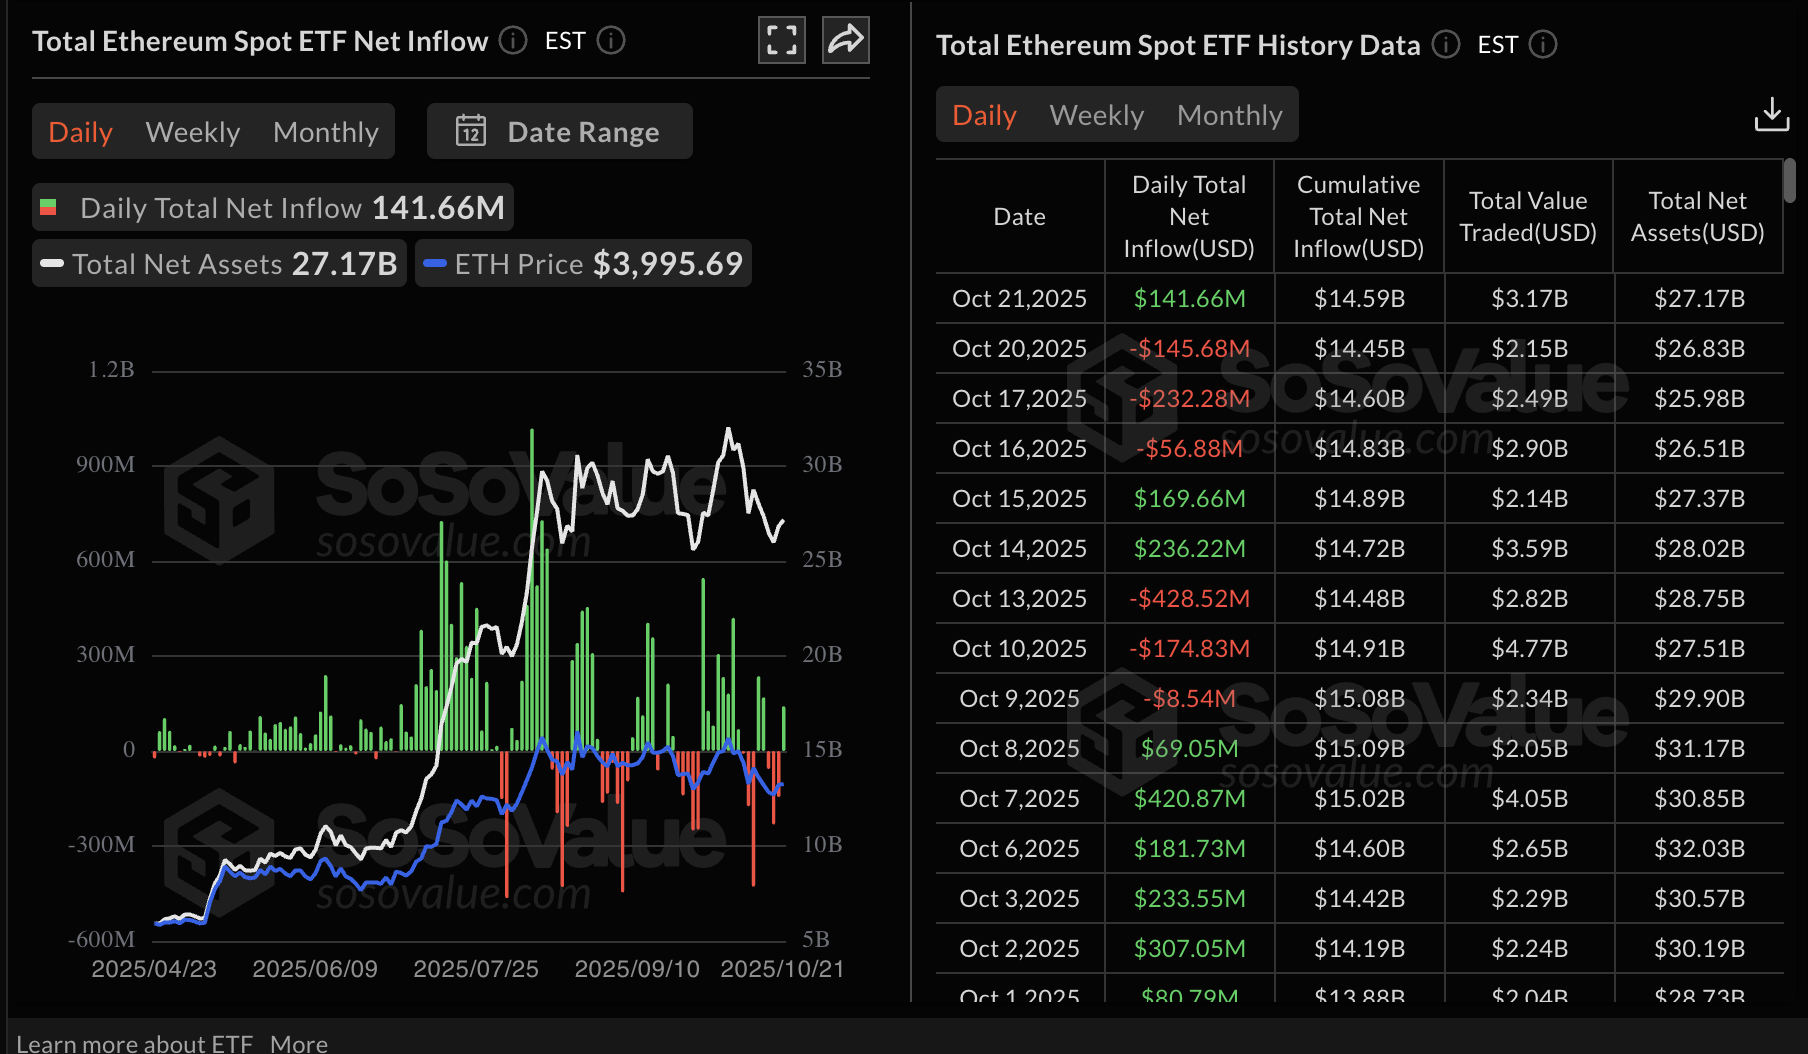
Ethereum ETF stats | Source: SoSoValue
Chart of the day: Bitcoin fluctuates as bulls lose grip
Bitcoin trades above the 200-day Exponential Moving Average (EMA) at $108,070, while bulls struggle to stabilize the price following rejection at the $114,000 resistance level.
The Moving Average Convergence Divergence (MACD) and the SuperTrend indicators highlight a bearish technical structure, increasing the odds of extending the decline toward BTC’s October lows of $102,000.
A sell signal maintained by the MACD since October 10 amid the largest deleveraging event that saw $19 billion in total crypto liquidations, encourages investors to reduce risk exposure.
The SuperTrend indicator also flipped bearish on the same day, flashing a sell signal on the daily chart. If sentiment remains dull in the coming days, price fluctuations between $102,000 and $114,000 could continue.
A daily close above the 200-day EMA at $108,070 would confirm to traders that sentiment is stable, likely ushering in a sustained recovery.
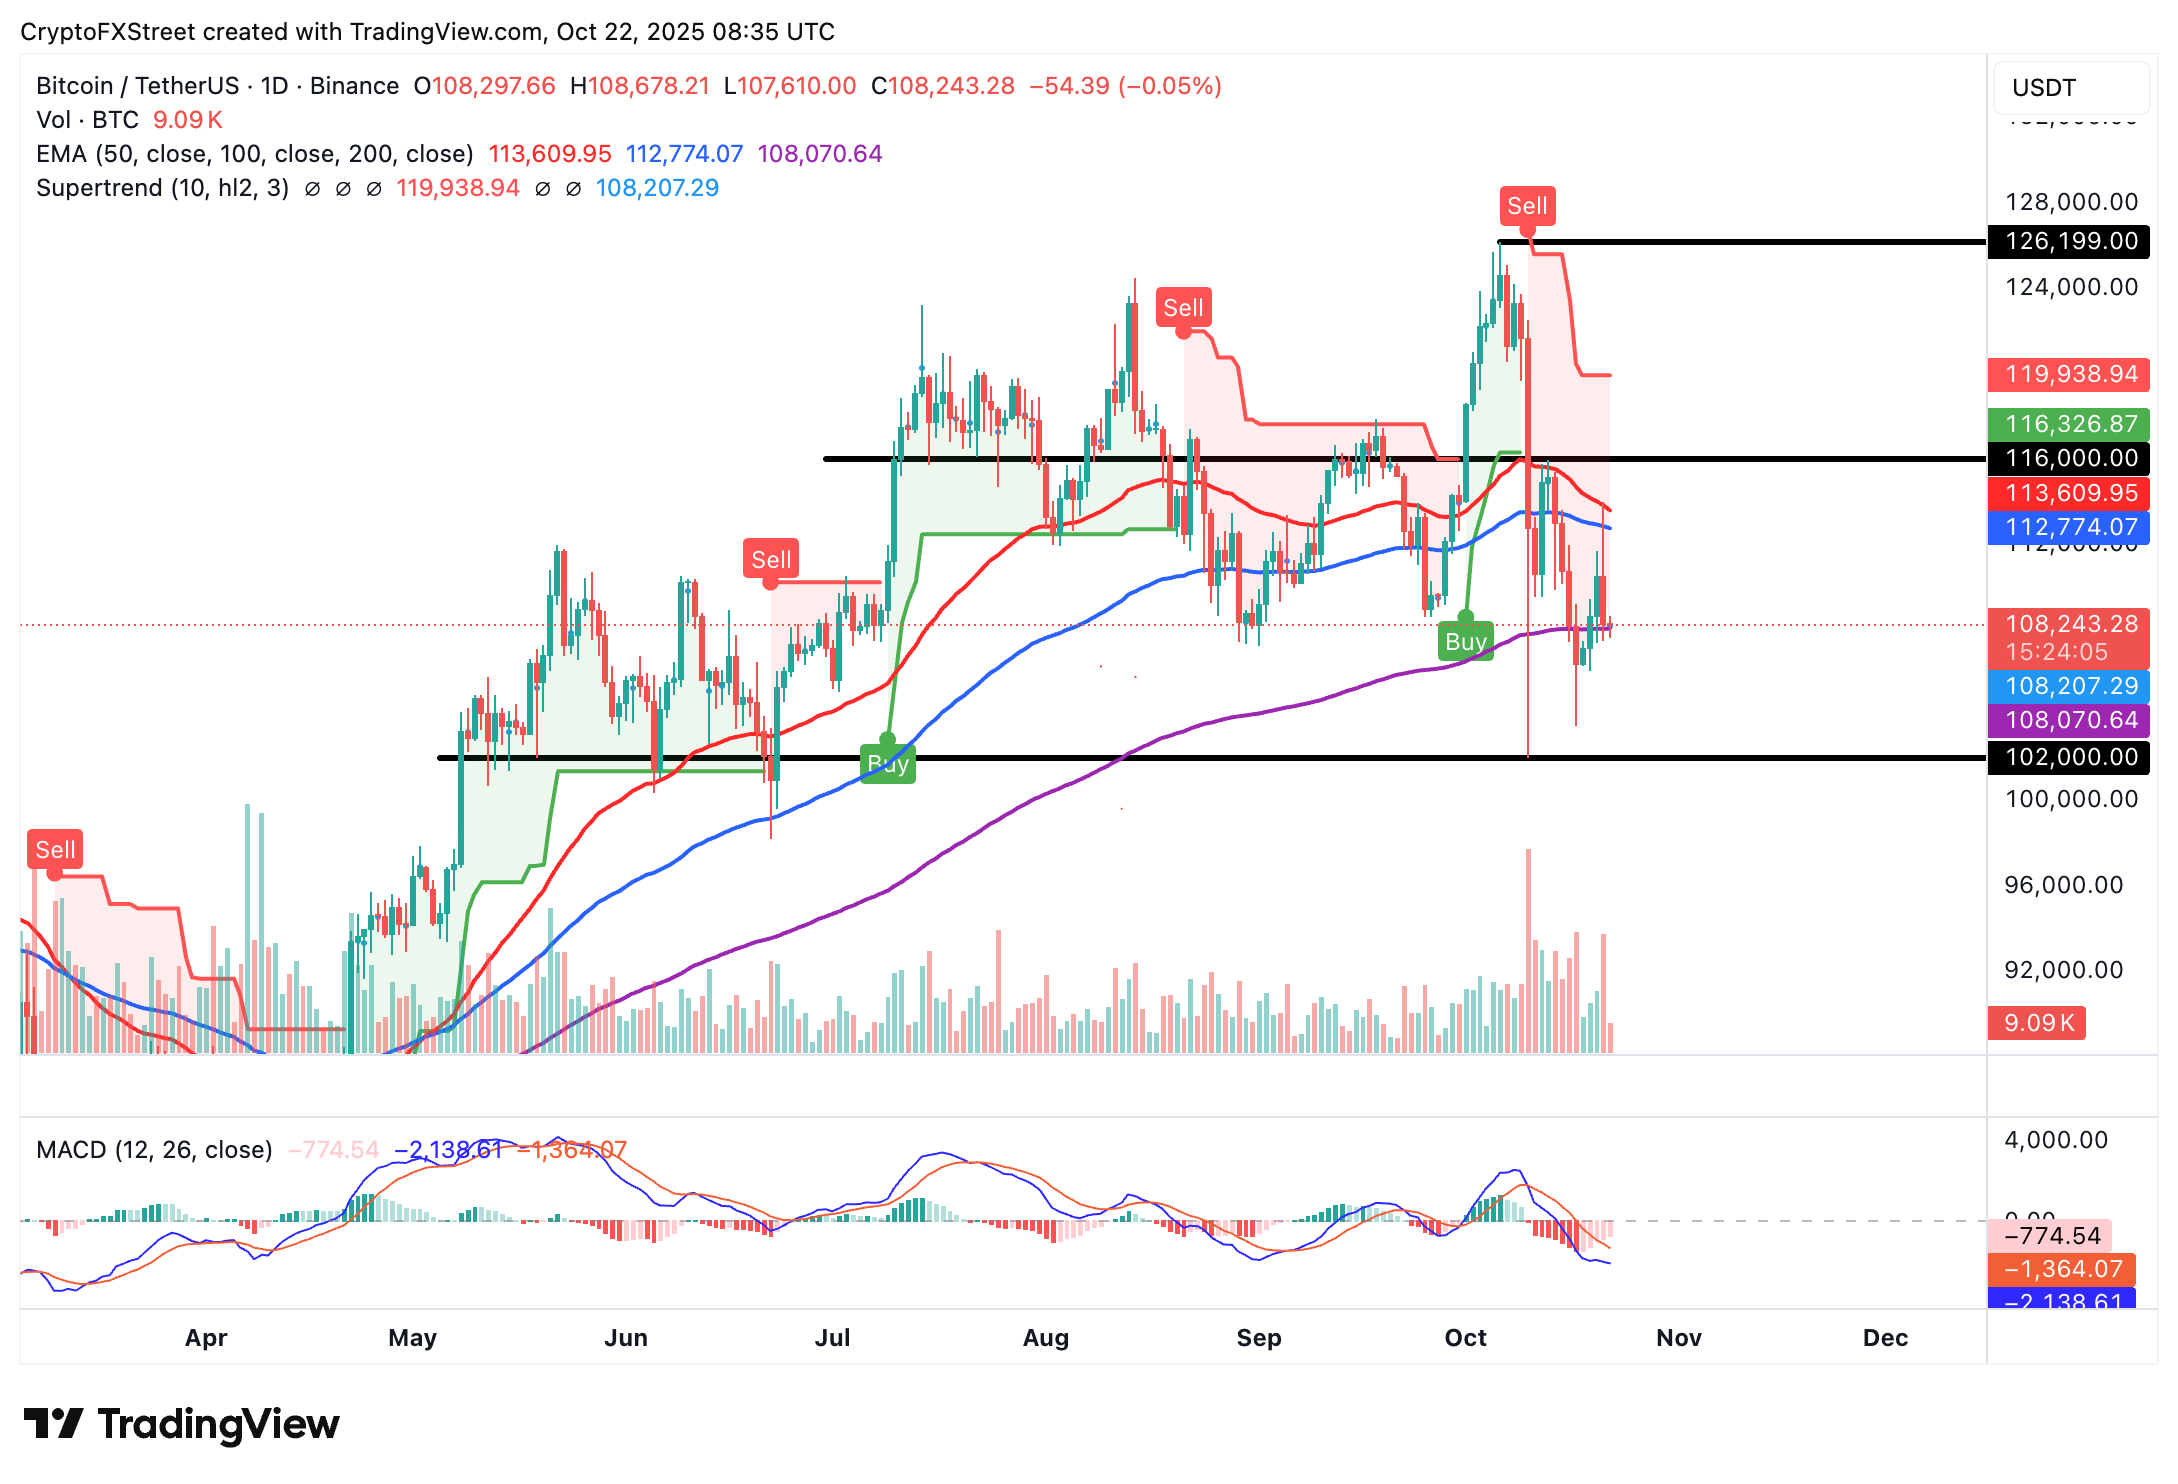
BTC/USDT daily chart
Altcoins update: Ethereum, XRP prolong decline
Ethereum has fallen below the 100-day EMA, currently at $3,967, and is seeking support above $3,800 at the time of writing. The smart contracts token’s technical picture reflects risk-off sentiment, clinging to the cryptocurrency market since the trade stand-off between the US and China reignited earlier this month.
Sellers appear to be having the upper hand, citing a MACD sell signal triggered on October 10 and a downward-trending Relative Strength Index (RSI) below the neutral level of 50, indicating that bearish momentum is increasing.
Key areas of interest for traders are the immediate round-number support at $3,800, the demand area of $3,680, tested on Friday, and the 200-day EMA at $3,569. Still, an immediate rebound above the $4,000 level cannot be ruled out, especially with institutions seeking exposure through ETFs.
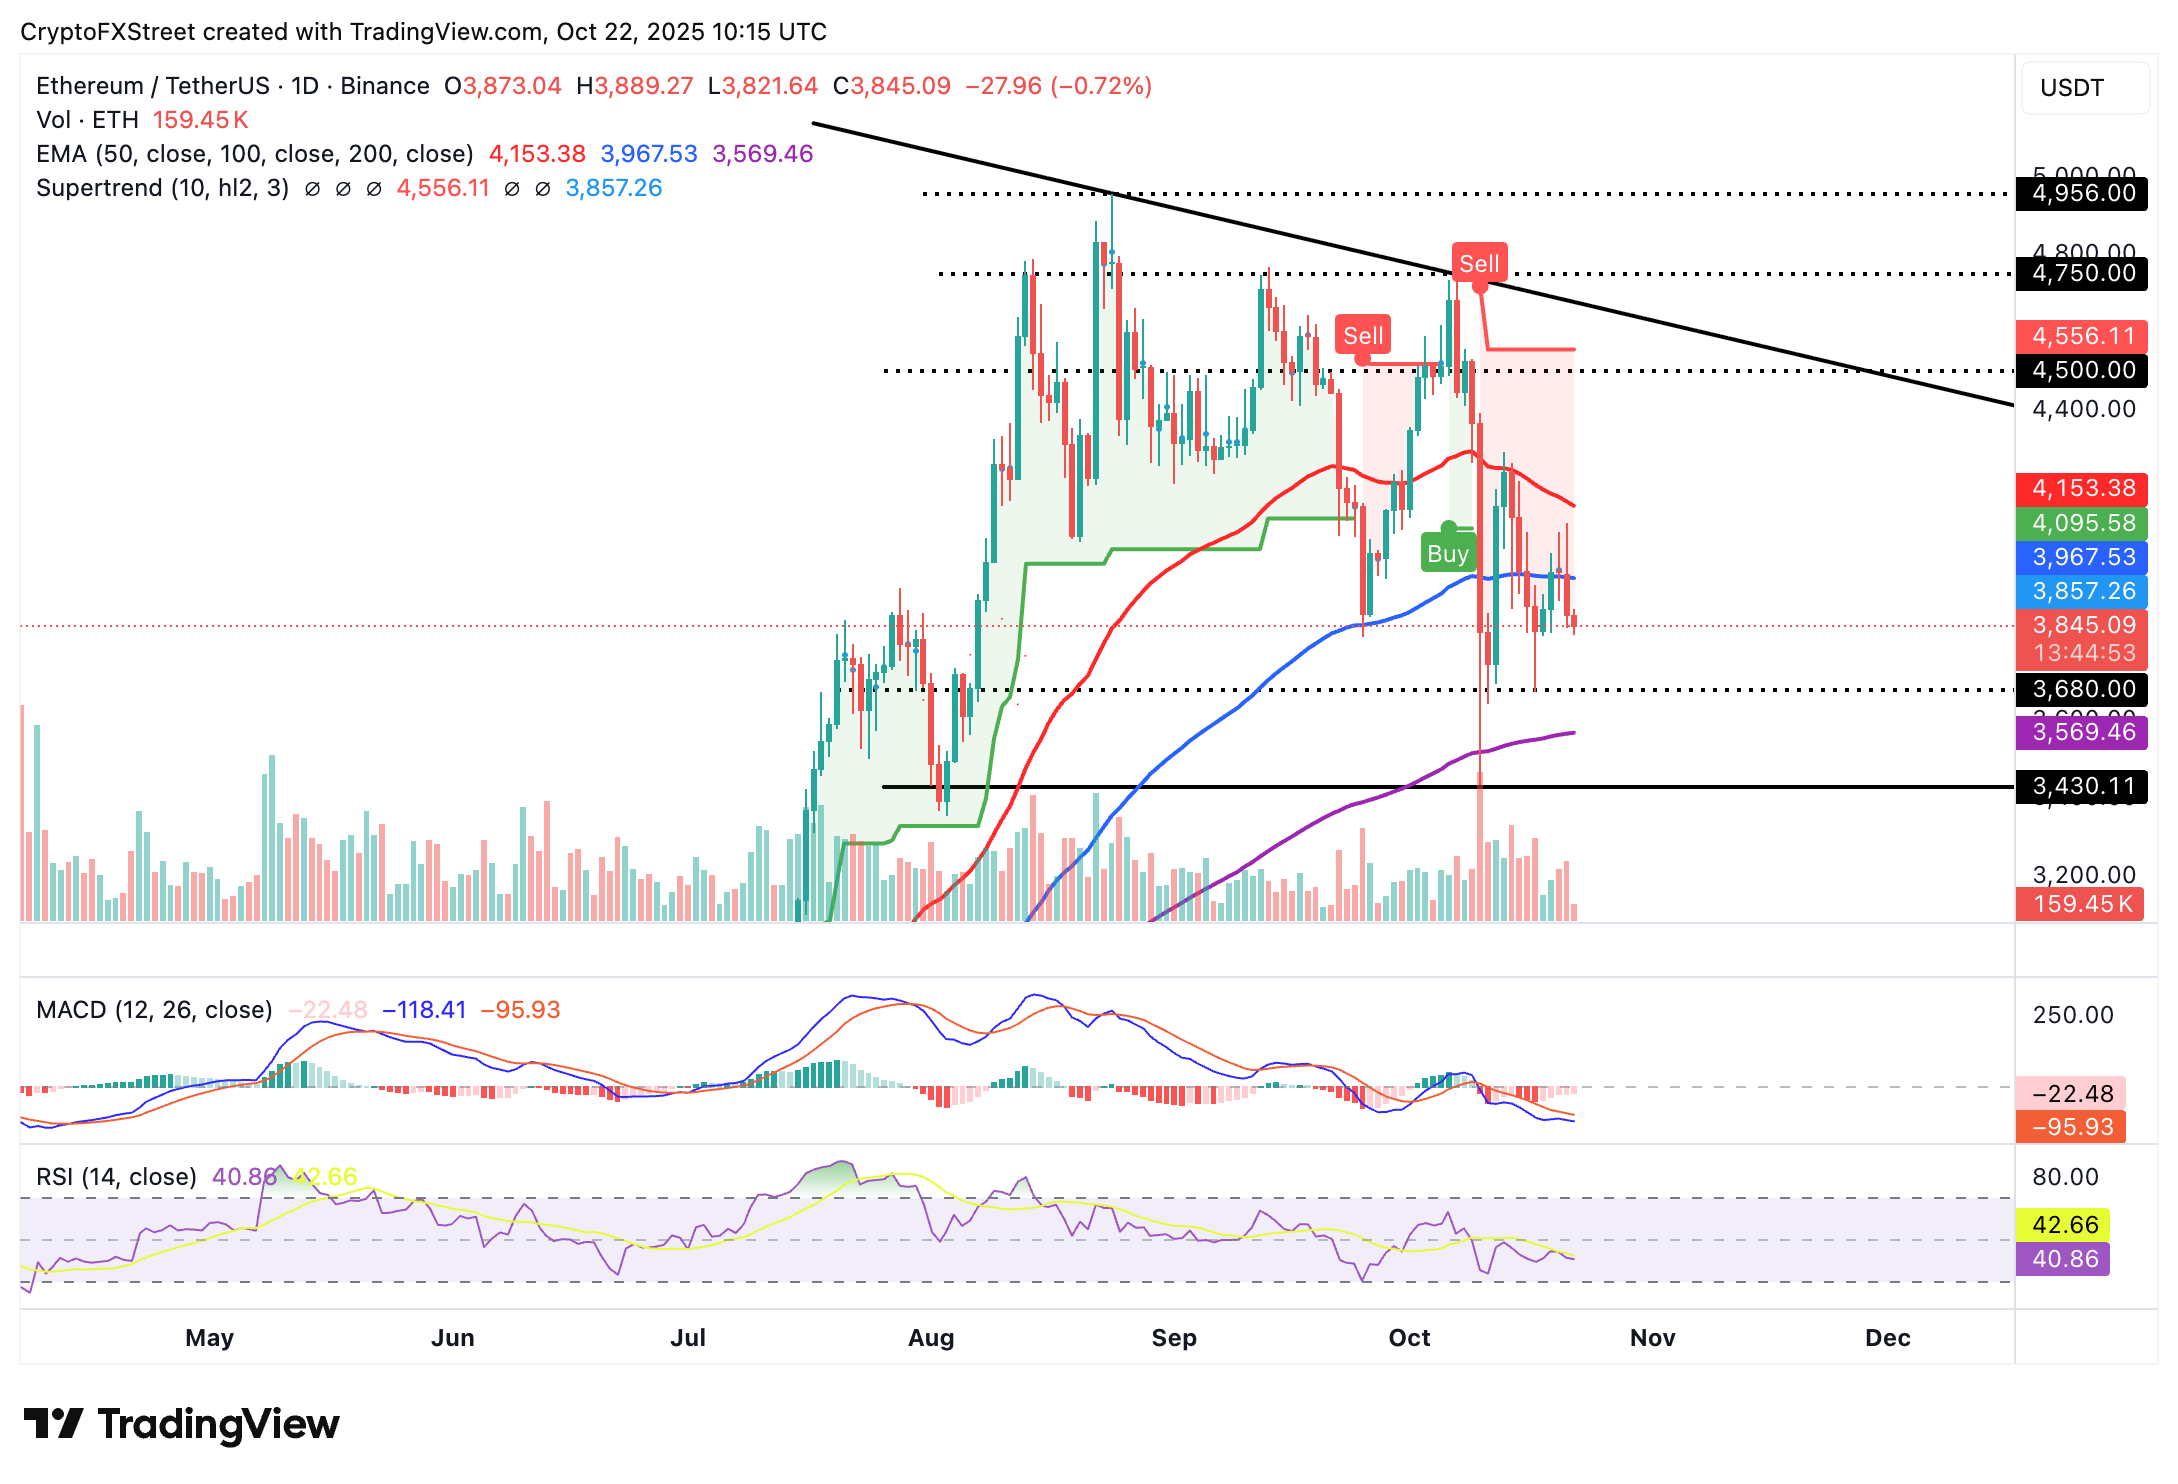
ETH/USD daily chart
As for XRP, bulls are battling to reclaim the $2.40 level at the time of writing on Wednesday. A Death Cross pattern on the daily chart, formed when the 50-day EMA crossed below the 100-day EMA, points to persistent negative sentiment in the broader crypto market.
Traders should be watchful for price action toward the next support at $2.18, which may keep bears determined to push XRP to the next level at $1.90, as tested in June. The MACD indicator remains bearish as shown on the daily chart, with investors likely to continue reducing their exposure as selling pressure intensifies.
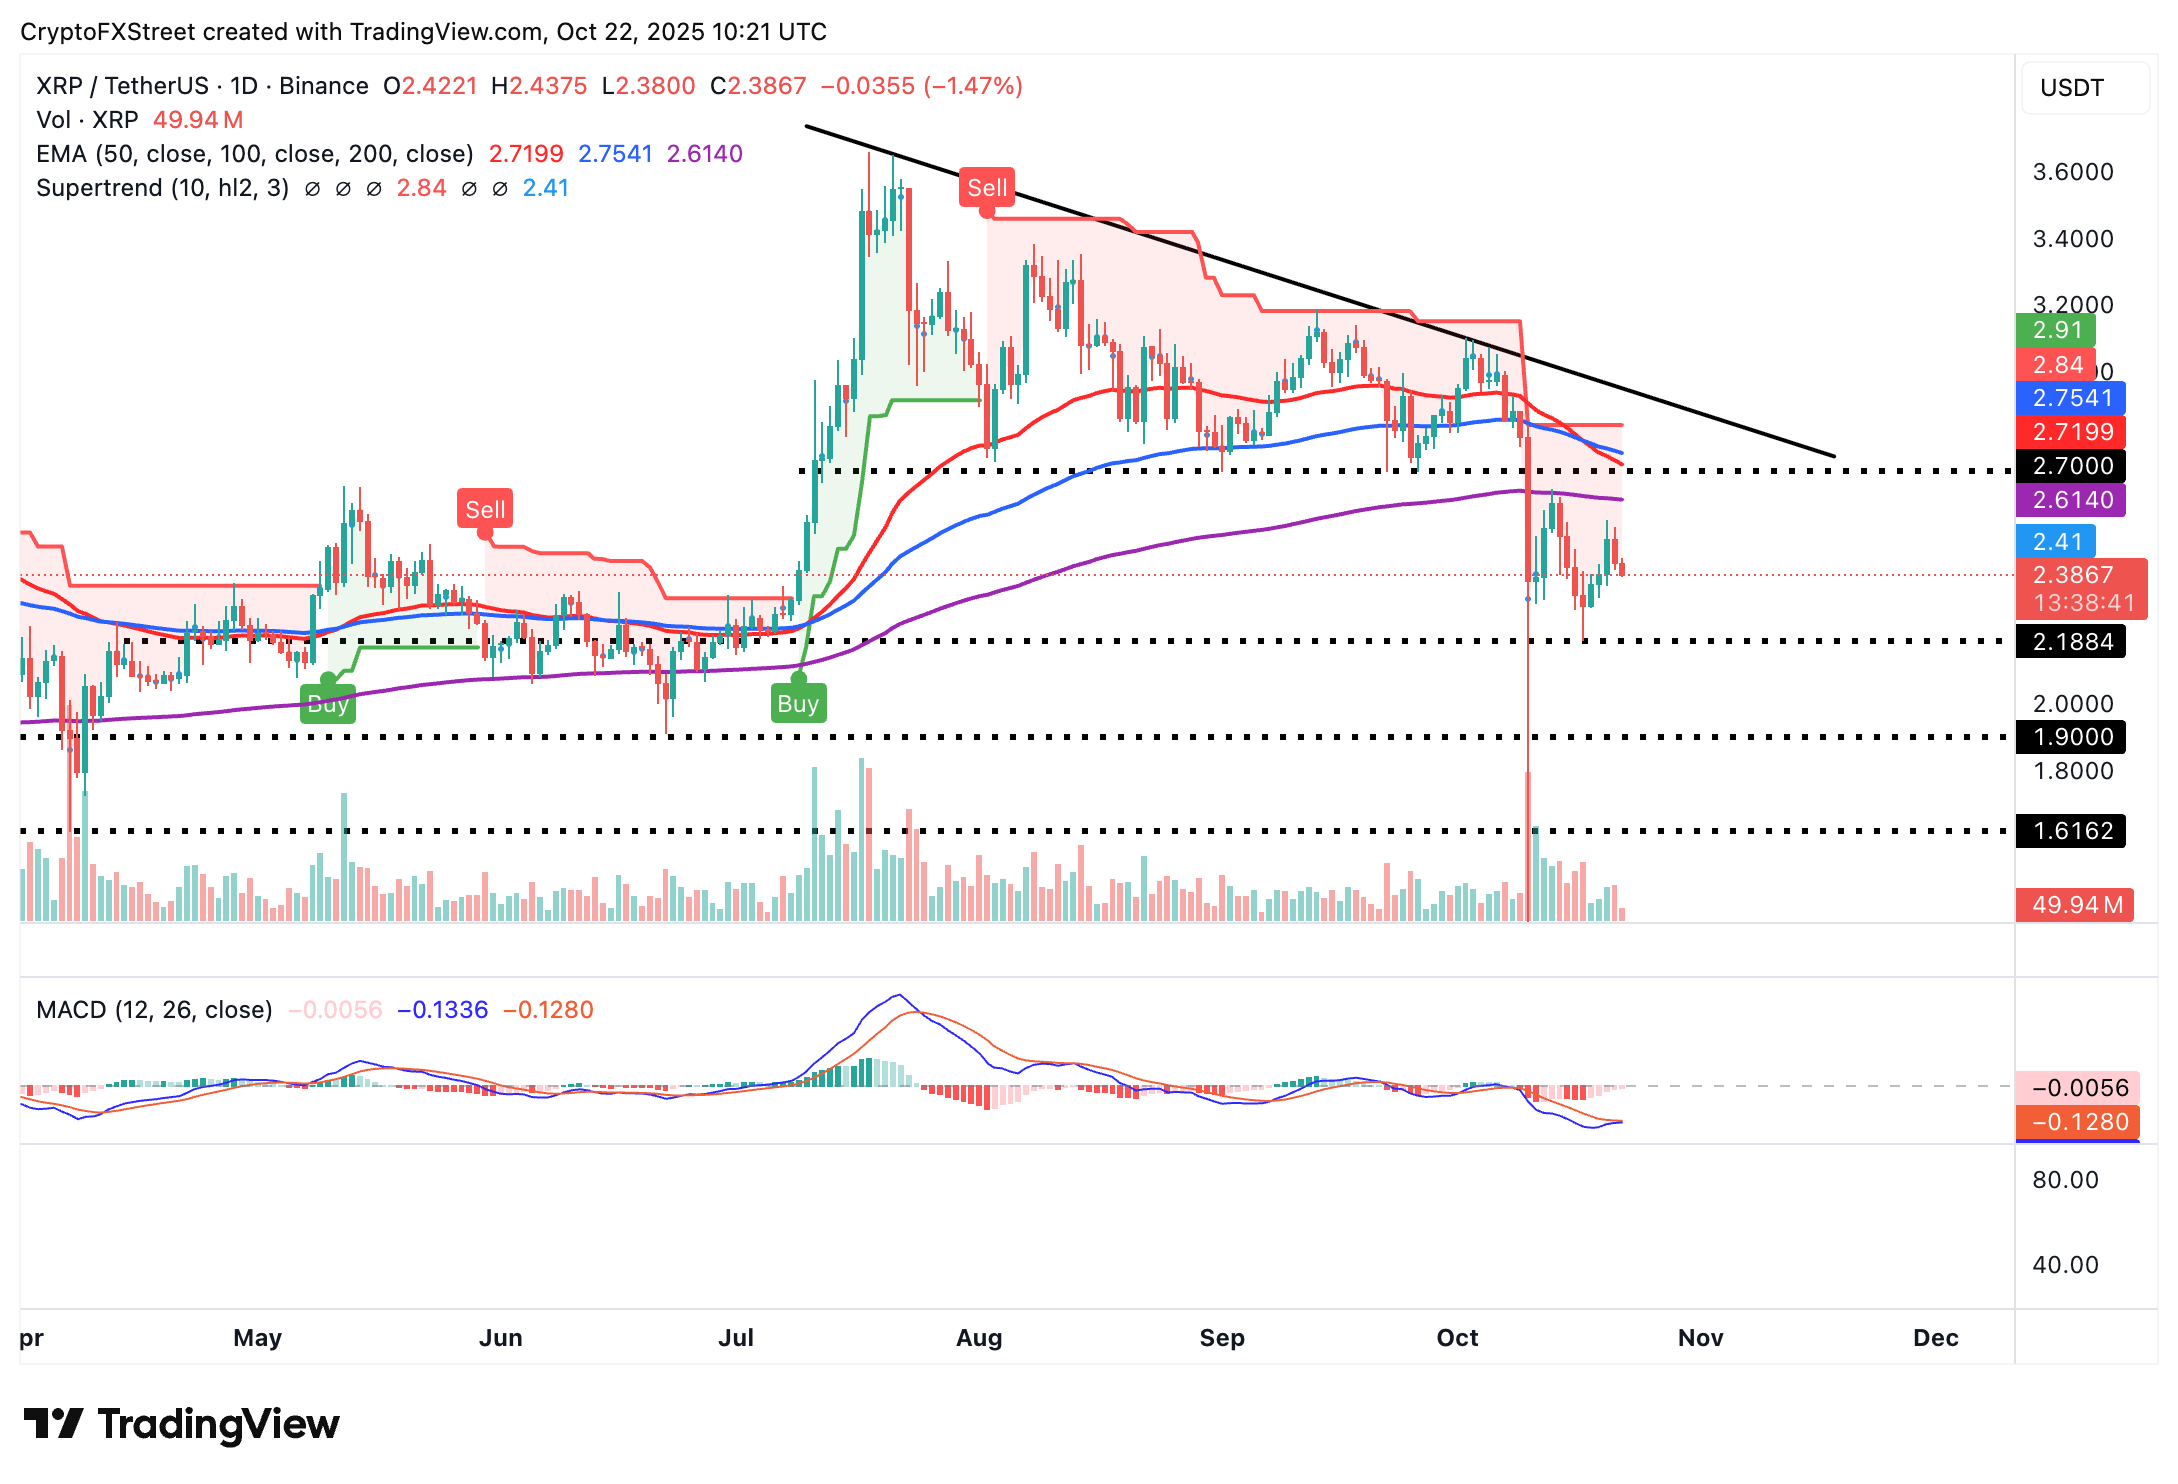
XRP/USDT daily chart
If retail investors buy the dip and increase exposure, an immediate recovery toward the 200-day EMA at $2.61 would occur. Other key levels worth monitoring for a medium-term outlook include the 50-day EMA at $2.71 and the 100-day EMA at $2.75.
Crypto ETF FAQs
An Exchange-Traded Fund (ETF) is an investment vehicle or an index that tracks the price of an underlying asset. ETFs can not only track a single asset, but a group of assets and sectors. For example, a Bitcoin ETF tracks Bitcoin’s price. ETF is a tool used by investors to gain exposure to a certain asset.
Yes. The first Bitcoin futures ETF in the US was approved by the US Securities & Exchange Commission in October 2021. A total of seven Bitcoin futures ETFs have been approved, with more than 20 still waiting for the regulator’s permission. The SEC says that the cryptocurrency industry is new and subject to manipulation, which is why it has been delaying crypto-related futures ETFs for the last few years.
Yes. The SEC approved in January 2024 the listing and trading of several Bitcoin spot Exchange-Traded Funds, opening the door to institutional capital and mainstream investors to trade the main crypto currency. The decision was hailed by the industry as a game changer.
The main advantage of crypto ETFs is the possibility of gaining exposure to a cryptocurrency without ownership, reducing the risk and cost of holding the asset. Other pros are a lower learning curve and higher security for investors since ETFs take charge of securing the underlying asset holdings. As for the main drawbacks, the main one is that as an investor you can’t have direct ownership of the asset, or, as they say in crypto, “not your keys, not your coins.” Other disadvantages are higher costs associated with holding crypto since ETFs charge fees for active management. Finally, even though investing in ETFs reduces the risk of holding an asset, price swings in the underlying cryptocurrency are likely to be reflected in the investment vehicle too.
Recommended Articles


