Chainlink To $100? Analyst Says This Breakout Could Be The Trigger

Source Newsbtc

An analyst has pointed out how Chainlink could see a major bullish breakout if its price can break past the resistance barrier of this technical analysis (TA) channel.

Chainlink Is Currently Trading Inside A Triangle

In a new post on X, analyst Ali Martinez has talked about a level that could trigger a major bull rally for Chainlink. The level in question is the upper line of a Triangle from TA. This pattern appears whenever an asset’s price trades between two converging trendlines. Like any other consolidation channel in TA, the upper line of a Triangle is a source of resistance and lower one that of support.

Triangles can be classified into different types depending on how the trendlines are oriented. The upper line being parallel to the time-axis results in what’s known as an “Ascending Triangle.” Similarly, the lower level being parallel forms a “Descending Triangle.”

These two types correspond to consolidation periods in the asset where its range narrows to an upside and downside, respectively. When the range shrinks down with no bias, the resulting channel is called a “Symmetrical Triangle.” In this Triangle, the trendlines approach each other at a roughly equal and opposite slope.

The Triangle that Chainlink has been following for the last few years doesn’t cleanly fit into any of these classes. Instead, its channel lies somewhere between an Ascending Triangle and a Symmetrical Triangle, as the chart shared by Martinez shows.

Chainlink Triangle

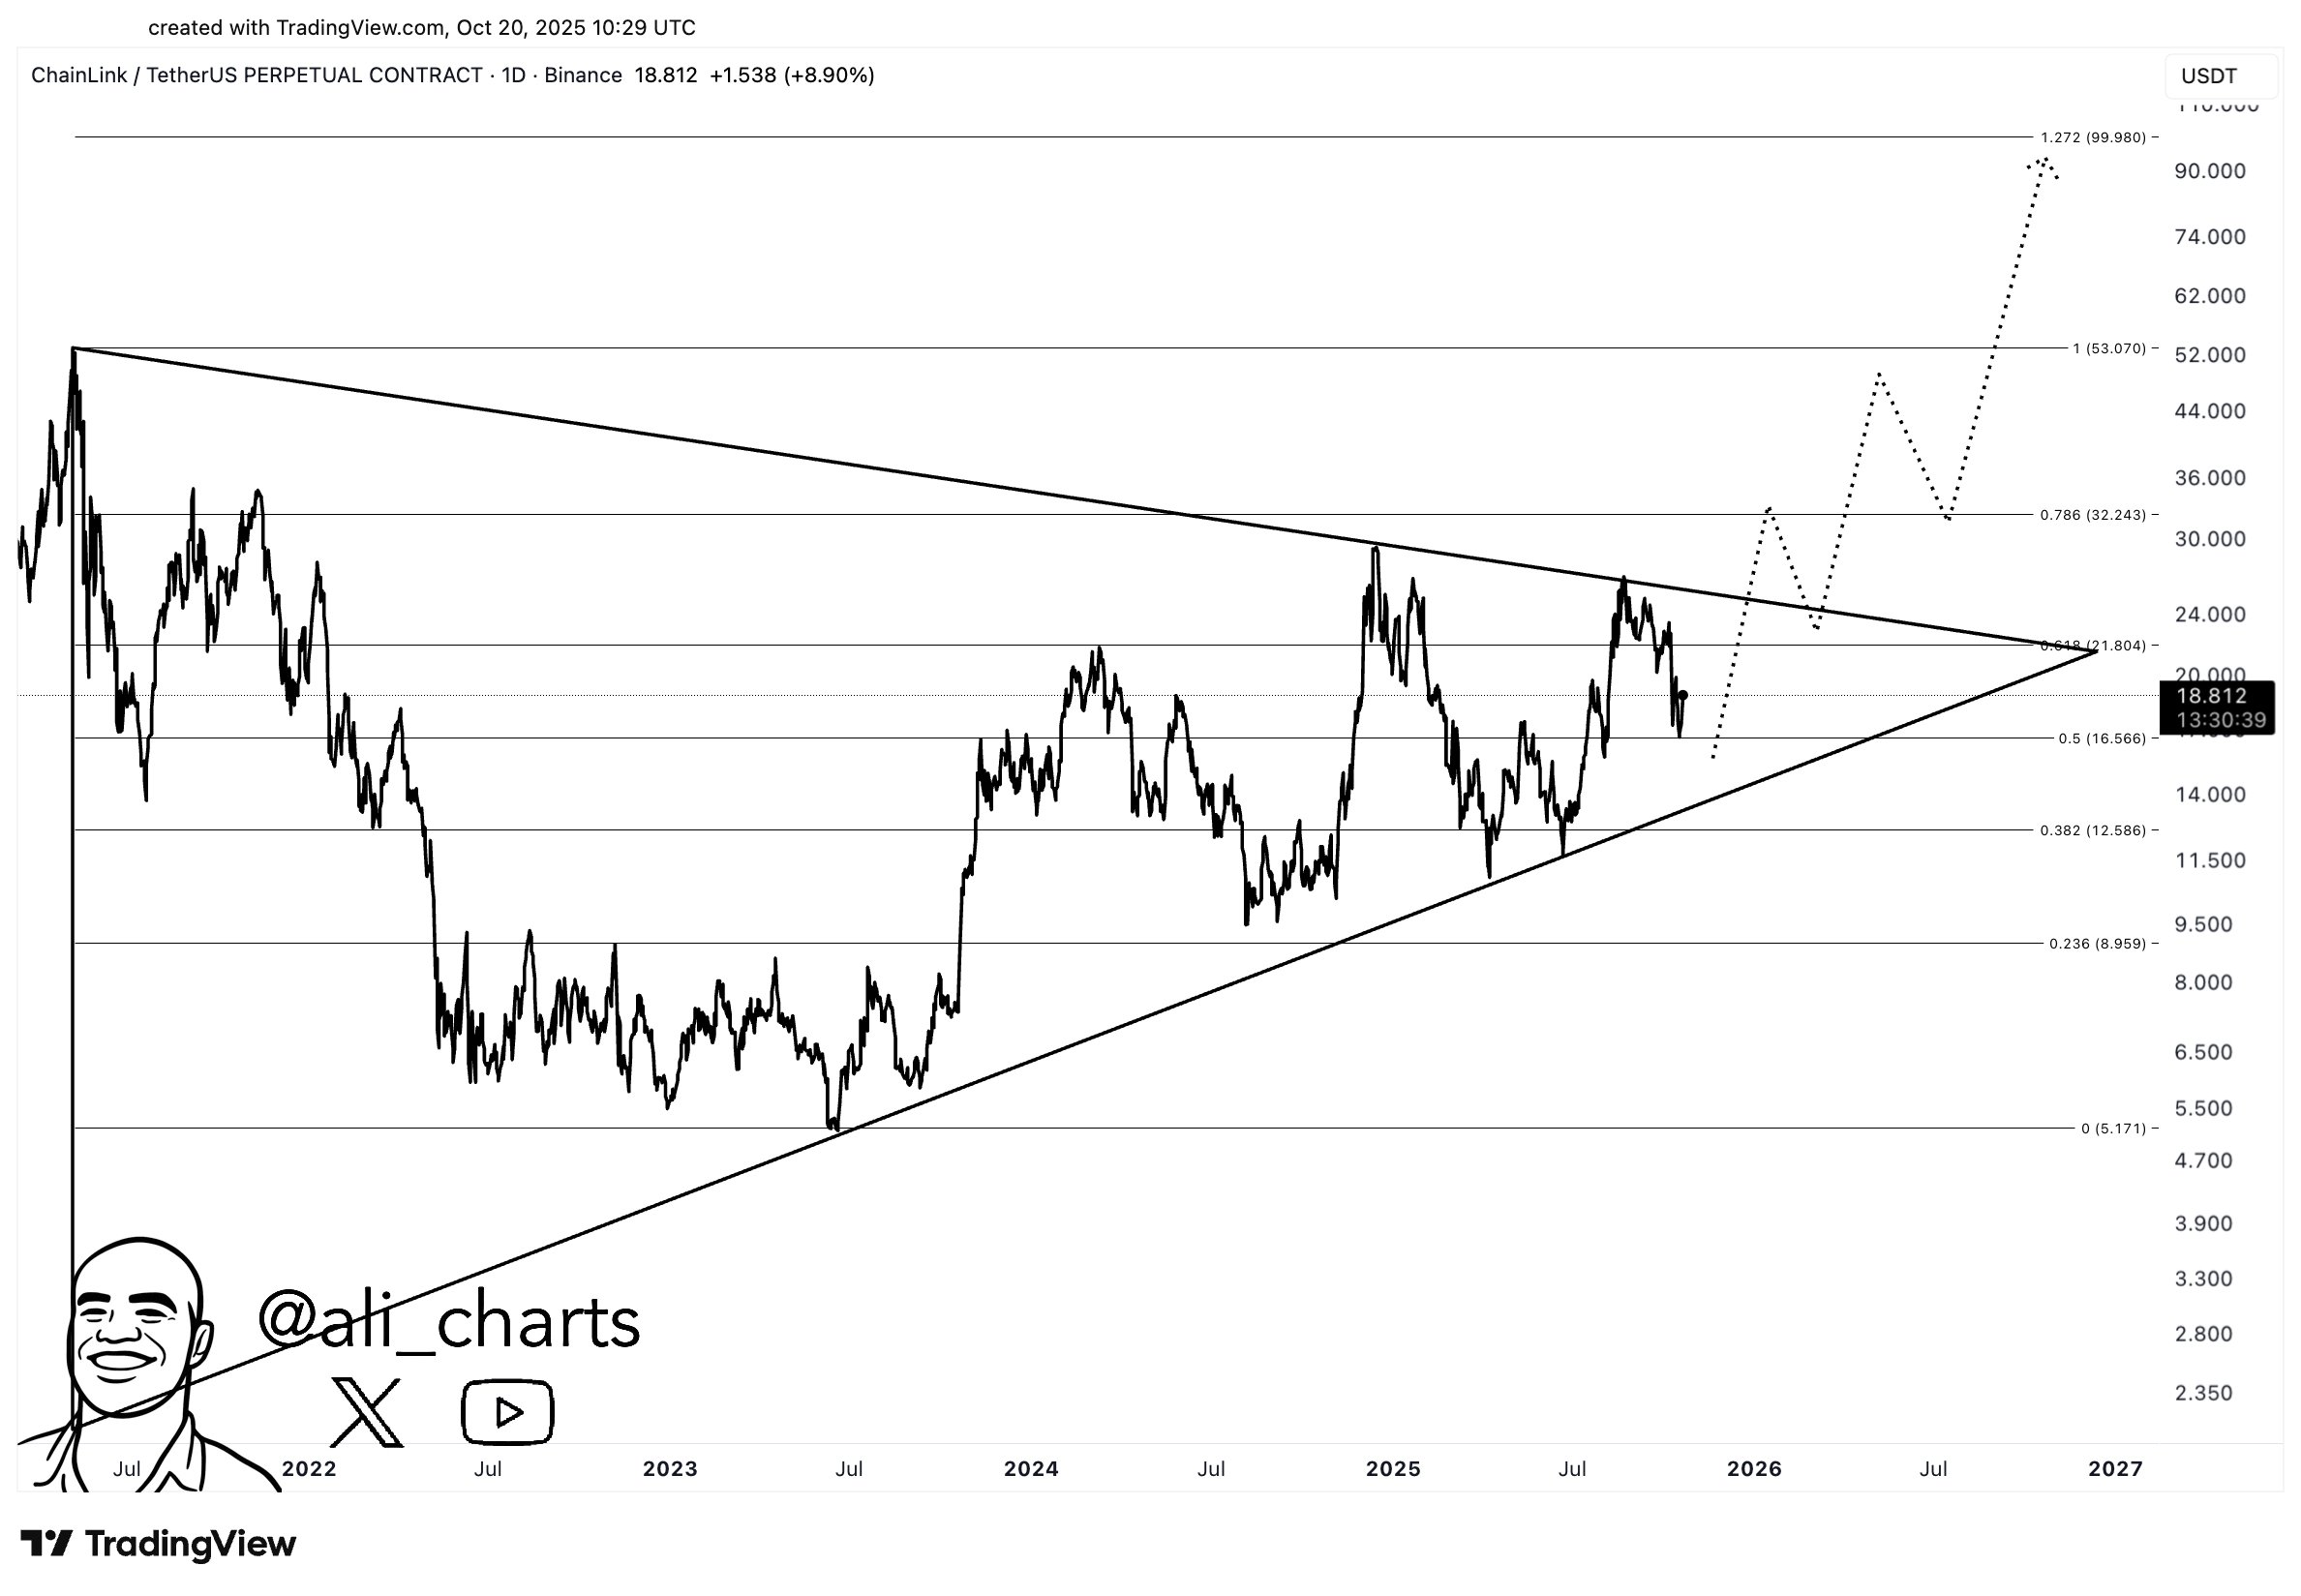
As is visible in the above graph, the 1-day price of Chainlink retested the upper level of the Triangle earlier in the year and found rejection. The coin has since been on the way down.

The chart also shows that LINK is slowly approaching the end of this multi-year channel. Generally, breakouts become more likely the smaller an asset’s range gets. As the coin is clearly trading inside a narrow region now, a breakout could be coming closer.

A surge above a Triangle is usually a bullish sign, while a decline under the channel can lead to bearish action. As such, the next retest from Chainlink could be worth keeping an eye on, as a breakout could set the tone for the coin’s upcoming price action.

It only remains to be seen, however, whether LINK would next retest the upper level or the lower one. In the scenario that the coin can break past the resistance line situated around $25, the analyst thinks its price could see a bull rally.

For the target, Martinez has referred to the 1.272 Fibonacci Extension level. Fibonacci Extension levels drawn up from the top (considered as the 1 level), based on ratios from the famous Fibonacci series. The 1.272 level indicated by the analyst lies around $100.

LINK Price

At the time of writing, Chainlink is floating around $18, down over 2% in the last seven days.

Chainlink Price Chart
Disclaimer: For information purposes only. Past performance is not indicative of future results.
placeholder
A Crash After a Surge: Why Silver Lost 40% in a Week?TradingKey - Spot Silver ( XAGUSD) prices have continued to decline; on Thursday, silver plummeted as much as 20% to break below $71 per ounce, and on Friday the sell-off intensified as prices fell fu
Author  TradingKey
Feb 06, Fri
TradingKey - Spot Silver ( XAGUSD) prices have continued to decline; on Thursday, silver plummeted as much as 20% to break below $71 per ounce, and on Friday the sell-off intensified as prices fell fu
placeholder
Bitcoin is trading around $63,000, down nearly 40% from its peak near $126,000Wall Street desks are no longer talking about upside dreams. The talk right now is how far Bitcoin charts could fall if selling keeps piling up. According to data from TradingView, Bitcoin’s price now sits at a shocking $63,500, after falling from $70,000 just this morning, losing $13,000 in 6 days, and staying far below […]
Author  Cryptopolitan
Feb 06, Fri
Wall Street desks are no longer talking about upside dreams. The talk right now is how far Bitcoin charts could fall if selling keeps piling up. According to data from TradingView, Bitcoin’s price now sits at a shocking $63,500, after falling from $70,000 just this morning, losing $13,000 in 6 days, and staying far below […]
placeholder
WTI declines below $63.00 as US-Iran talks loom West Texas Intermediate (WTI), the US crude oil benchmark, is trading around $62.85 during the Asian trading hours on Friday. The WTI price declines after the United States (US) and Iran agreed to hold talks in Oman on Friday. 
Author  FXStreet
Feb 06, Fri
West Texas Intermediate (WTI), the US crude oil benchmark, is trading around $62.85 during the Asian trading hours on Friday. The WTI price declines after the United States (US) and Iran agreed to hold talks in Oman on Friday. 
placeholder
Bitcoin Surrenders $65,000 as Analysts Warn of ‘Structural’ Market BreakBitcoin plunges 11% to break $65k as analysts term the crash "structural," citing a $1 trillion market wipeout and $2.09 billion in daily liquidations.
Author  Mitrade
Feb 06, Fri
Bitcoin plunges 11% to break $65k as analysts term the crash "structural," citing a $1 trillion market wipeout and $2.09 billion in daily liquidations.
placeholder
Bitcoin Drops to $70,000. U.S. Government Refuses to Bail Out Market, End of Bull Market or Golden Pit? The U.S. government refuses to bail out Bitcoin, and with Fed rate cuts nowhere in sight, a continued downward trend to test for a bottom is likely after a brief rebound.During the mid-da
Author  TradingKey
Feb 05, Thu
The U.S. government refuses to bail out Bitcoin, and with Fed rate cuts nowhere in sight, a continued downward trend to test for a bottom is likely after a brief rebound.During the mid-da
goTop
quote