
Meme Coins Price Prediction: Dogecoin, Shiba Inu, Pepe stabilize as selling pressure wanes
- Dogecoin rebounds to $0.20 as on-chain data suggest a decline in supply pressure.
- Shiba Inu holds above a crucial psychological support amid a return in retail demand.
- Pepe stabilizes after Friday’s sell-off wave on steady demand from mid-size investors.
Meme coins such as Dogecoin (DOGE), Shiba Inu (SHIB), and Pepe (PEPE) mark a positive start to the week, following a rebound on Sunday. Recovering from Friday’s market crash, which saw liquidation of over $19 billion in a day, the retail demand is gradually resurfacing, per derivatives data.
At the same time, on-chain data indicates a decline in selling pressure alongside the demand surge among large and mid-size wallet investors, which could foster conditions for an extended recovery.
Retail demand heats up for meme coins
Meme coins are heating up after the Sunday recovery, which indicates that the investor sentiment is recovering from Friday’s crash. CoinGlass data shows that the futures Open Interest of Dogecoin, Shiba Inu, and Pepe has increased by 14%, 16%, and 22% respectively, in the last 24 hours. Typically, a double-digit rise in futures OI reflects a boost in traders holding long positions and, in this case, signals a revival in risk-on sentiment.
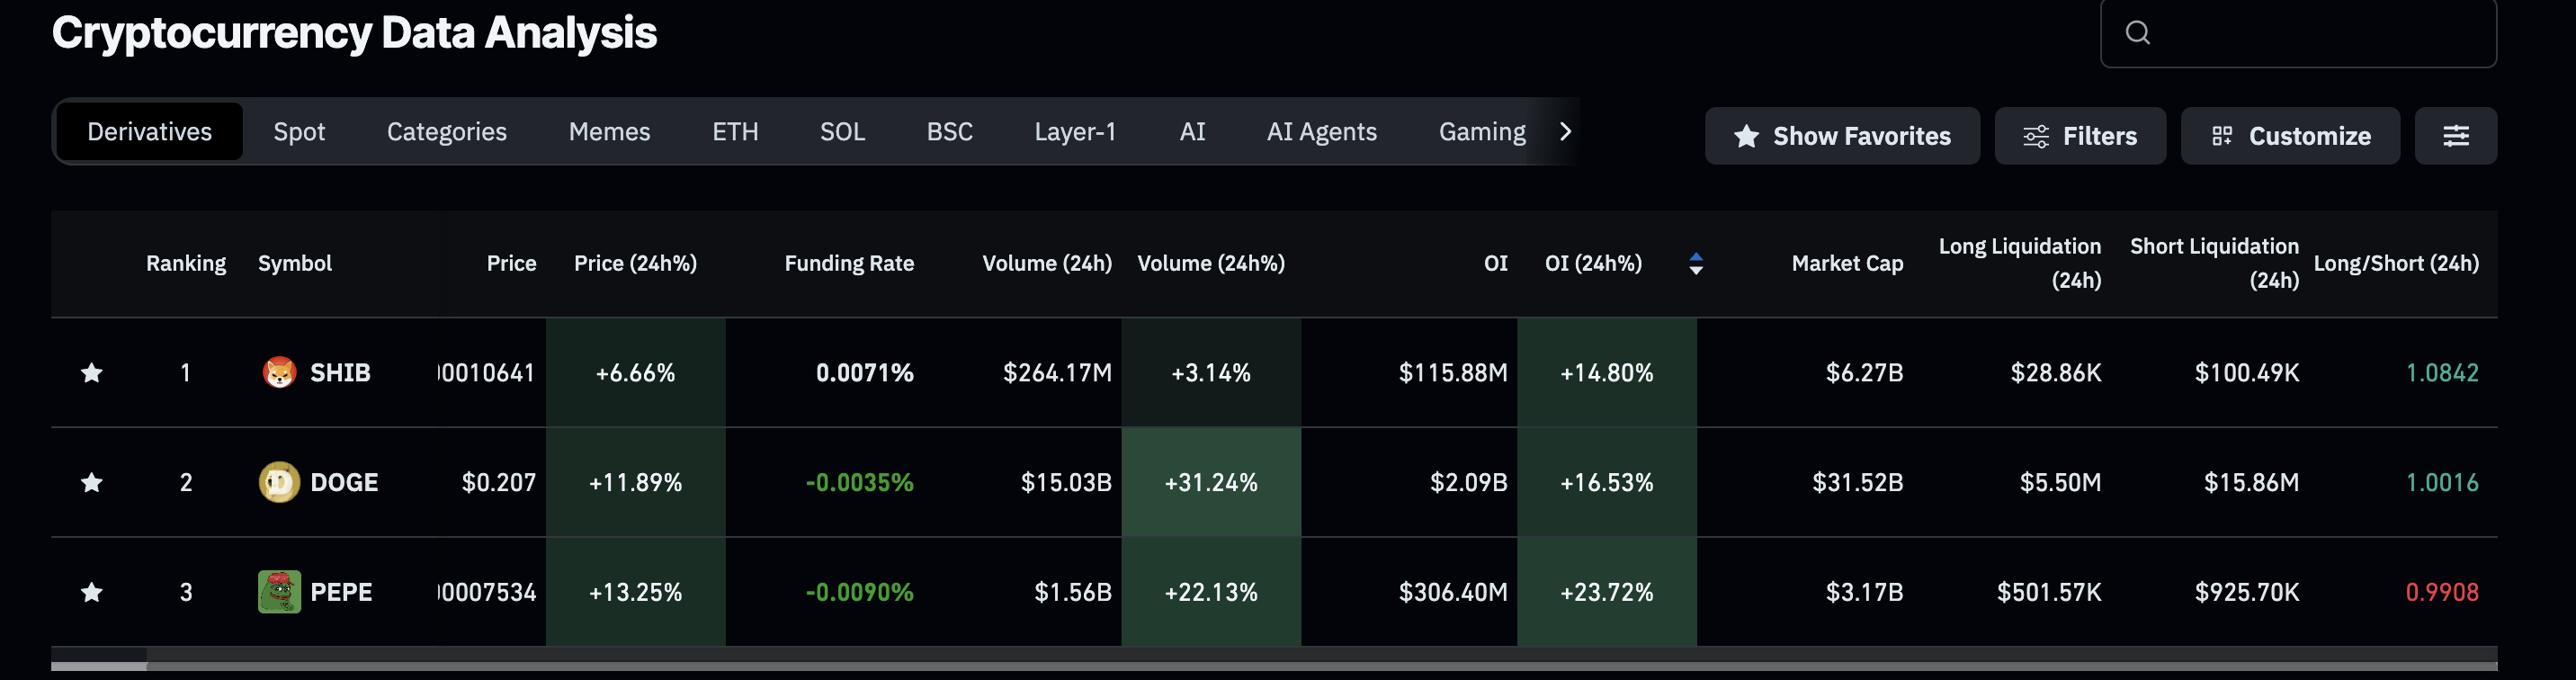
Meme Coins derivatives data. Source: CoinGlass
The sudden shift in investor sentiment also highlights the surge in volatility in the short term.
Dogecoin remains on the edge
Dogecoin trades above $0.20000 at press time on Monday, holding onto the 11% gains from Sunday. The reversal aligns with the steady demand among large-wallet investors, who hold more than 1 million DOGE and a total of 134.51 billion DOGE.
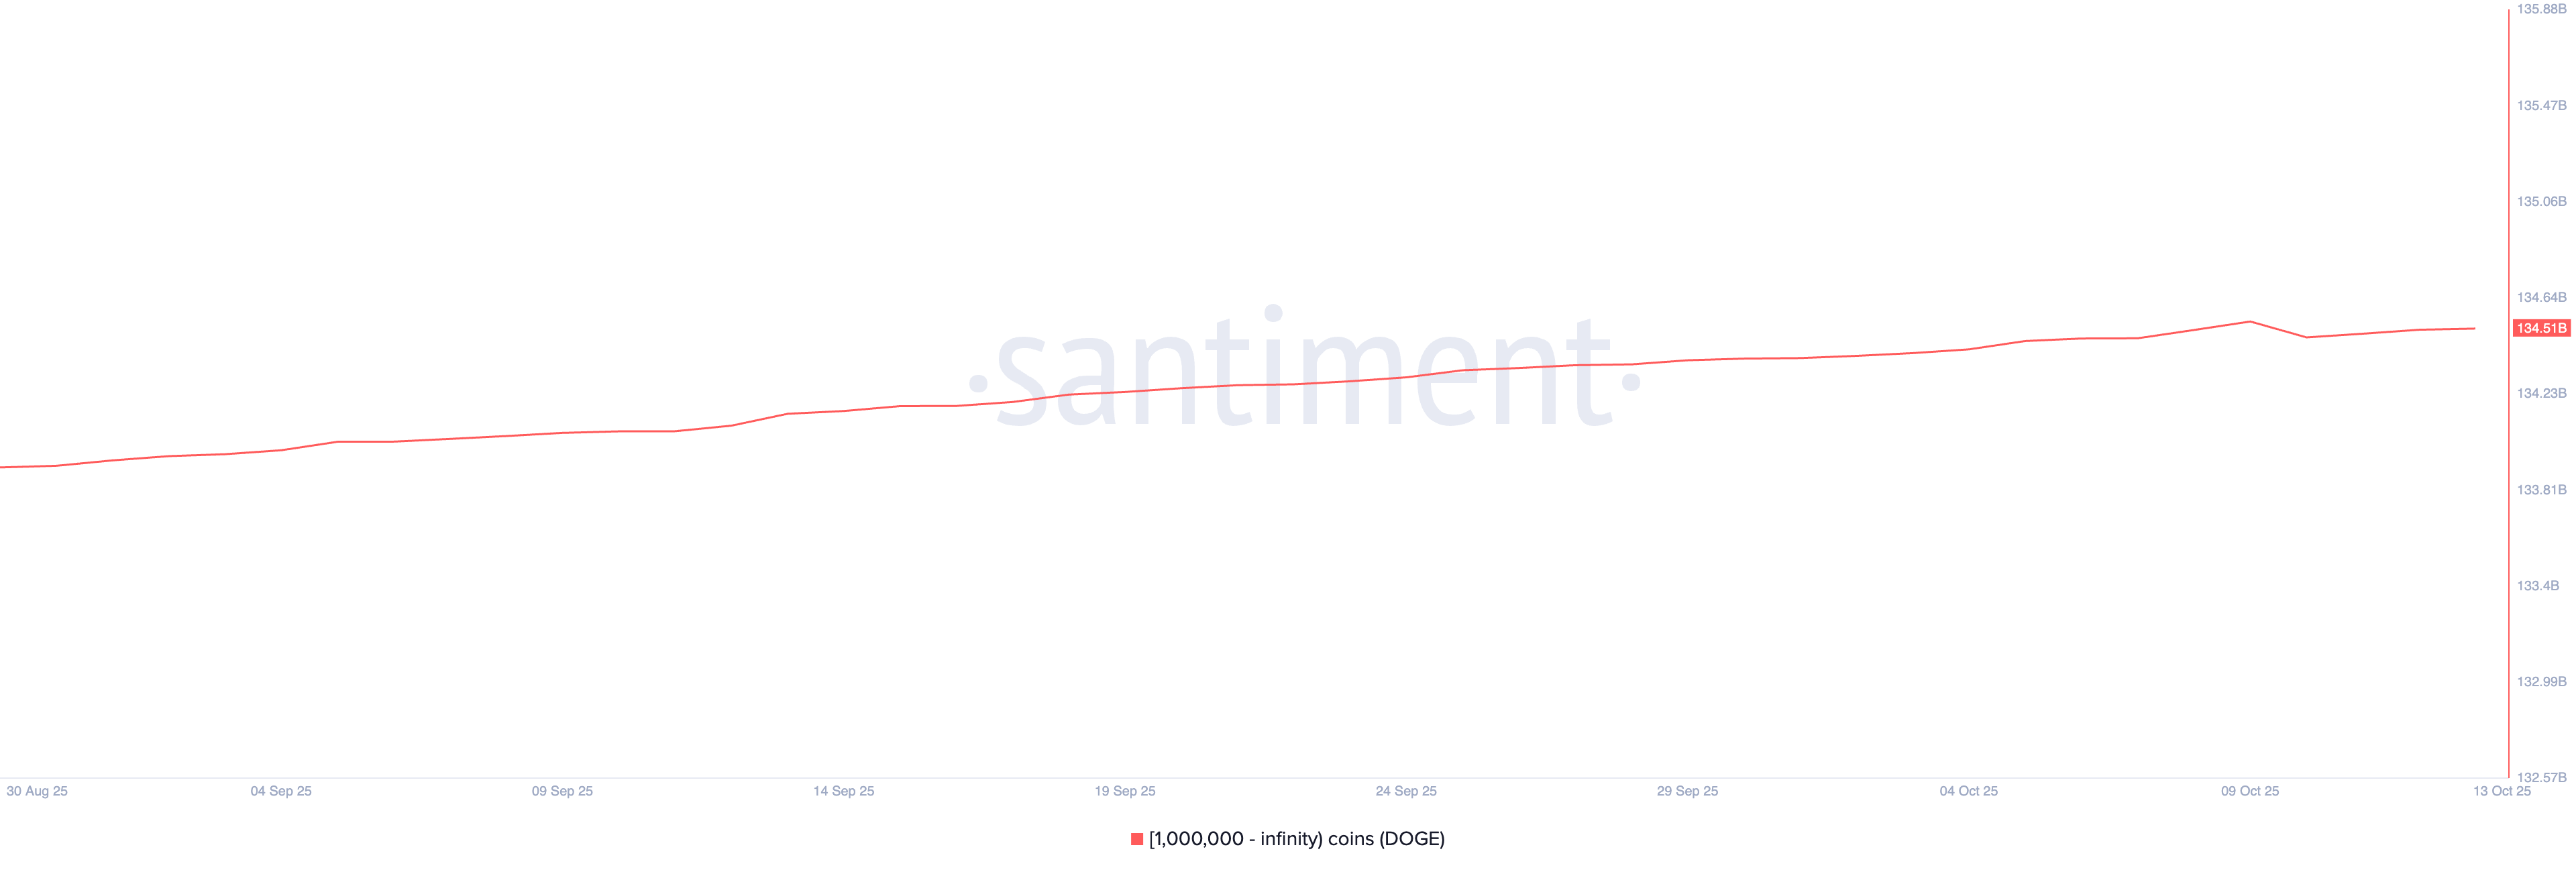
Dogecoin supply distribution. Source: Santiment.
Santiment’s data shows that the Network Realized Profit/Loss (NRPL) stands at 19.27 million DOGE booked at a profit on Monday, indicating a significant recovery from 150.51 million DOGE sold at a loss on Friday. This recovery suggests a decline in selling pressure induced by broader market panic, driving the percentage supply in profit to 71.68% from 66.40% on Saturday.
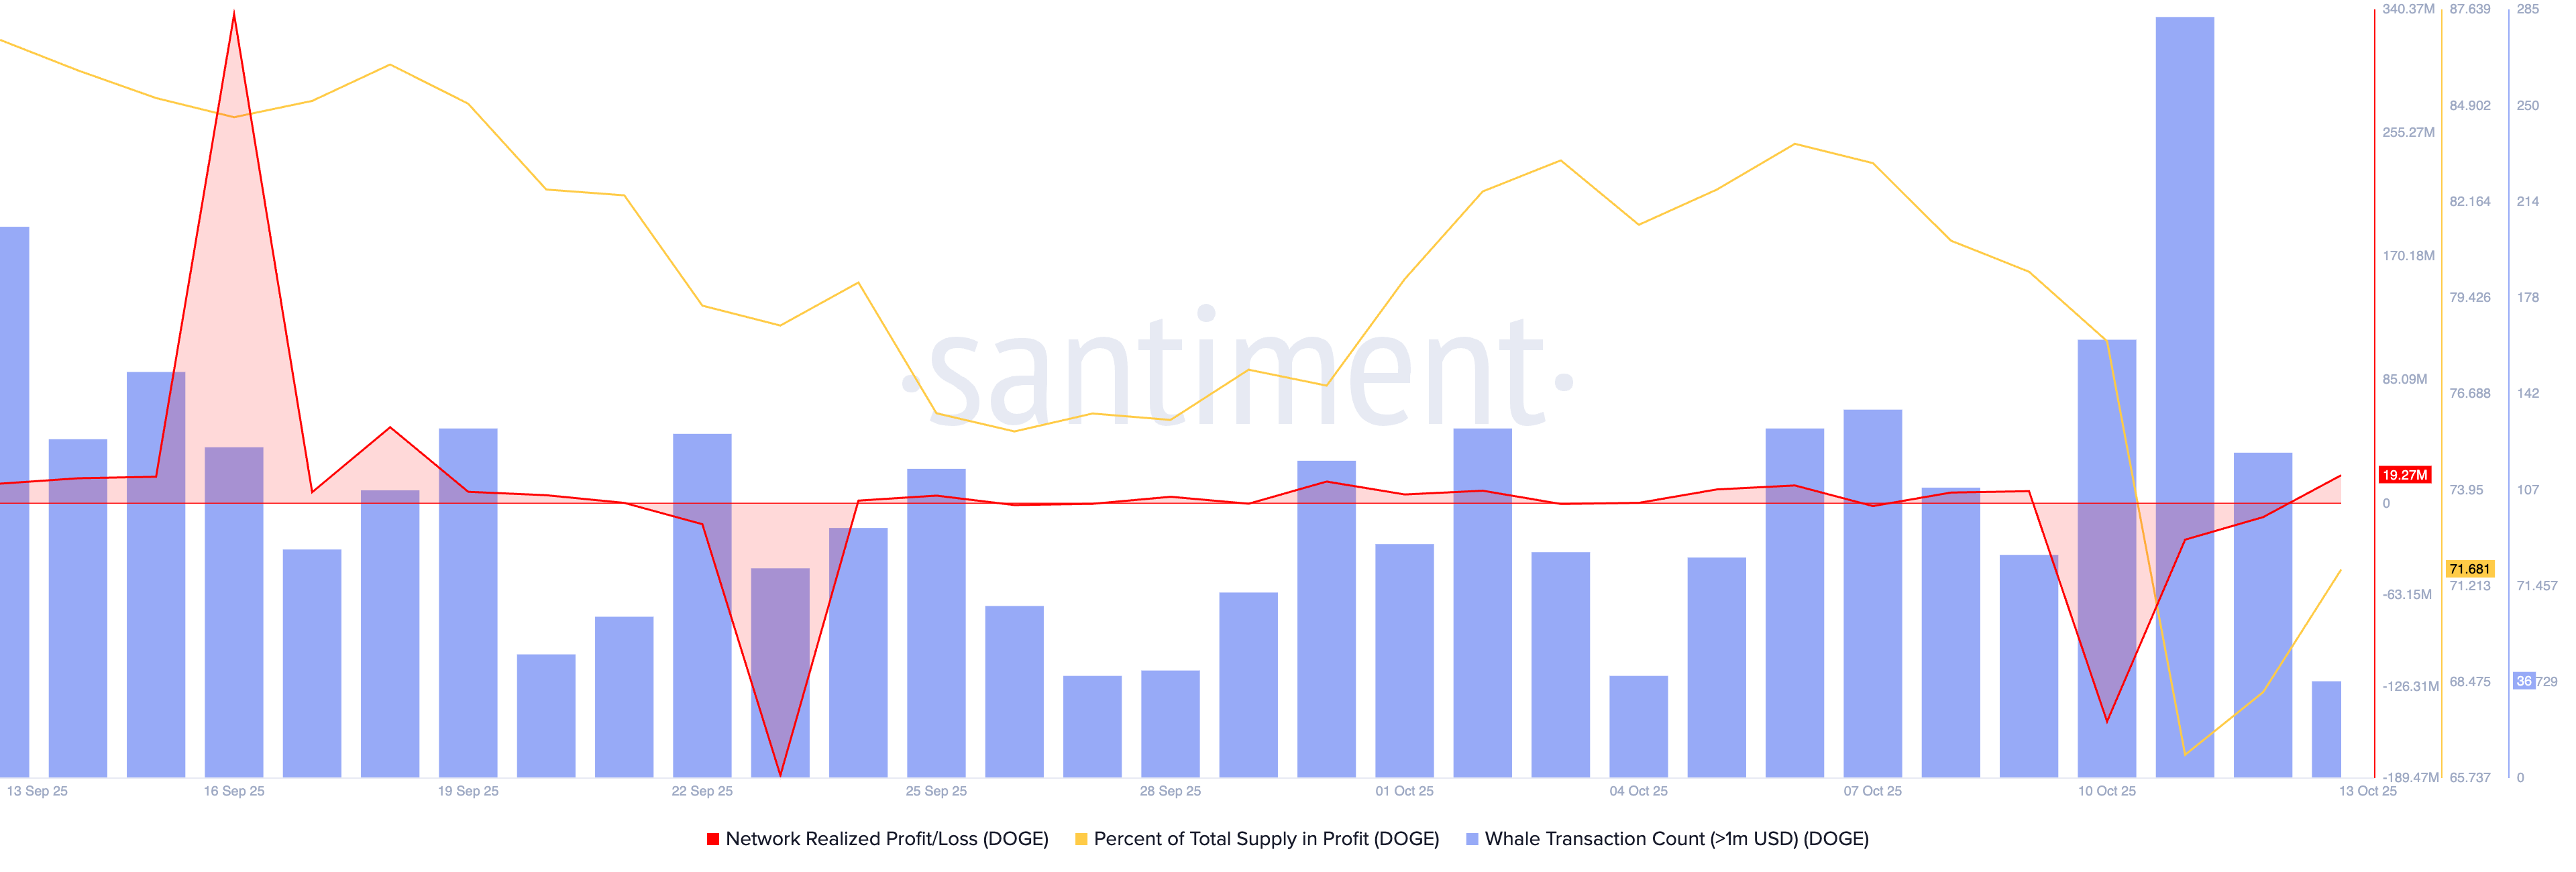
Dogecoin NRPL data. Source: Santiment.
On the 4-hour chart, the recovery in DOGE targets the $0.22046 level, marked by Thursday’s low. A decisive close above this level could extend the recovery run to the $0.25000 round figure.
The Moving Average Convergence Divergence (MACD) on the same chart extends the upward trend after crossing above its signal line on Sunday, indicating a positive shift in trend momentum. At the same time, the Relative Strength Index (RSI) at 44 recovers from the oversold zone, suggesting a decline in selling pressure.
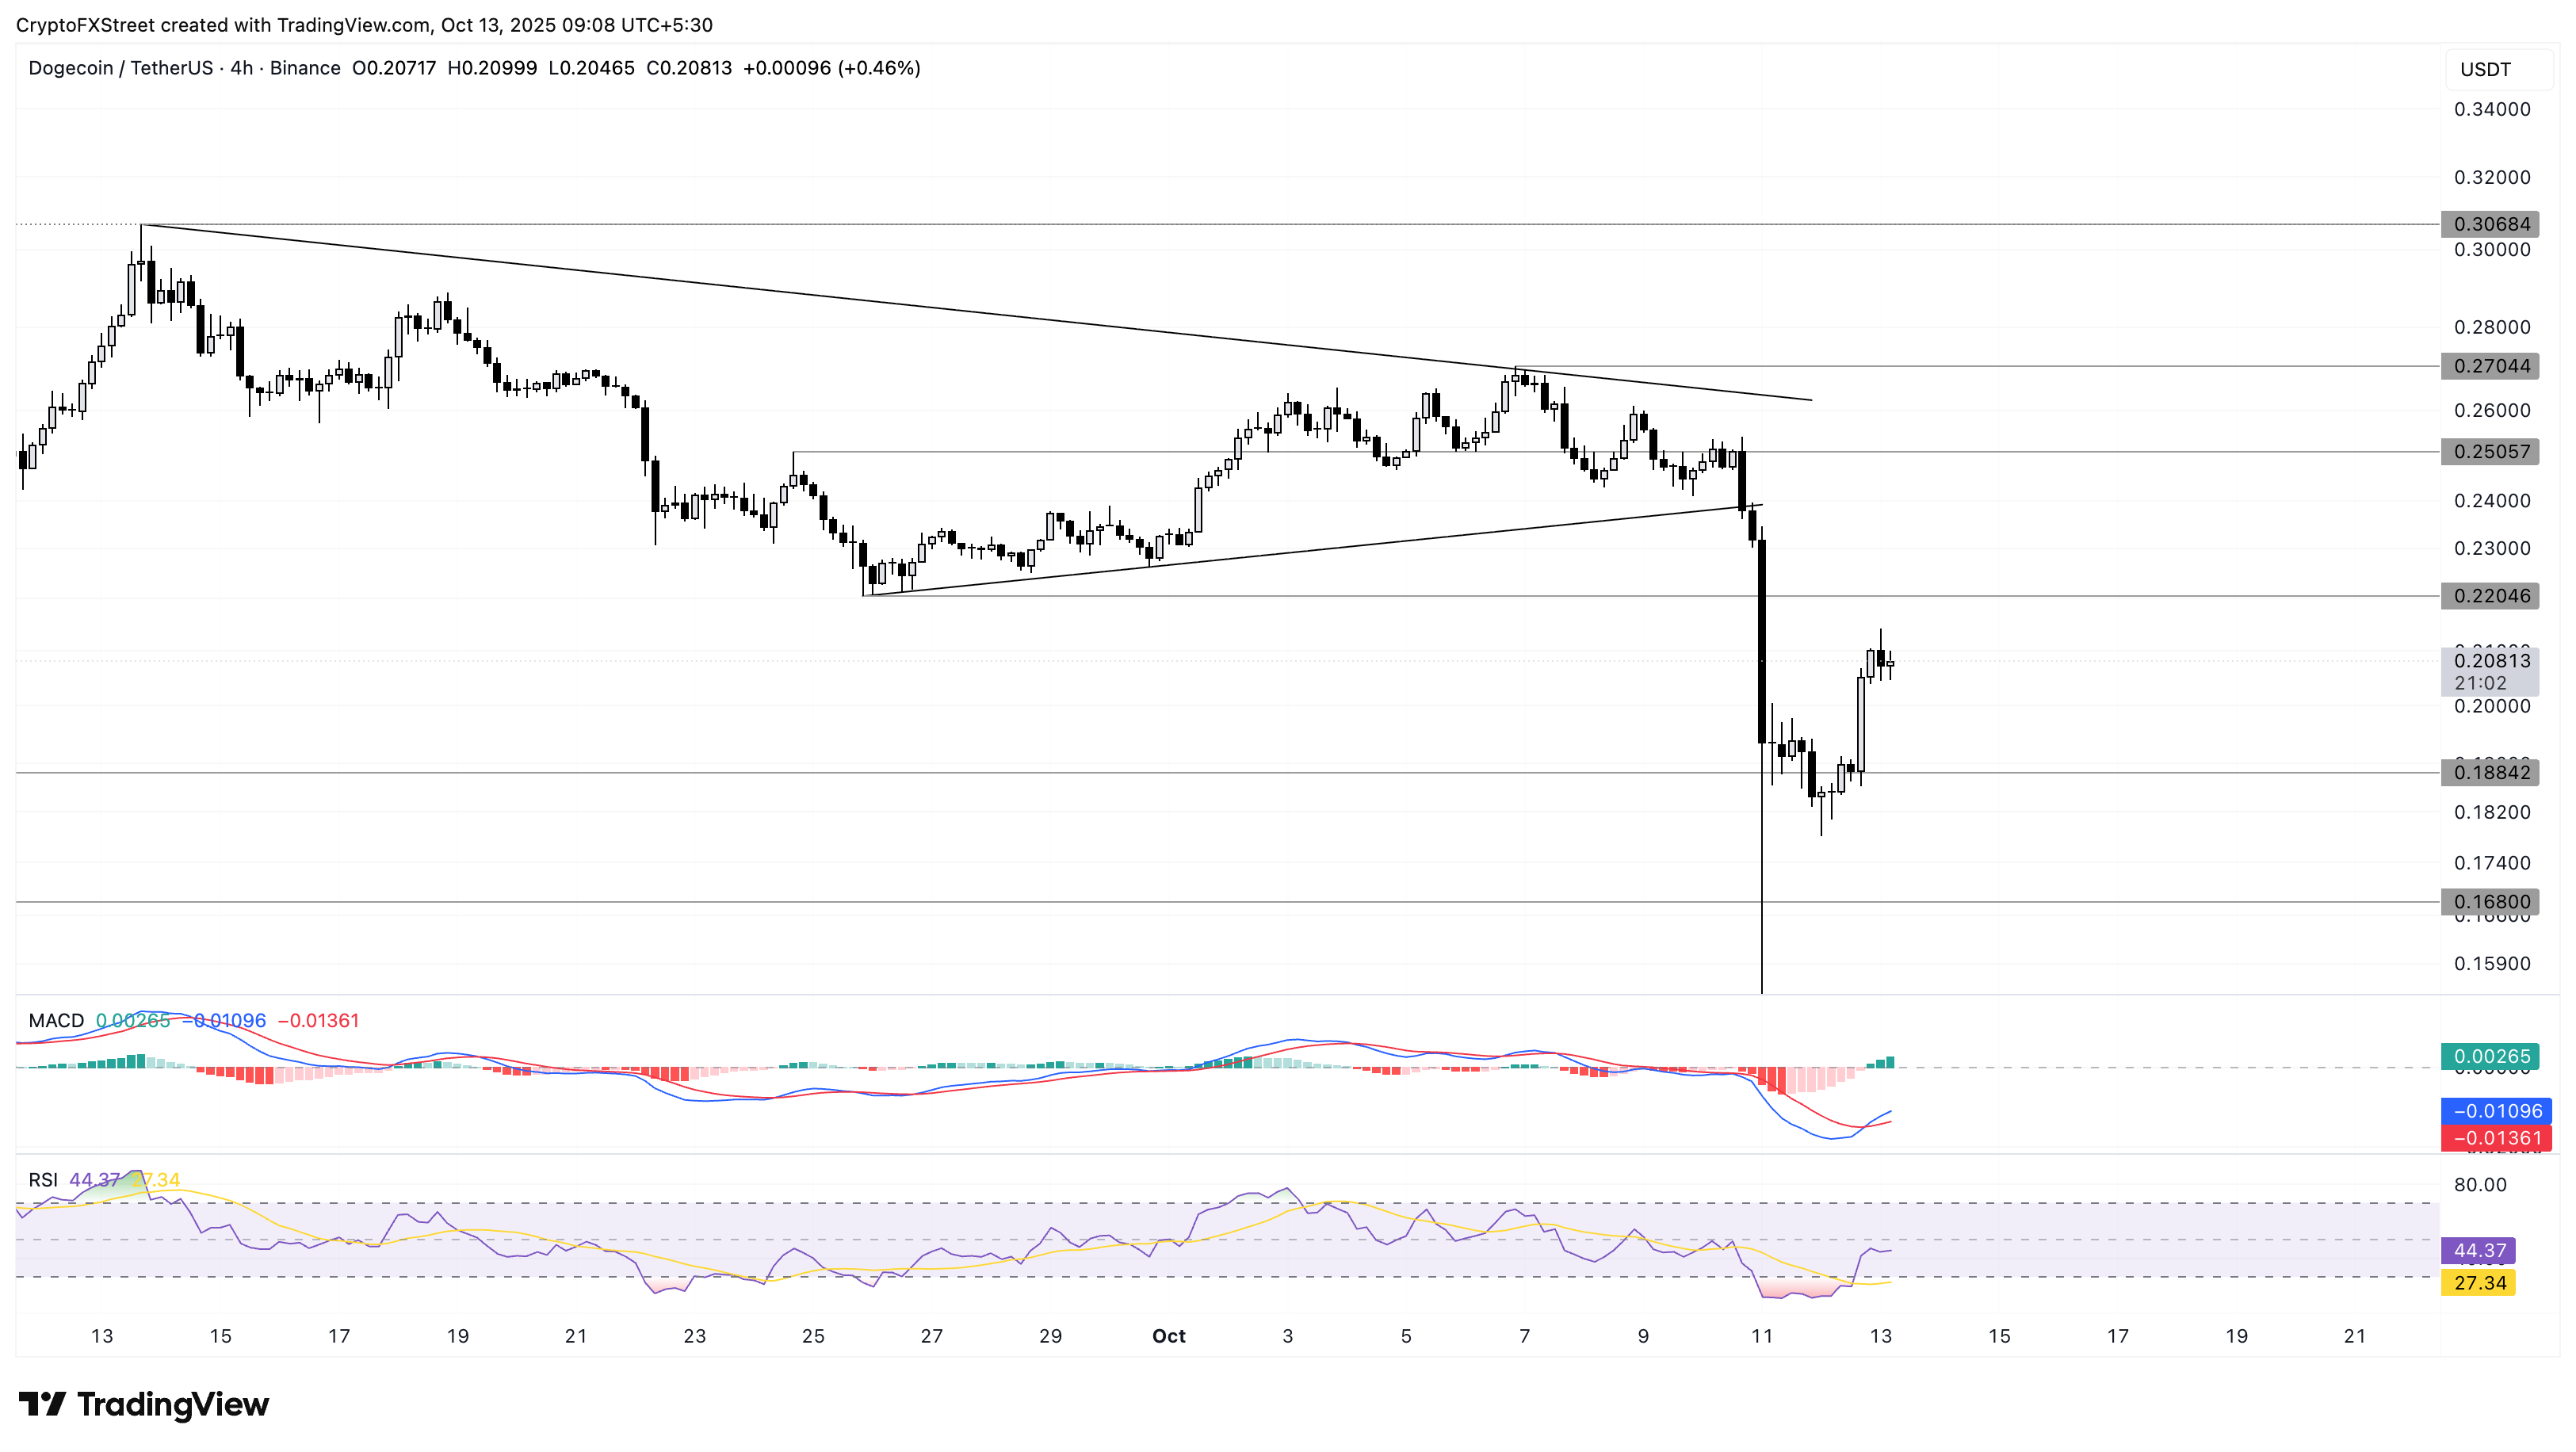
DOGE/USDT 4-hour price chart.
Looking down, if DOGE fails to hold above $0.20000, it could retest the $0.16800 support marked by the June 6 low.
Shiba Inu eyes further recovery above a key support level
Shiba Inu holds steady above $0.00001000 psychological level at press time on Monday after two consecutive days of recovery. Similar to Dogecoin, the selling pressure in Shiba Inu is waning as Santiment’s NRPL data has recovered to -1.42 million SHIB from -10.46 million SHIB on Sunday. This reduction in SHIB booked at a loss reflects a resurfacing demand among investors to hold and watch.
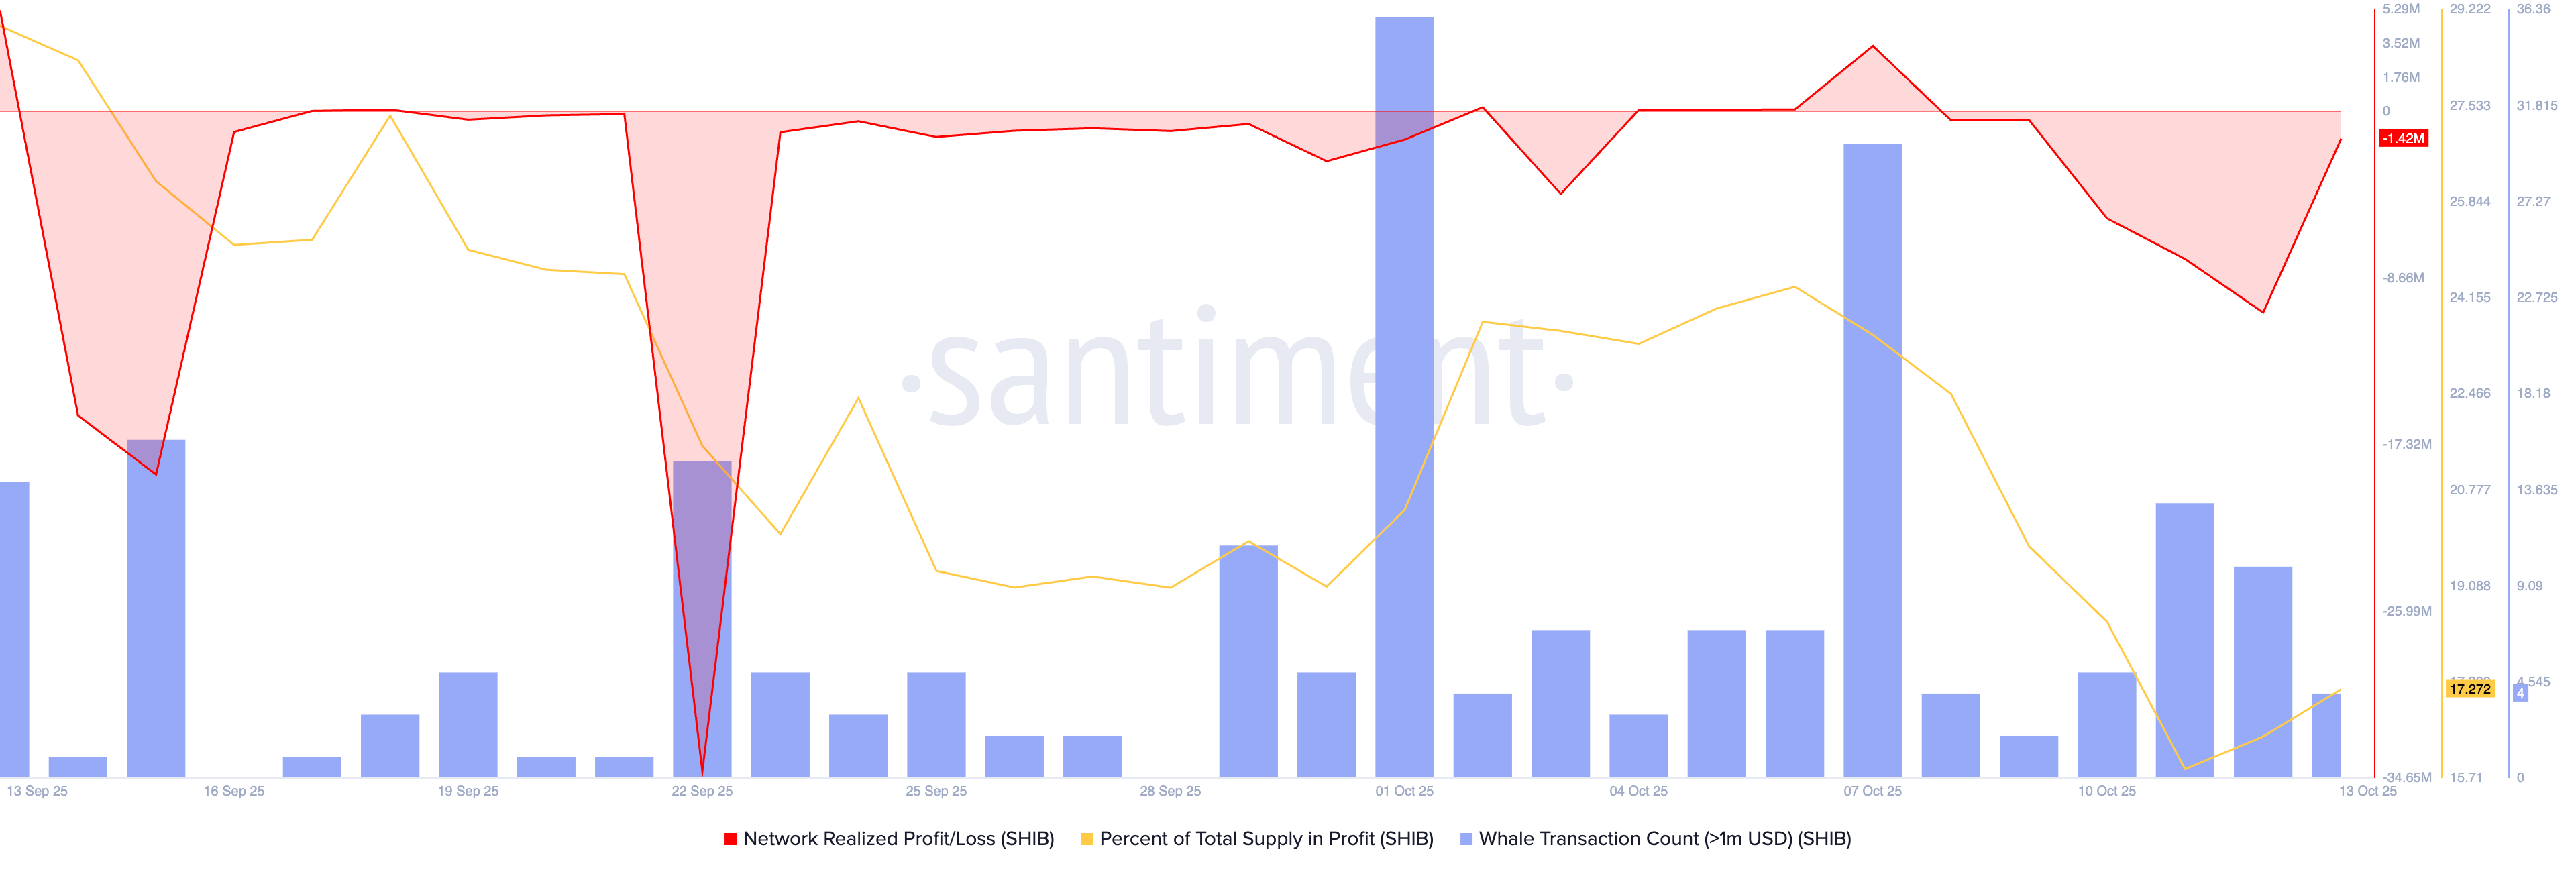
SHIB NRPL data. Source: Santiment.
The recovery run in SHIB could face opposition from the $0.00001148 level on the 4-hour chart, which previously acted as support on July 1. A potential surge above this level could target the $0.00001361 level, marked by Thursday’s low.
The RSI is at 43, corroborating the decline in selling pressure. Additionally, the MACD and its signal line have been steadily rising after a crossover on Sunday, suggesting that bullish momentum is resurfacing.
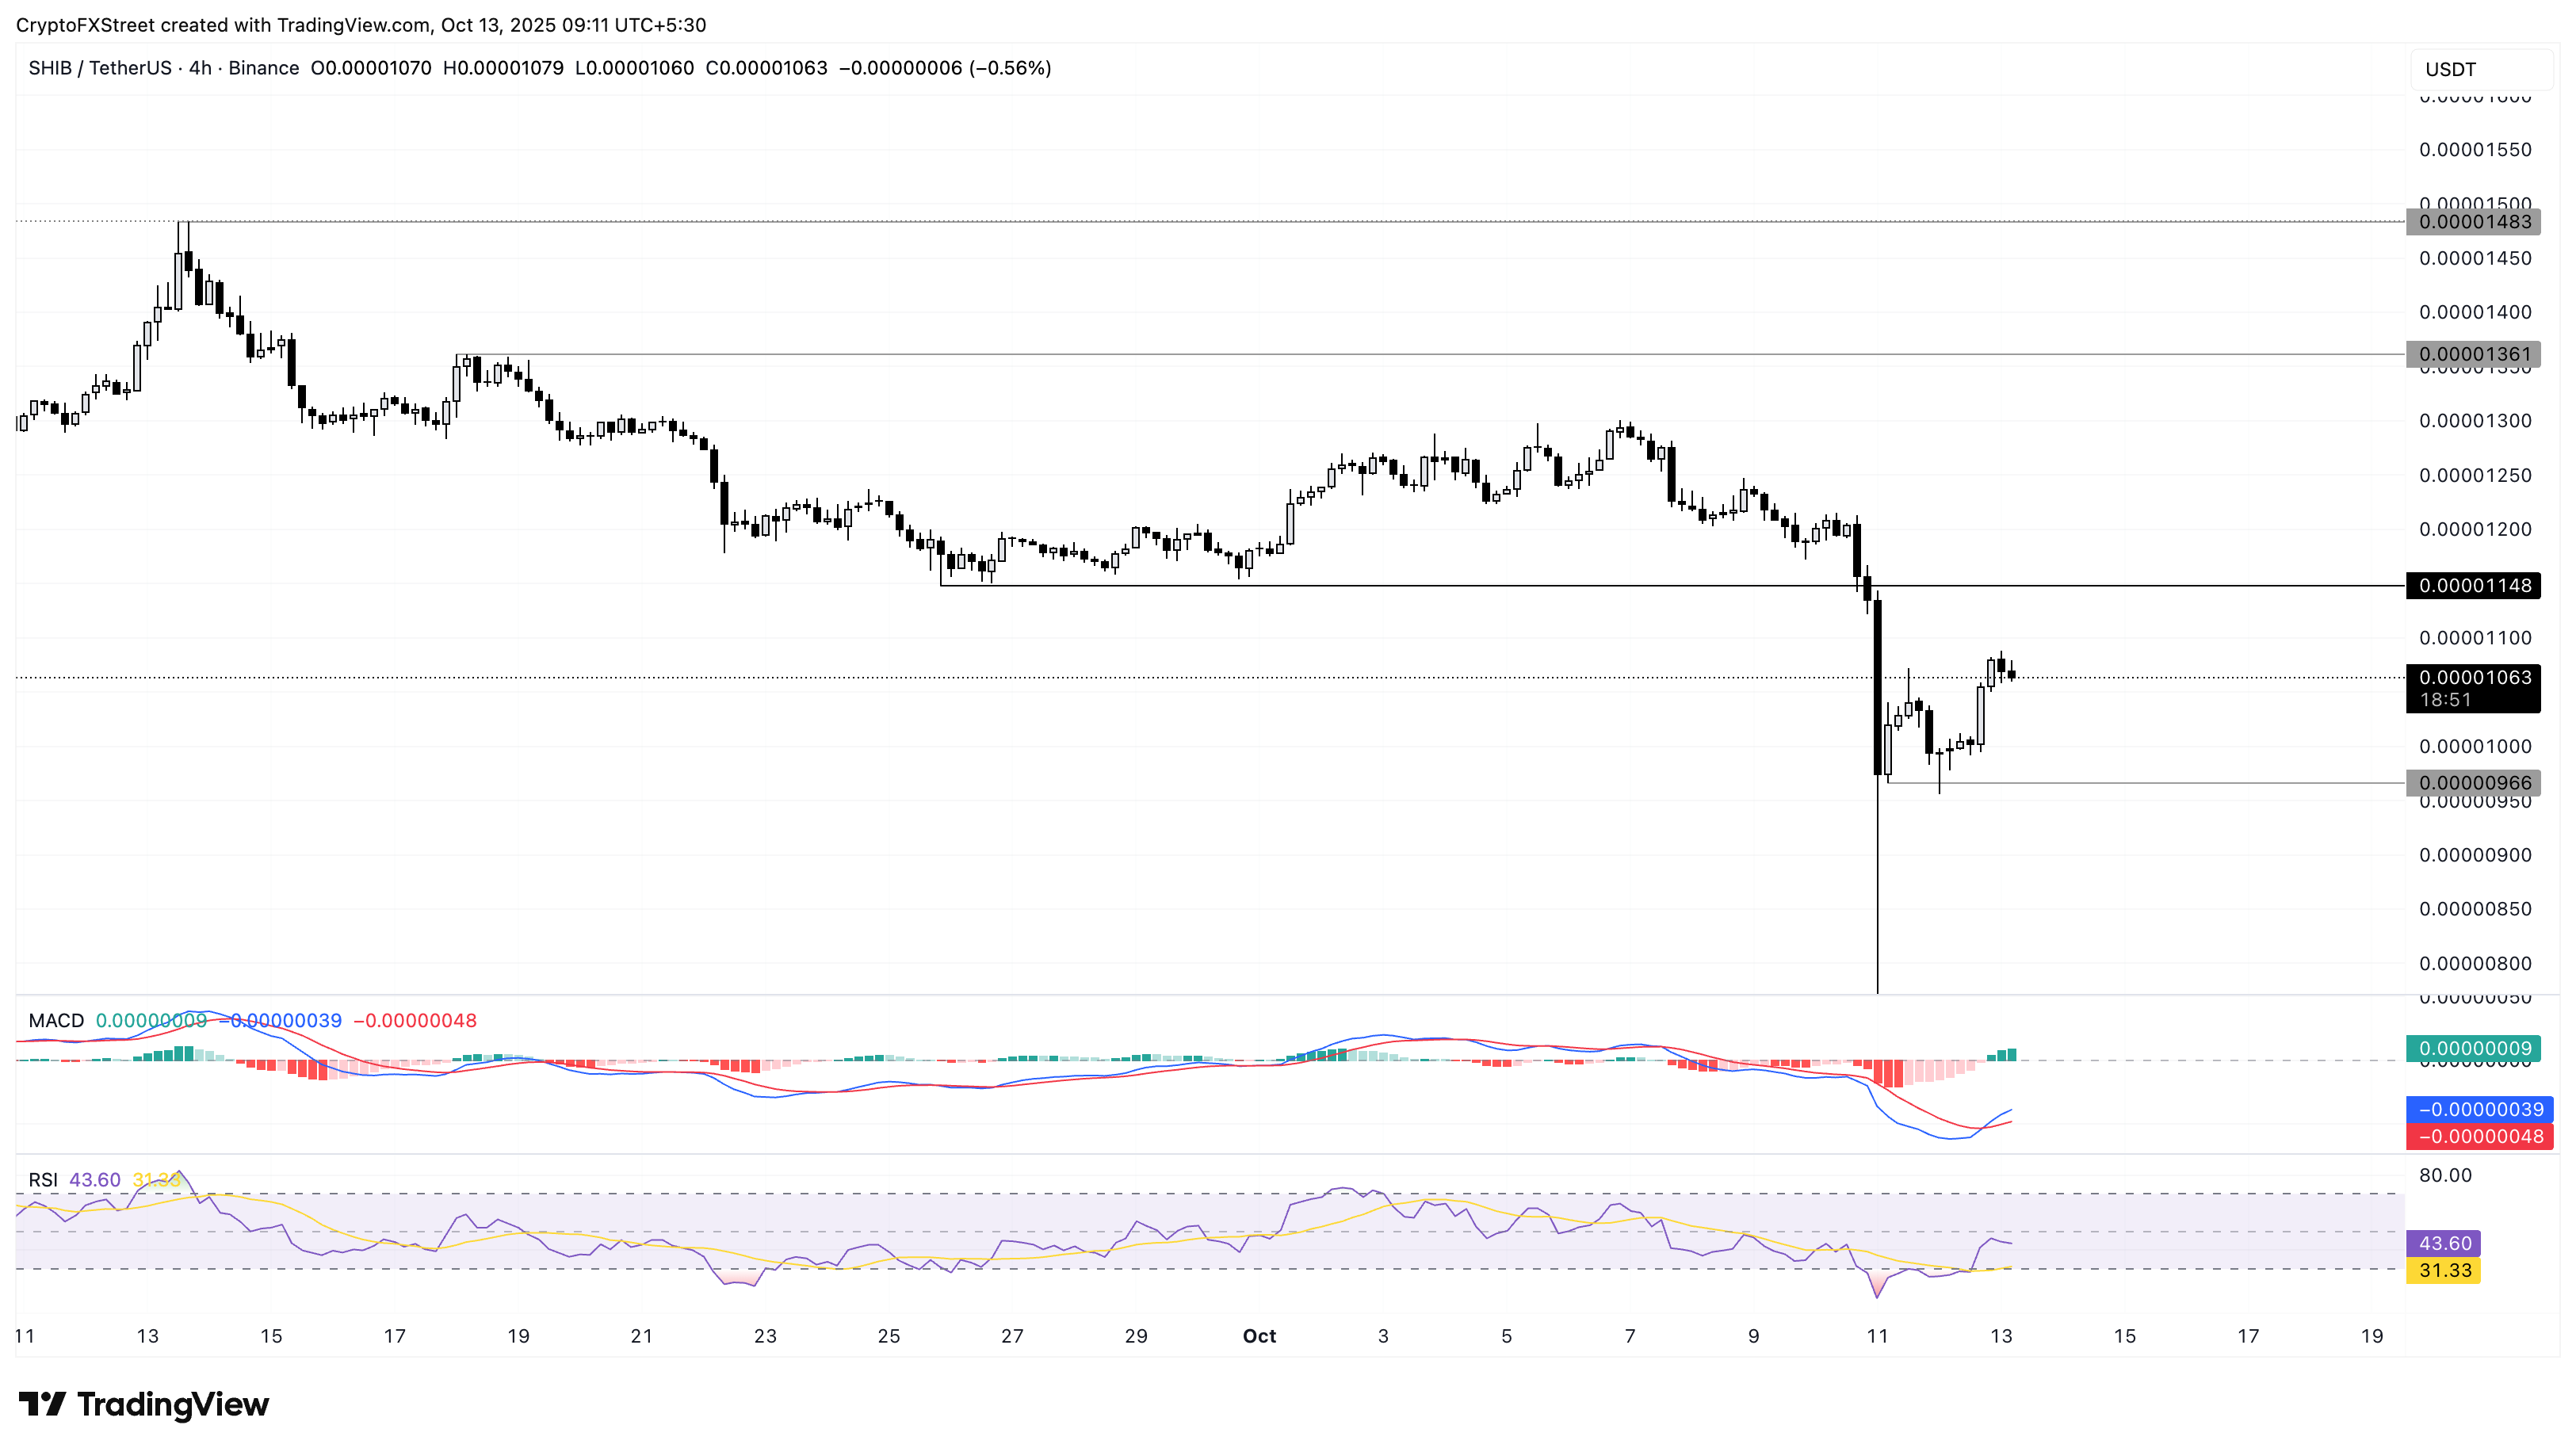
SHIB/USDT 4-hour price chart.
On the flipside, if SHIB reverses below $0.00001000, it could threaten the $0.00000966 low, marked by the first positive 4-hour candle on Friday.
Pepe regains strength with mid-size investors creating demand
Pepe is trading above $0.00000750 at the time of writing on Monday, following the 11% recovery on Sunday. The frog-themed meme coin stabilizes after Friday’s 27% decline, teasing a potential recovery ahead.
PEPE is attracting interest from mid-sized investors, as Santiment’s supply distribution metric indicates a steady accumulation spree among cohorts holding 100,000 to 10 million PEPE, with their portfolio reaching 610.21 billion PEPE.
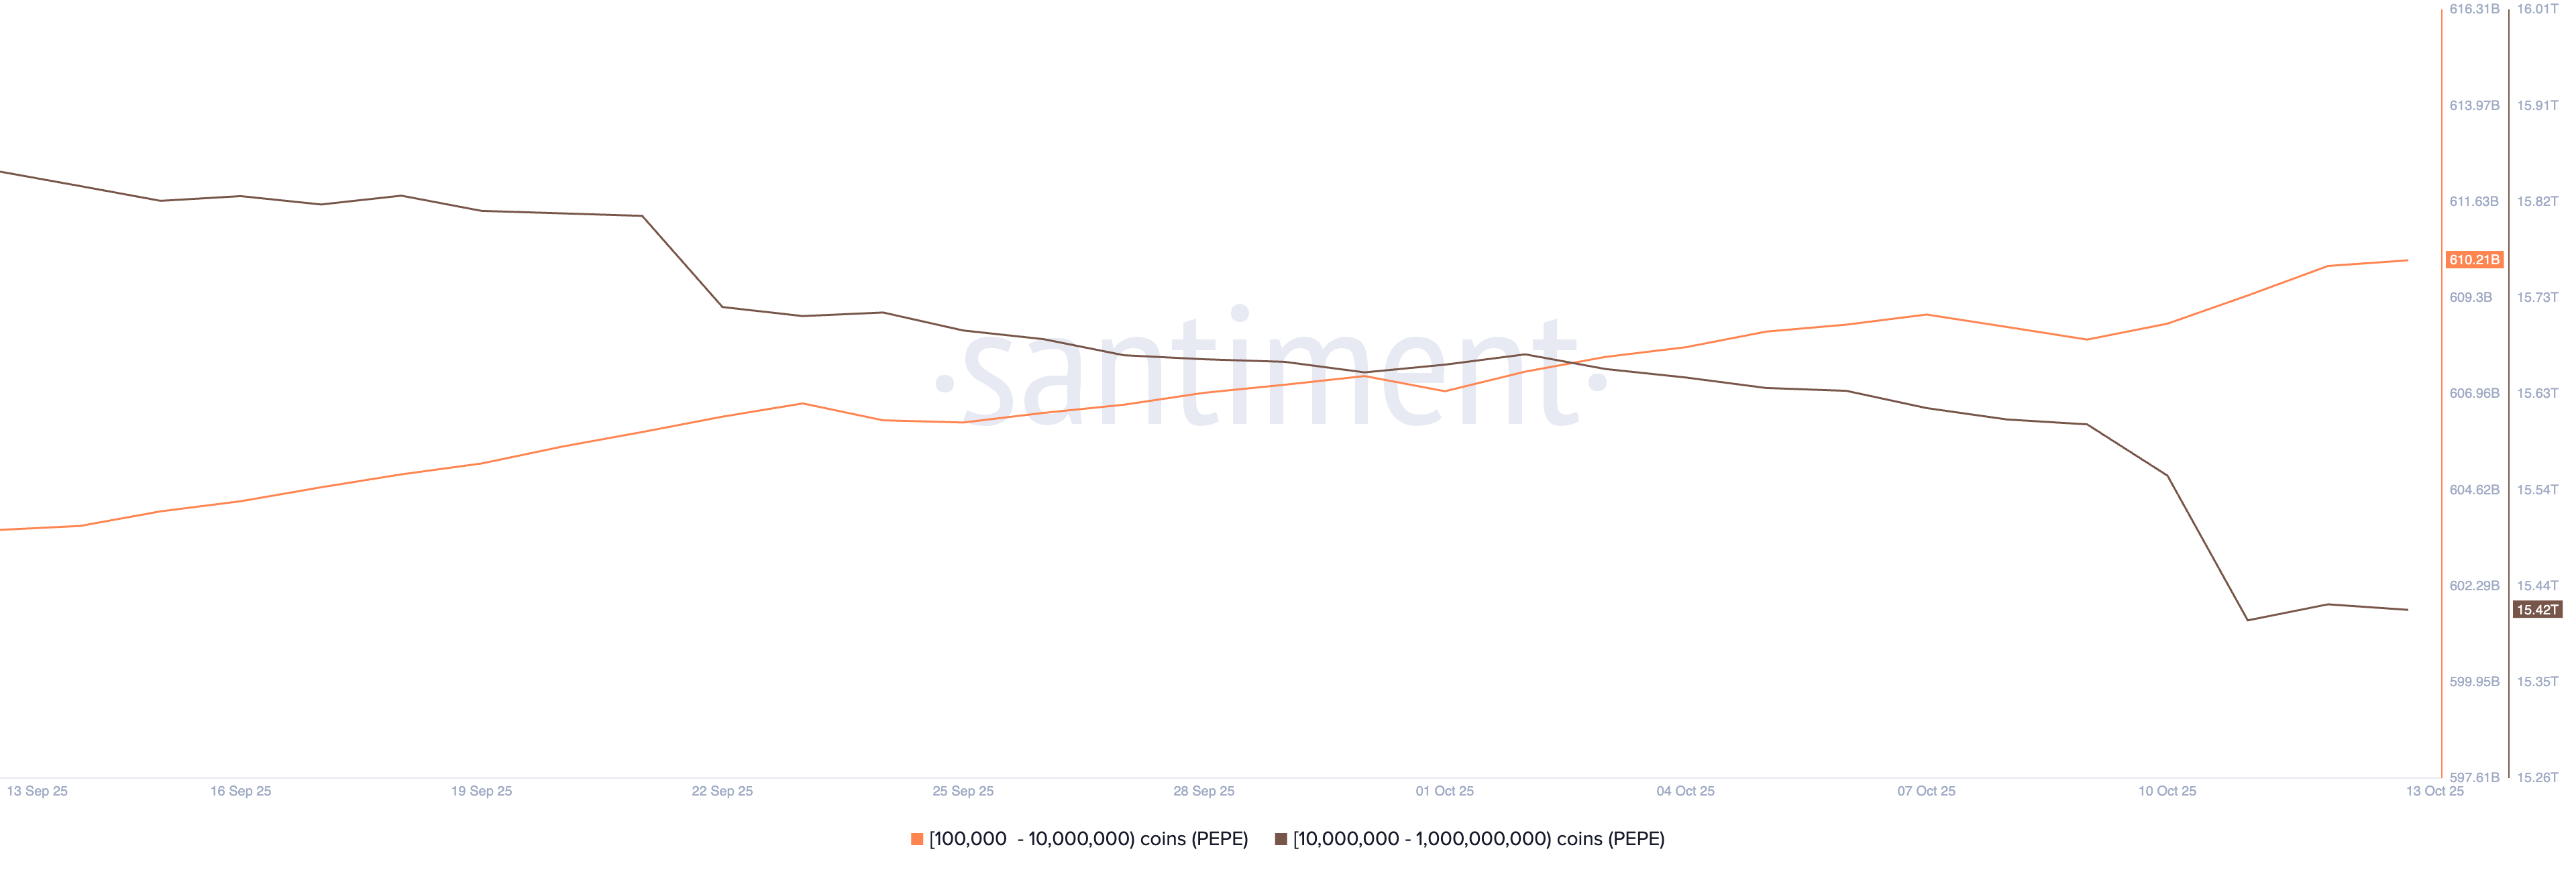
PEPE supply distribution. Source: Santiment.
Similarly, large-wallet investors with 10 million to 1 billion PEPE halt the offloading spree, stabilizing holdings at 15.42 trillion.
Corroborating the decline in selling pressure, the RSI at 34 resurfaces from the oversold zone. Meanwhile, the MACD and its signal line are on a declining trend, indicating bearish pressure over trend momentum.
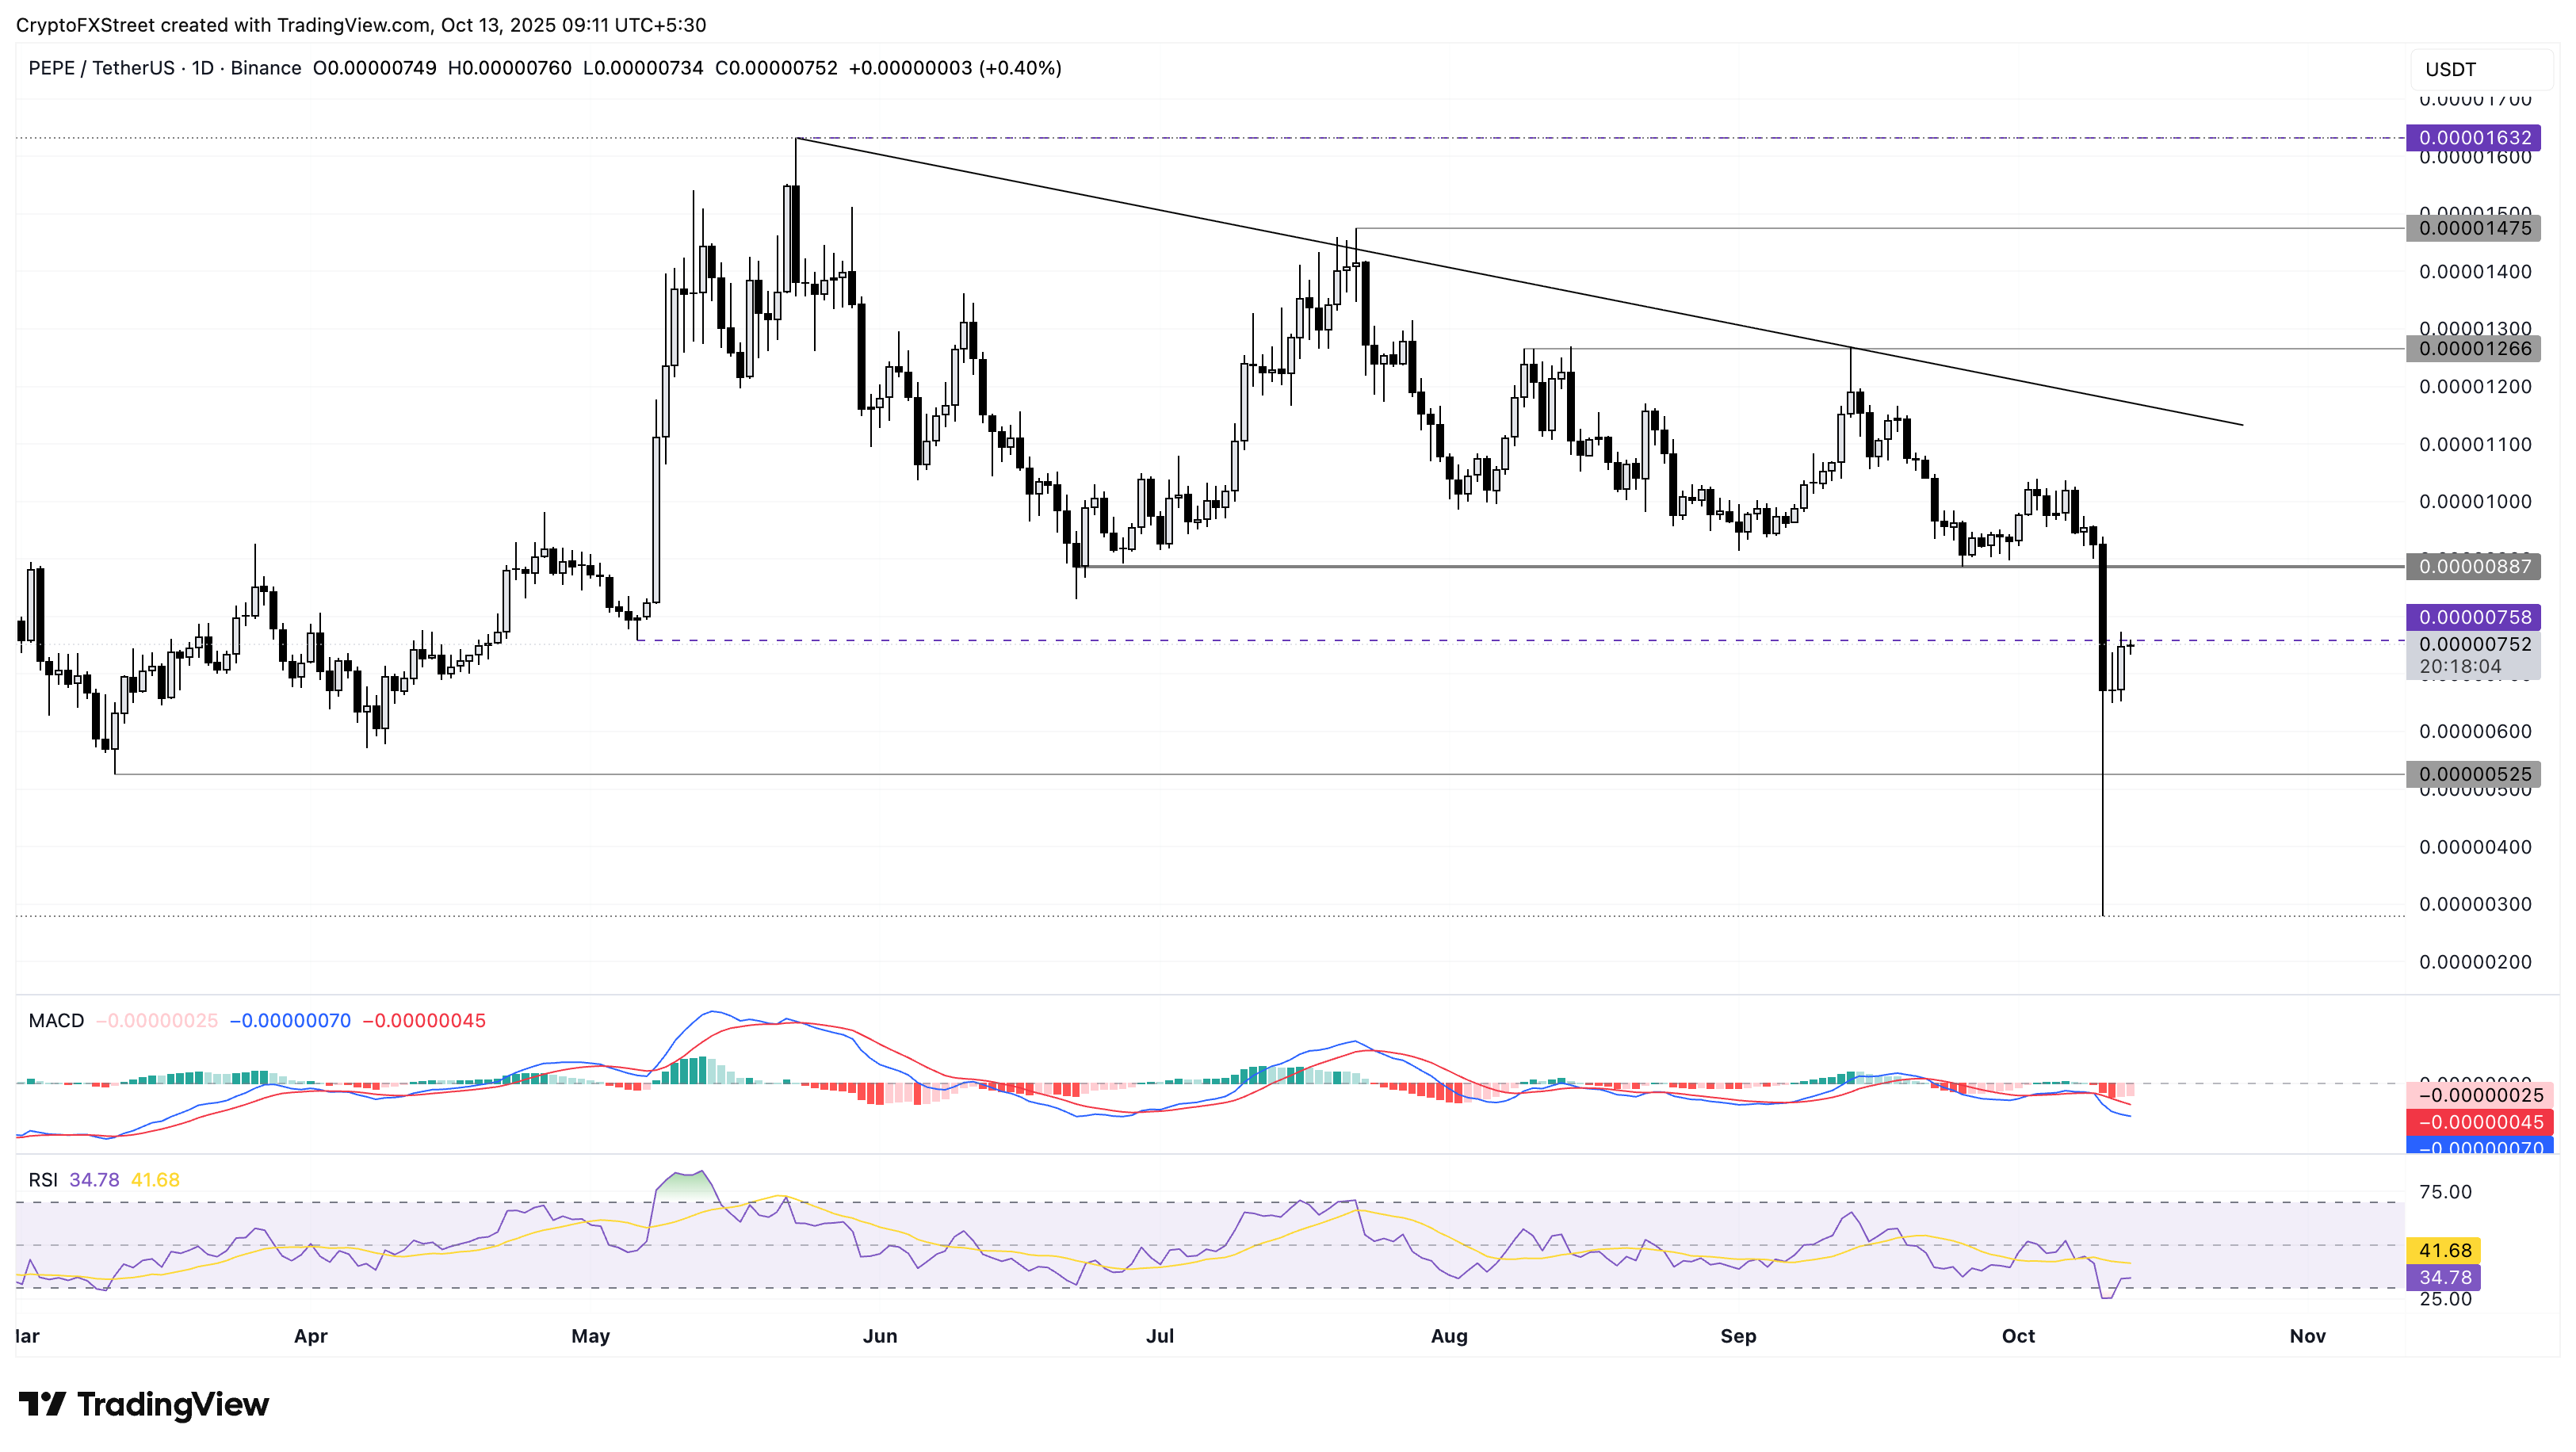
PEPE/USDT daily price chart.
If PEPE fails to hold the Sunday gains, a clean push below its $0.00000653 low could extend the decline to the $0.00000500 psychological level.
Recommended Articles


