
Near Protocol Price Forecast: NEAR bounces back on retail interest, bullish bets surge
- Near Protocol bounces off its 200-day EMA, amid an impending Golden Cross pattern.
- Bullish bets and futures Open Interest surge signals increased optimism surrounding Near Protocol.
- Near Protocol’s TVL holds around $185 million after the mid-September rebound, suggesting steady user adoption.
Near Protocol (NEAR) price is up by 4% at the time of writing on Friday, trading at the $3.00 psychological mark. The short-term recovery could secure further gains as bullish bets surge in NEAR derivatives. A steady trend in Total Value Locked (TVL) on Near Chain bolsters its rising demand.
Rising interest in Near Protocol amid stabilizing DeFi flows
Near Protocol has significantly gained retail interest as the broader cryptocurrency market remains volatile. CoinGlass data shows that the NEAR futures Open Interest (OI) has increased by over 2% in the last 24 hours to $395.95 million. This sudden inflation in OI refers to an increase in positive sentiment among traders, leading to the accumulation of long positions.
On the other hand, the OI-weighted funding rate is back above 0.0102%, having risen from 0.0050% on Thursday. This indicates that traders are willing to pay the premium to hold long positions, reflecting their confidence in further gains.
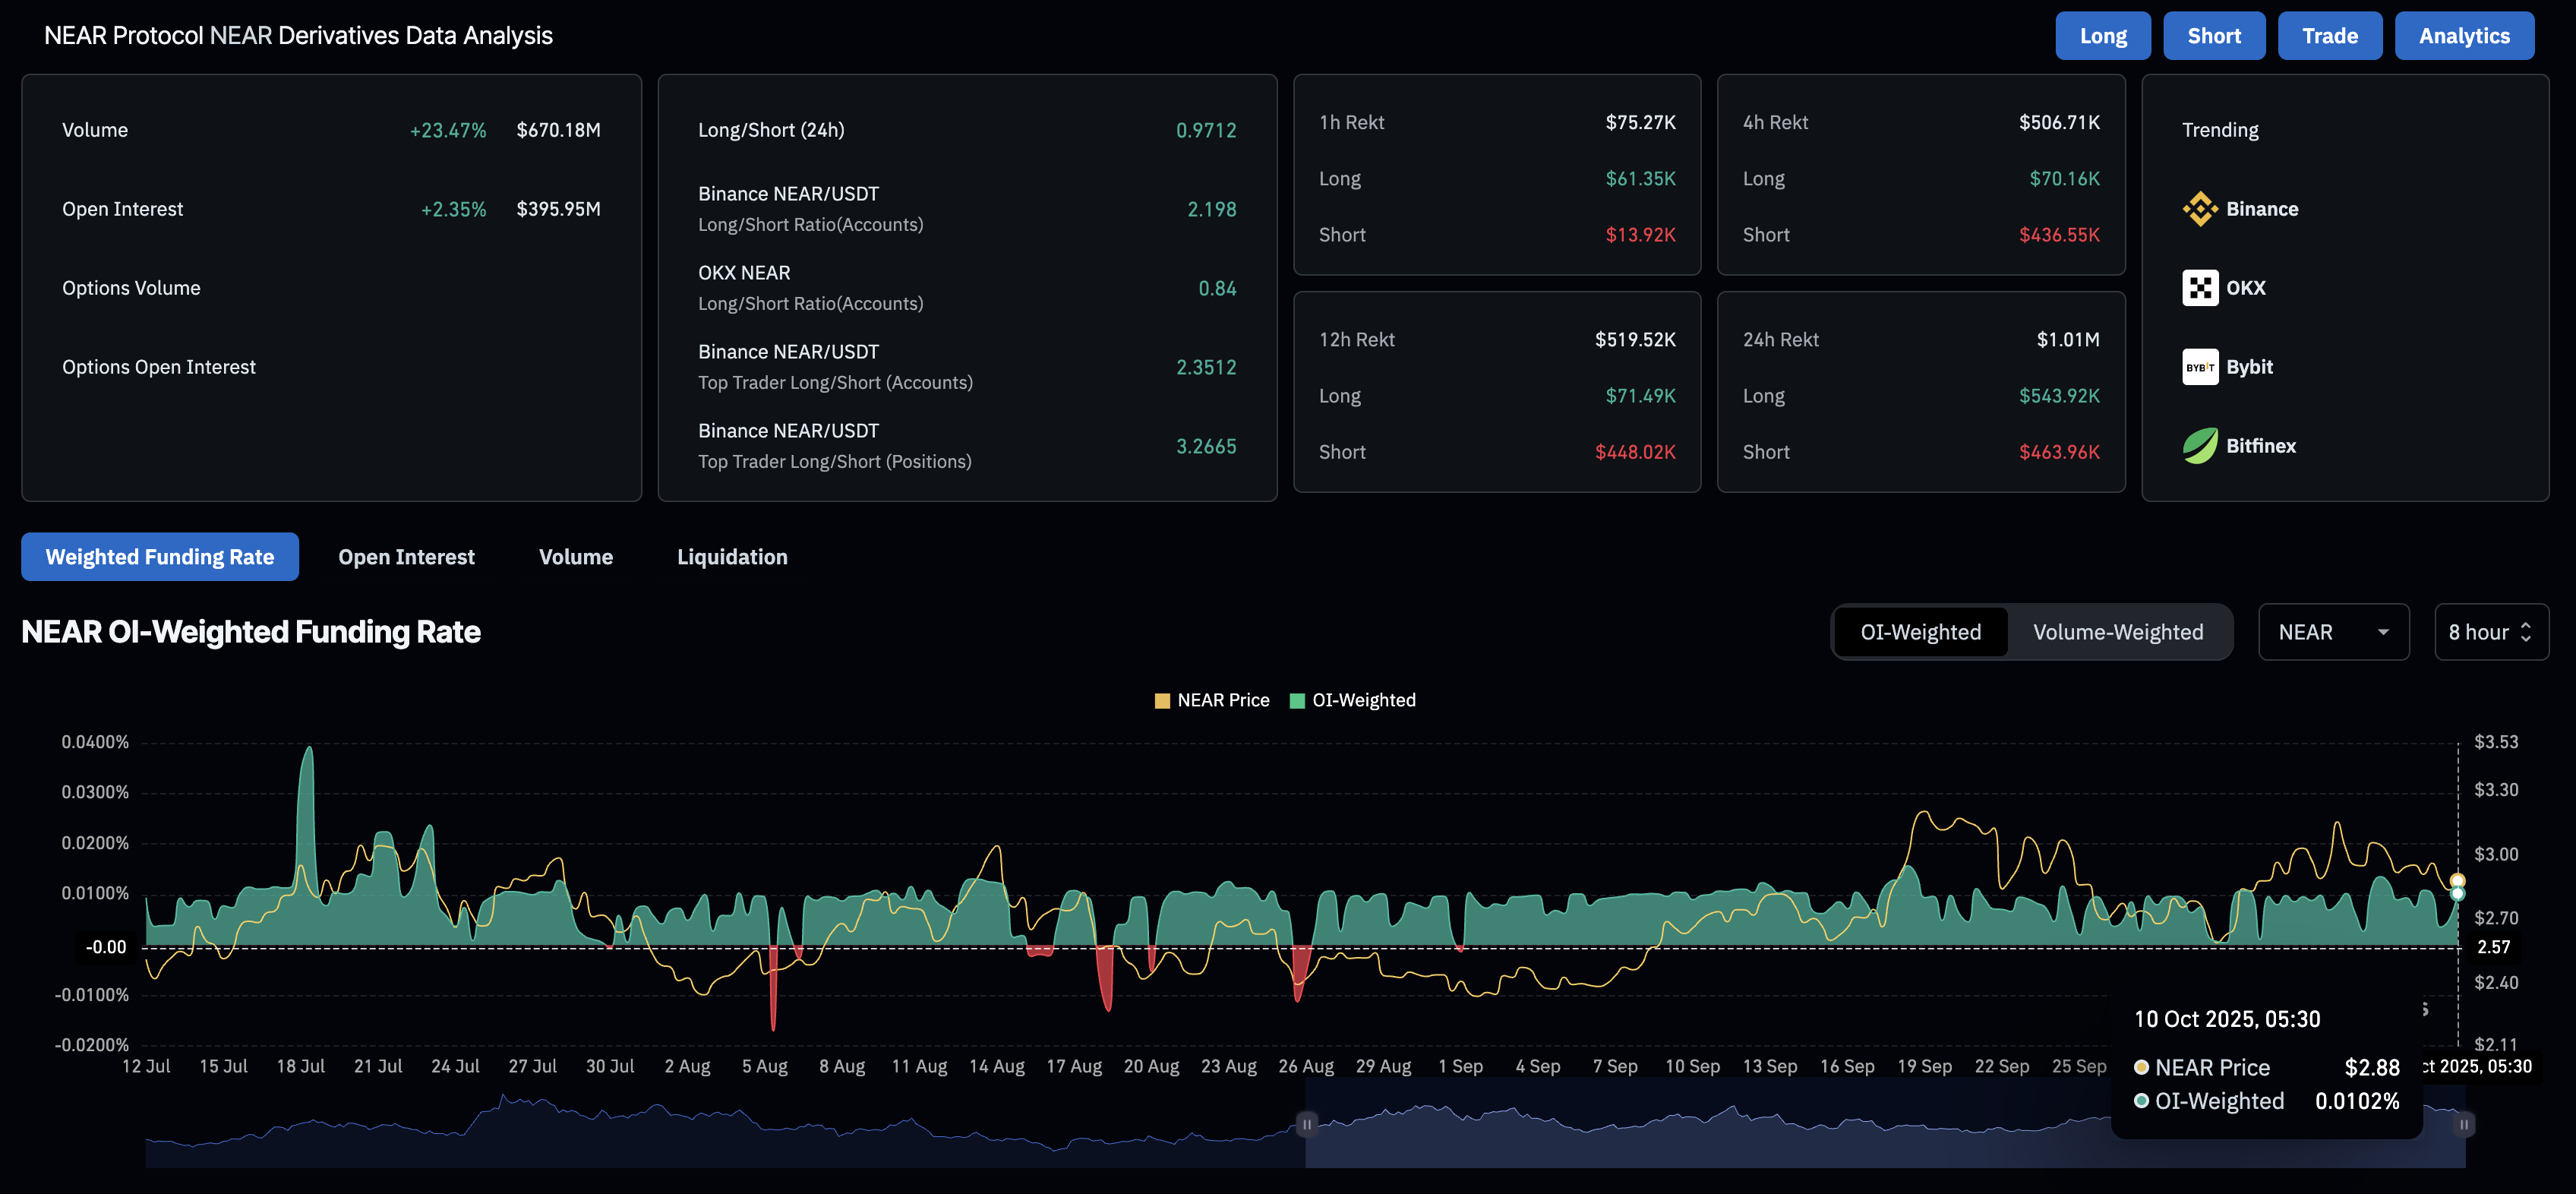
NEAR derivatives data. Source: CoinGlass
Adding to the demand, the Long/Short Ratio chart indicates a rise in bid order execution, with long positions accounting for 50.79% on Friday so far, up from 47.95% the previous day.
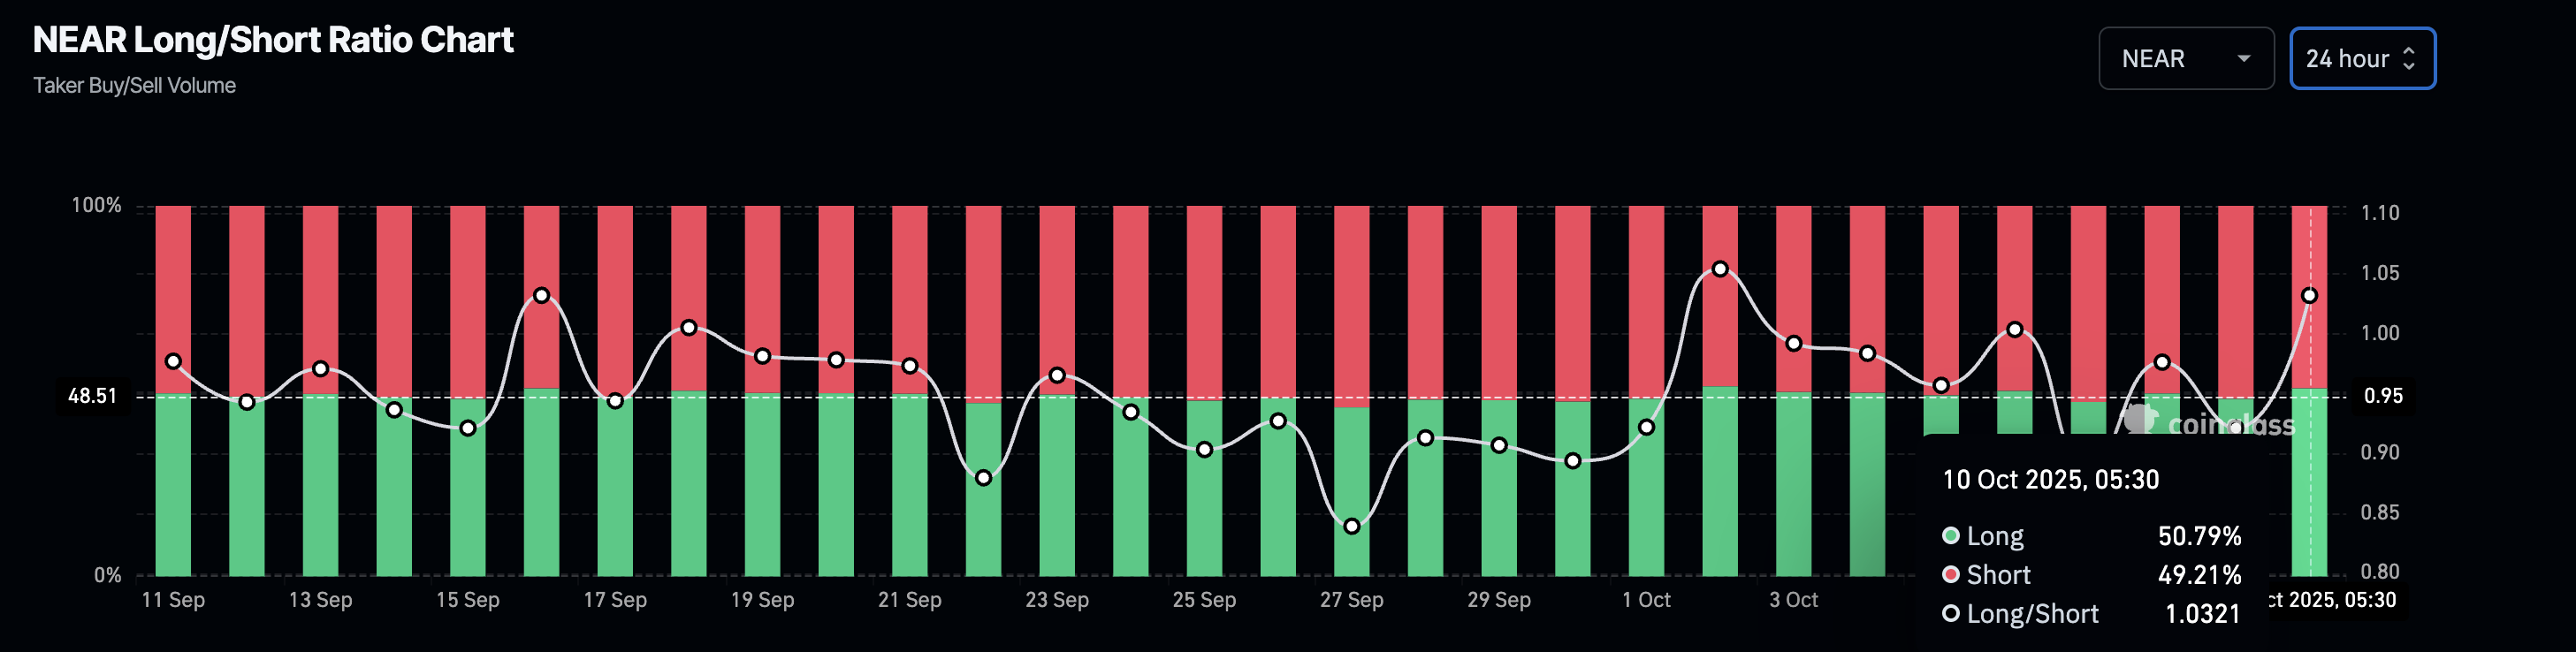
NEAR Long/Short ratio chart. Source: CoinGlass
Apart from the derivatives data, Near Chain shows a continuous flow in TVL over the last week, holding above $185 million on Friday, up from $164.76 million on October 1. This increase in user deposits on the network so far this month suggests a regular demand, which could boost the price of its native token, NEAR.
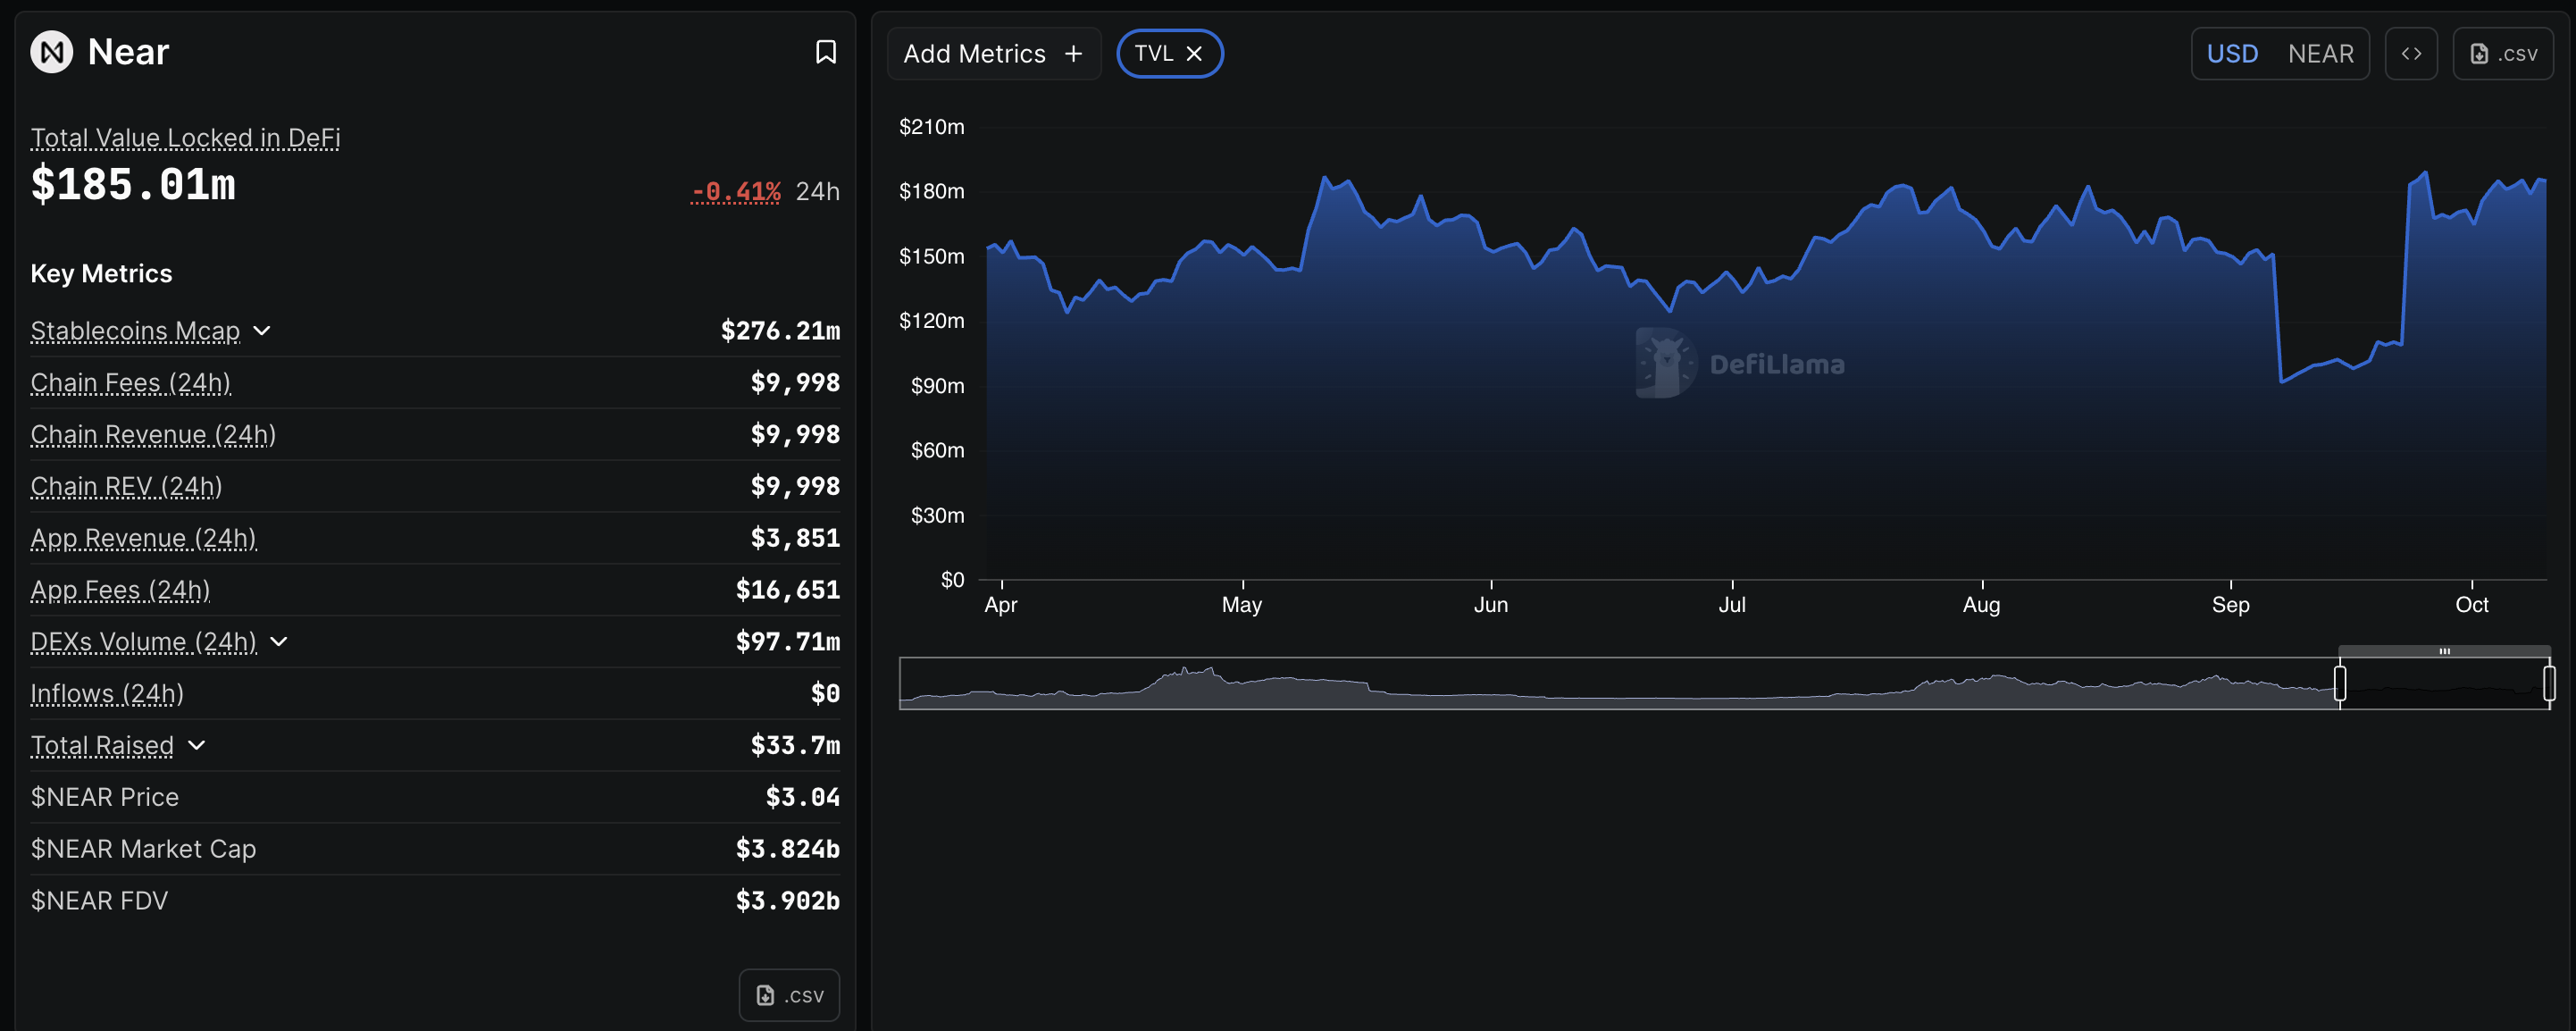
Near Chain TVL. Source: DeFiLlama
Technical outlook: Can NEAR keep the recovery steady above $3?
Near protocol records a 4% jump so far on Friday, bouncing off its 200-day Exponential Moving Average (EMA) at $2.870. The intraday recovery increases the possibility of further gains, which could catalyze the impending Golden Cross pattern between the rising 50-day and 200-day EMAs.
The immediate resistance for NEAR lies at the $3.351 level, nearly tested by the high of September 19. To reinforce a bullish reversal, NEAR should cross above the $3.632 level, marked by the February 14 high.
The Relative Strength Index (RSI) rebounds to 55 from the mid-level on the daily chart, maintaining a neutral to bullish stance. However, the Moving Average Convergence Divergence (MACD) extends an indecisive sideways trend with its signal line, reflecting the short-term volatility.
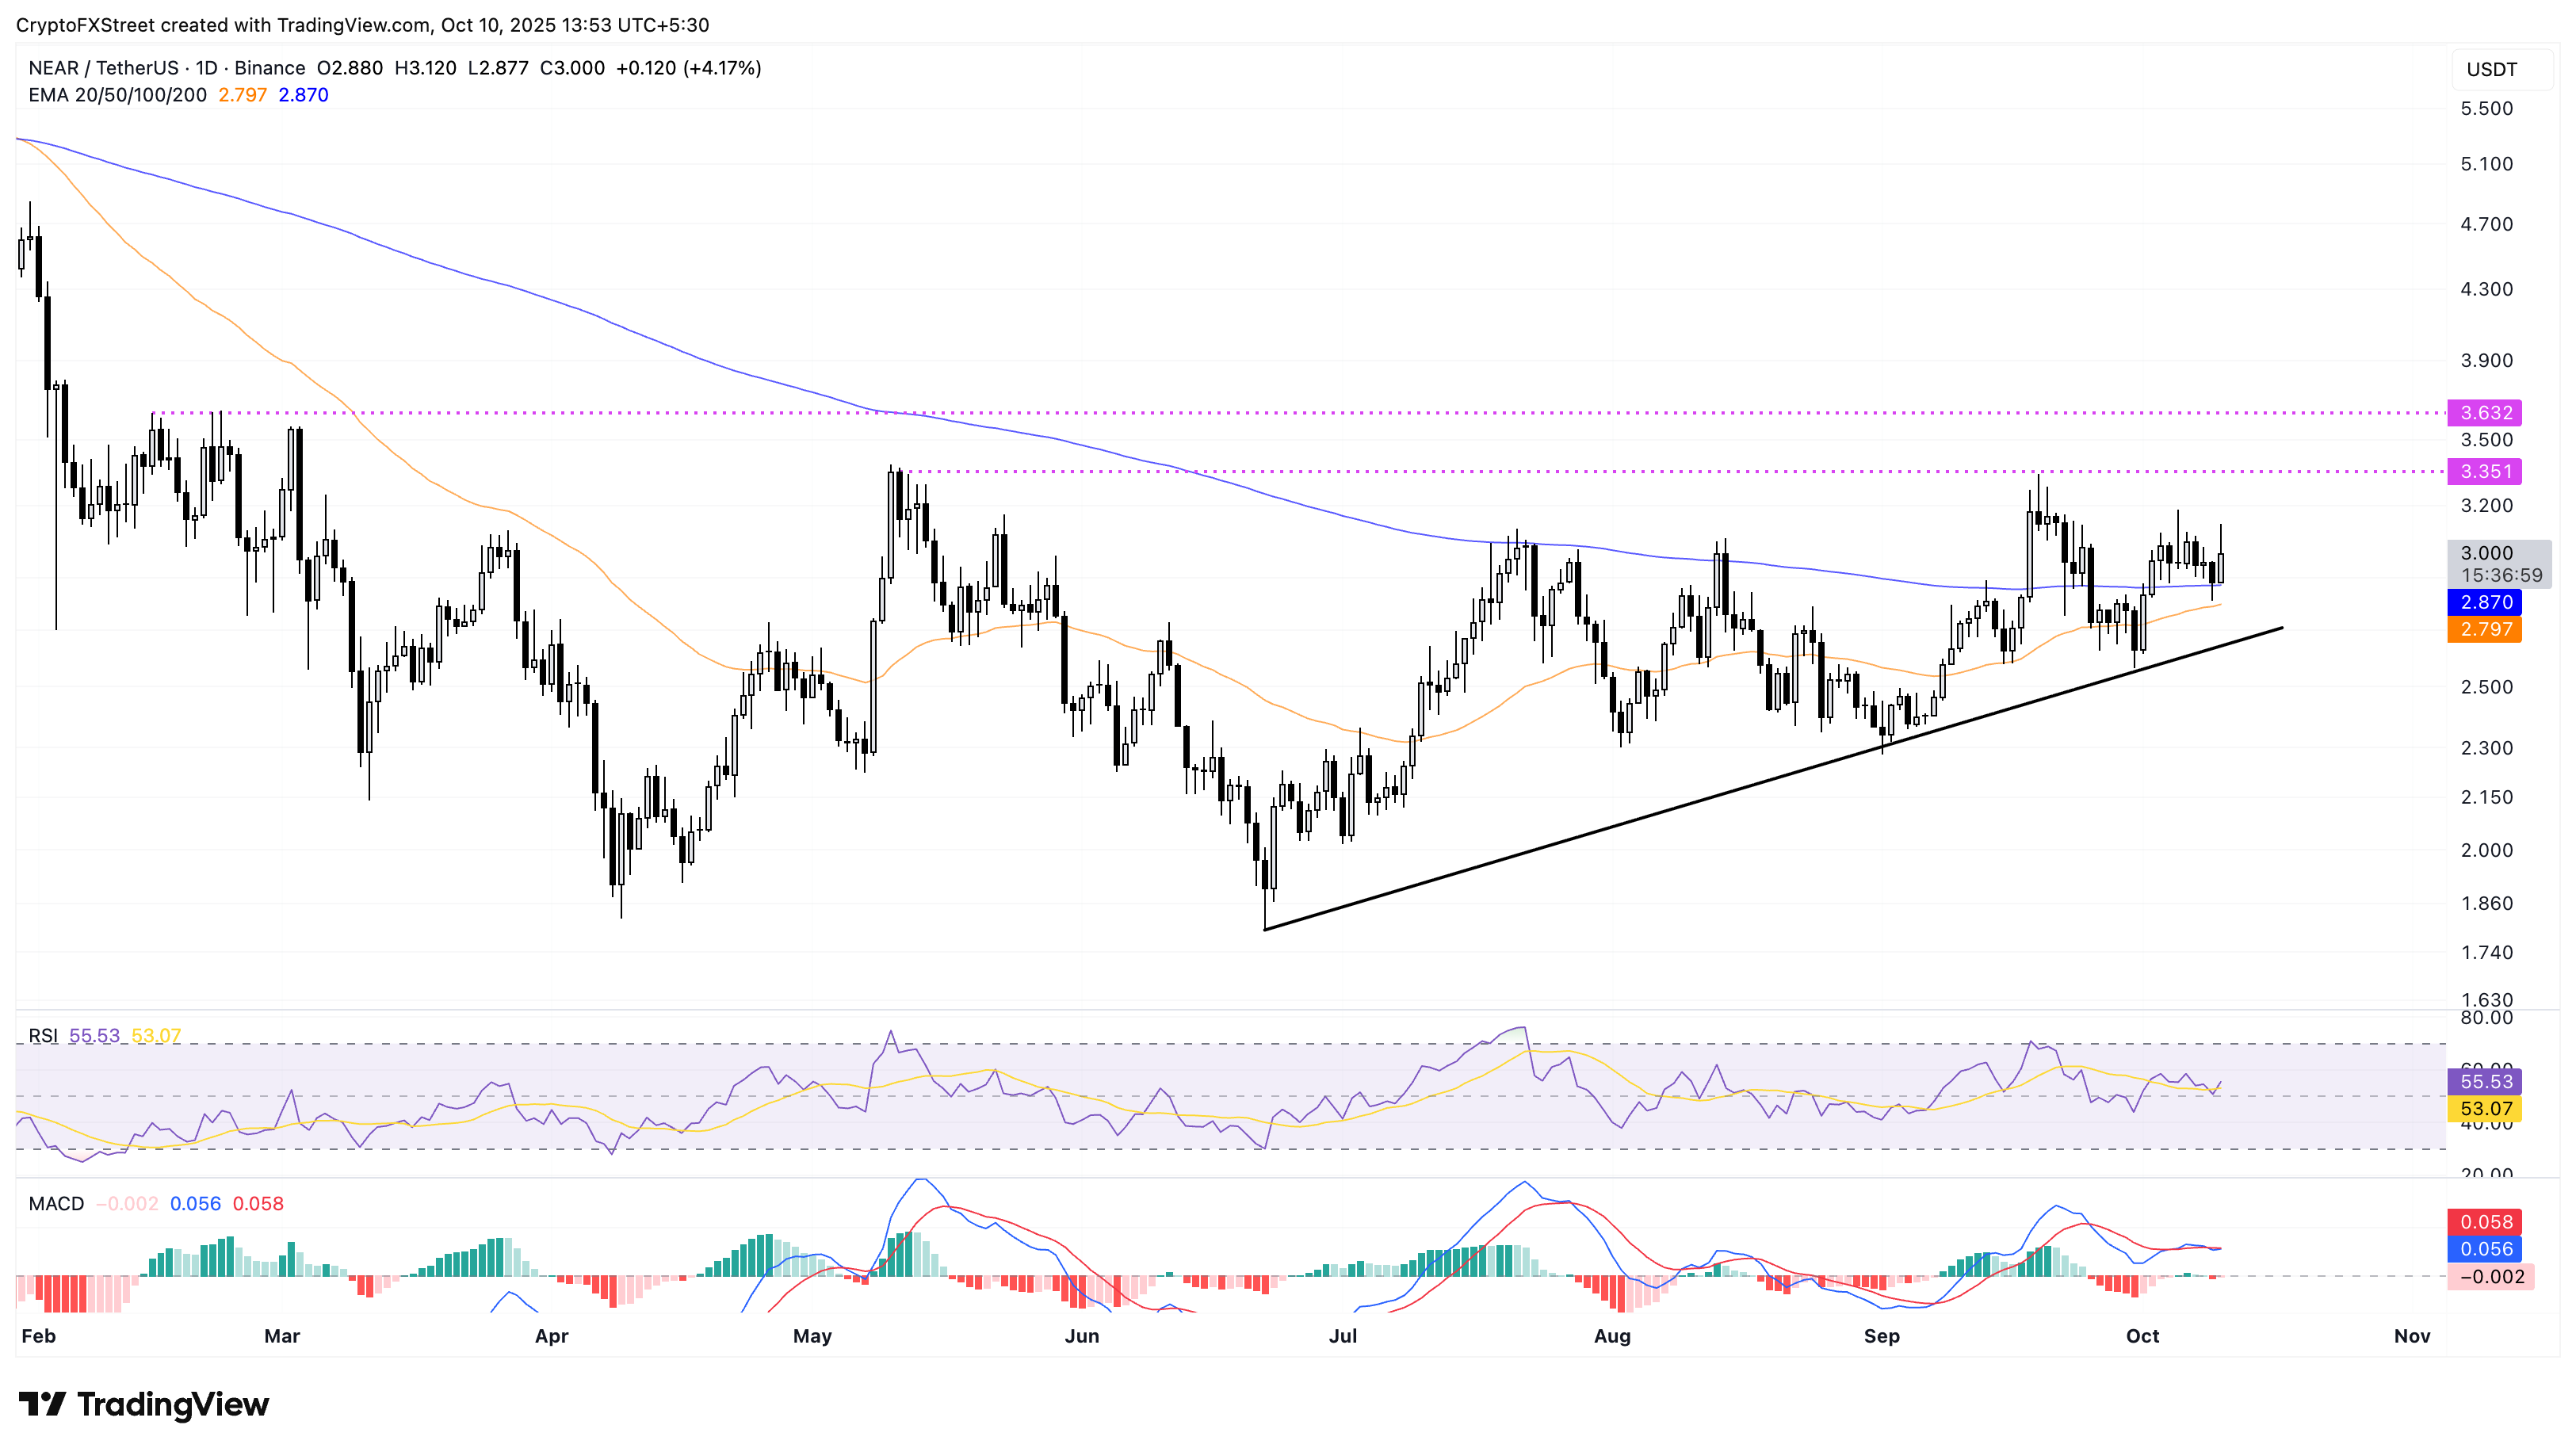
NEAR/USDT daily price chart.
If NEAR fails to hold the above 200-day EMA at $2.870, then the 50-day EMA at $2.796 and the $2.500 round figure could act as support levels.
Recommended Articles


