
BNB Price Forecast: Bulls are setting new record highs, no signs of slowdown
- BNB price reaches a new all-time high above $1,200 on Monday after rallying more than 17% last week.
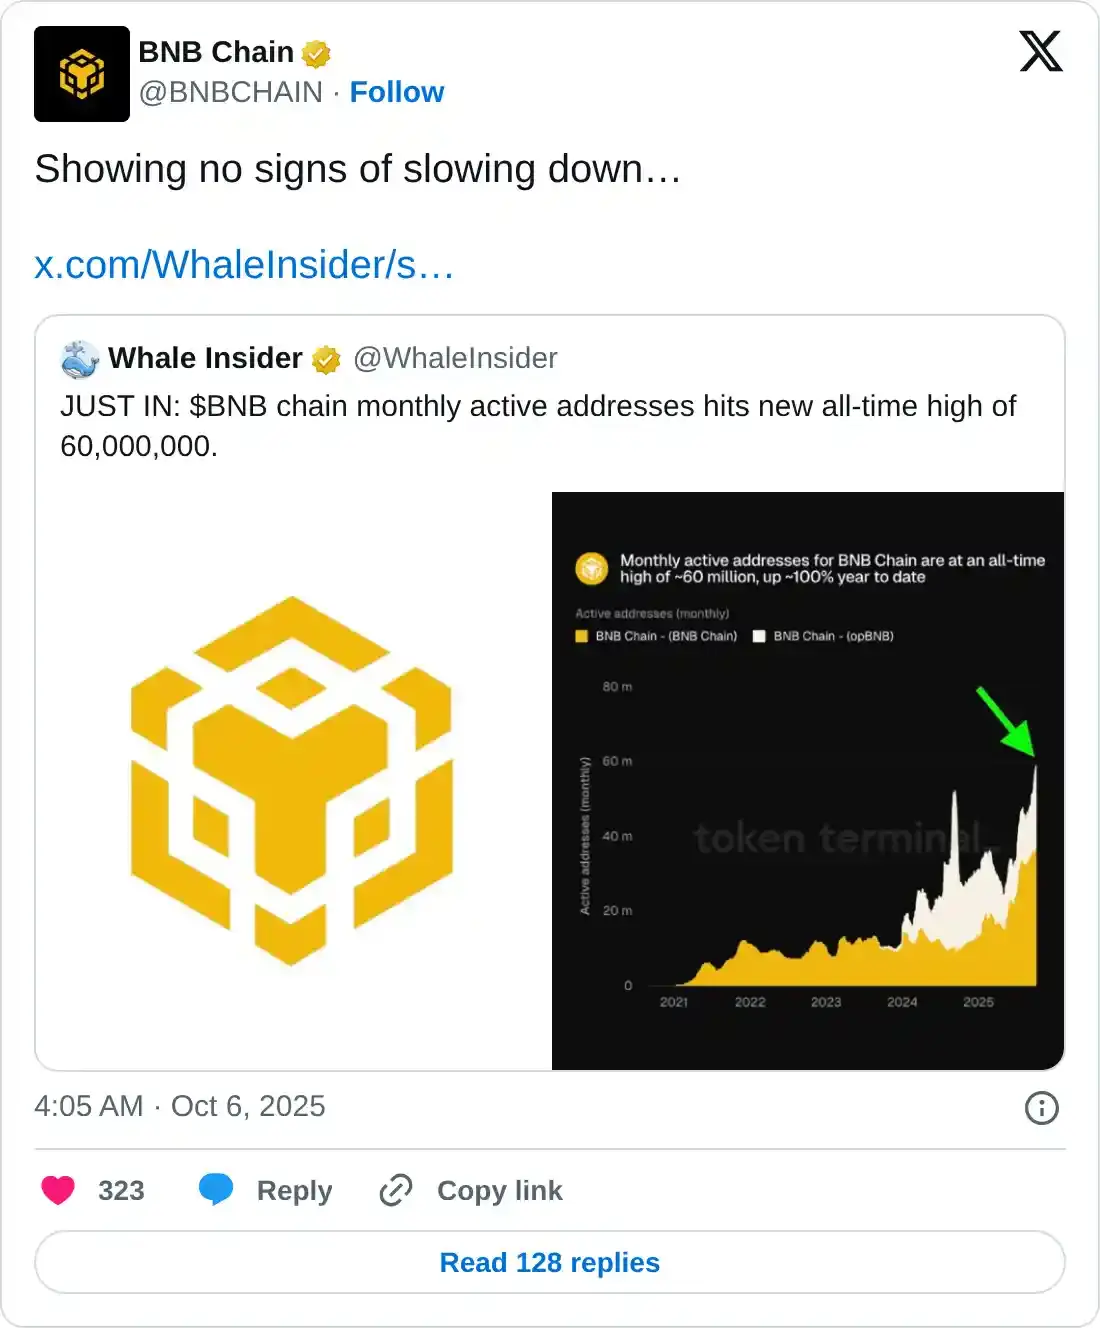
- Monthly active addresses reach a record high of 60 million, representing a 100% year-to-date increase.
- The technical outlook suggests rally continuation with bulls targeting $1,300 BNB.
BNB (BNB), formerly known as Binance Coin, sets a new all-time high above $1,200 on Monday, extending last week’s 17% rally. Strong network growth, reflected in record monthly active addresses, and a bullish technical setup suggest that investors could push BNB toward the next target at $1,300.
BNB active monthly addresses hit 60 million, doubling year to date
BNB Chain monthly active addresses surges to an all-time high of 60 million, doubling year-to-date and highlighting the network’s robust growth and rising adoption.
Apart from growing active addresses, BNB’s Total Value Locked (TVL) also rises from $7.58 billion on September 27 to $8.69 billion on Monday, the highest level since May 2022. Rising TVL indicates growing activity and interest within BNB’s ecosystem, suggesting that more users are depositing or utilizing assets within BNB-based protocols.
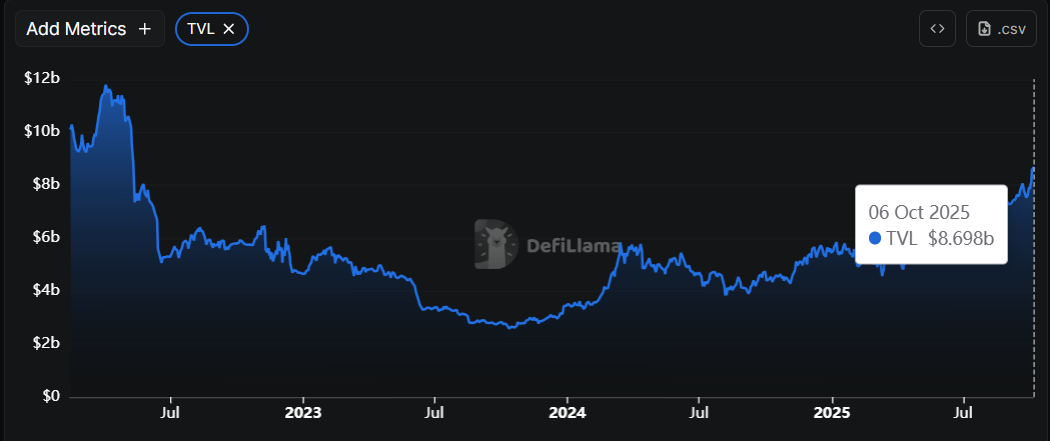
BNB TVL chart. Source: DefiLlama
Additionally, CoinGlass’ data show that the futures’ Open Interest (OI) in BNB at exchanges reaches a new all-time high of $2.57 billion on Monday. An increasing OI represents new or additional money entering the market and new buying, which could fuel the current BNB price rally.
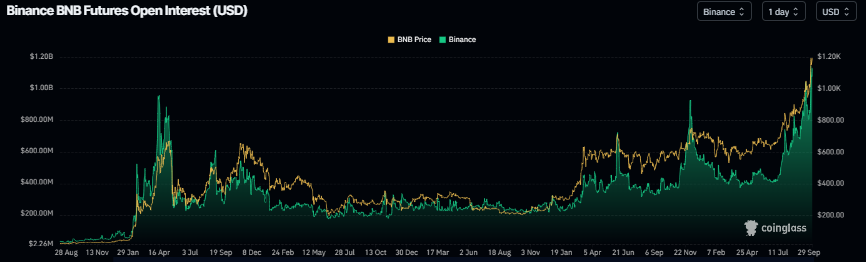
BNB open interest chart. Source: Coinglass
BNB Price Forecast: How high can BNB go?
BNB rebounded after testing a key support around the 61.8% Fibonacci retracement level, drawn from the August 3 low of $730.01 to the September 21 high of $1,083.47, at $948.45 on September 26 and rallied over 24% in the next 6 days, setting a record high of $1,192 on Friday. BNB declined slightly during the weekend. At the time of writing on Monday, BNB extends its gains, setting a new all-time high above $1,200.
If BNB continues its upward momentum, it could extend the rally toward the 141.4% Fibonacci extension level at $1,229.80. A successful close above this level could extend the gains toward the 161.80% Fibonacci extension level at $1,301.91.
The Relative Strength Index (RSI) on the daily chart reads 71, above overbought conditions and pointing upward, suggesting strong bullish momentum. Moreover, the Moving Average Convergence Divergence (MACD) showed a bullish crossover last week. Additionally, the rising green histogram bars above the neutral level further indicate a bullish momentum and continuation of an upward trend.
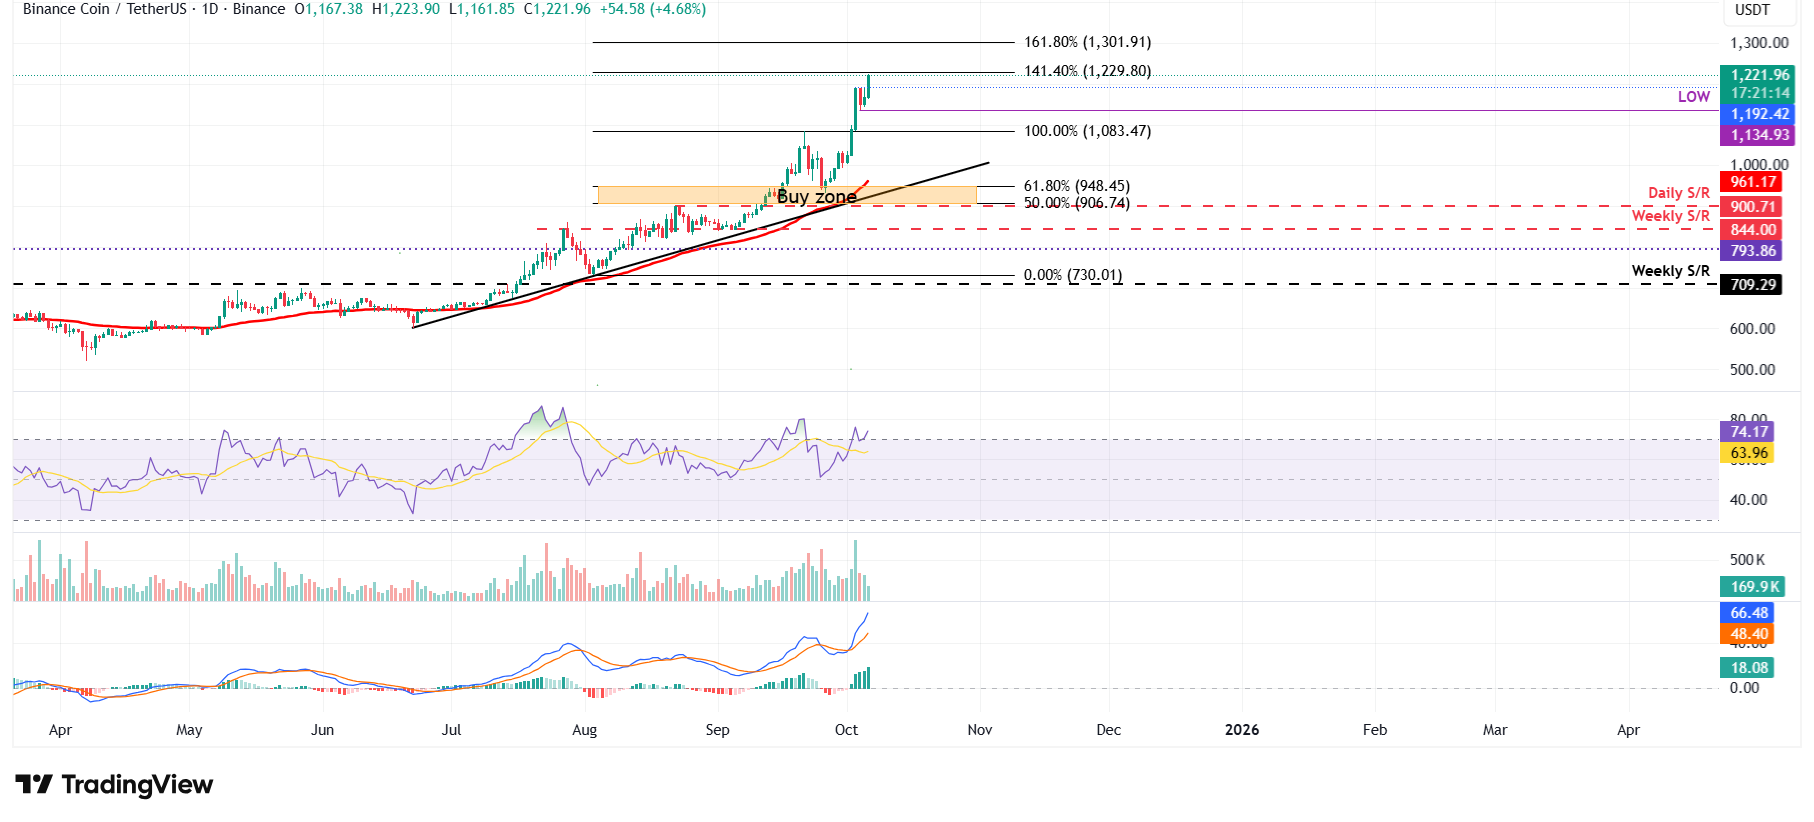
BNB/USDT daily chart
However, if BNB faces a correction, it could extend the decline to find support at Saturday’s low of $1,134.93.
Recommended Articles


