

Ethereum Price Lags Below $4,000—Support Levels To Watch

Source Newsbtc

The Ethereum price has been one of the best performers in the cryptocurrency market in the third quarter, reaching a new all-time high at the end of August. However, the second-largest cryptocurrency has struggled to build on this record-setting momentum in September.

With September and the third quarter of 2025 almost done, the Ethereum price appears to be struggling to reclaim the psychological $4,000 support level. Below are the critical support levels to watch for should a deeper correction occur, according to the latest on-chain data.

Is $3,500 The Next Stop For ETH Price?

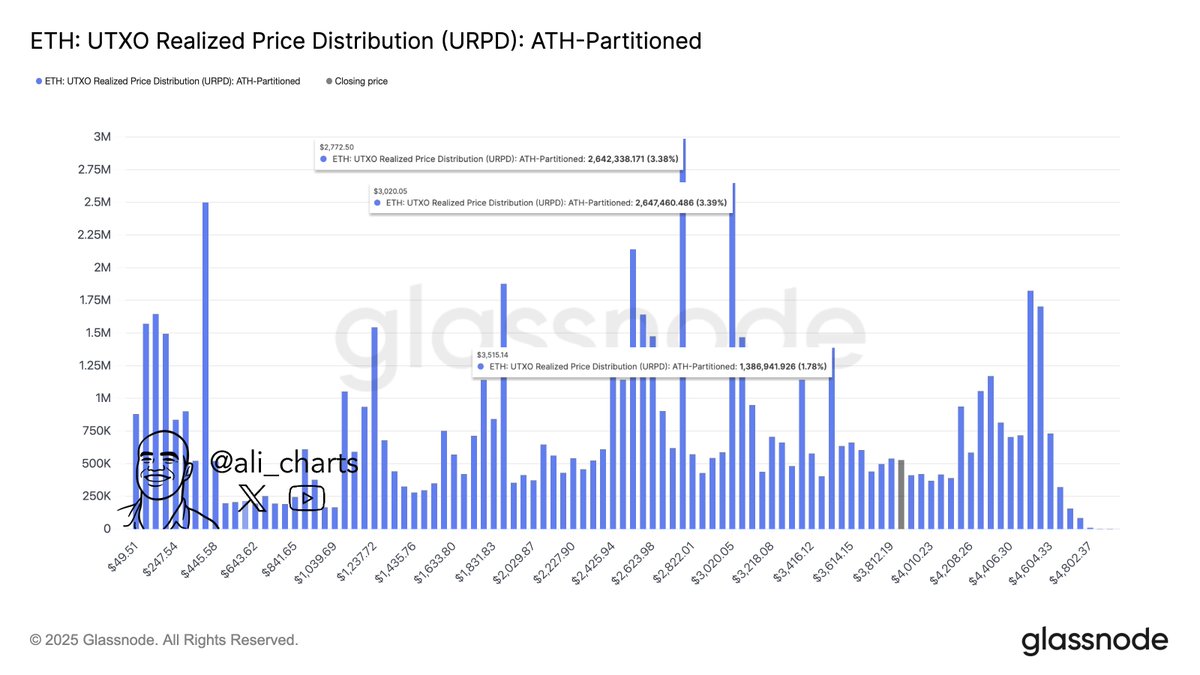
In a September 27 post on the X platform, popular crypto analyst Ali Martinez identified three major support levels to watch if the Ethereum price further declines over the next few weeks. This on-chain observation revolves around the UTXO Realized Price Distribution (URPD) metric, which estimates the amount of a specific cryptocurrency acquired at a certain price level.

This indicator looks at a price level’s capacity to act as an on-chain support or resistance zone, which typically depends on the number of investors with their cost basis at the given level. An investor’s cost basis refers to the original price at which they bought a crypto asset (Ether, in this scenario).

Based on the cost basis theory, major support zones are often around price levels—with significant buying activity—below the current spot value. Having purchased their assets at these prices, several investors tend to double down and purchase more assets when the price returns to their cost basis, thereby keeping the prices afloat.
Ethereum Price

According to data highlighted by Martinez, the next major support levels for the Ethereum price lie around $3,515, $3,020, and $2,772. As observed in the chart below, if the price of ETH doesn’t have a sustained close above $4,000, its next immediate support cushion is around $,3,515, where nearly 1.39 billion coins were purchased.  

In a case where the “king of altcoins” fails to stop bleeding, the UTXO Realized Price Distribution metric shows that the next major support is at $3,020, where almost 2.65 billion coins were bought. Now, the last significant support for the Ethereum price lies around $2,772, which is the cost basis of more than 2.64 billion Ether tokens.

Ethereum Price At A Glance

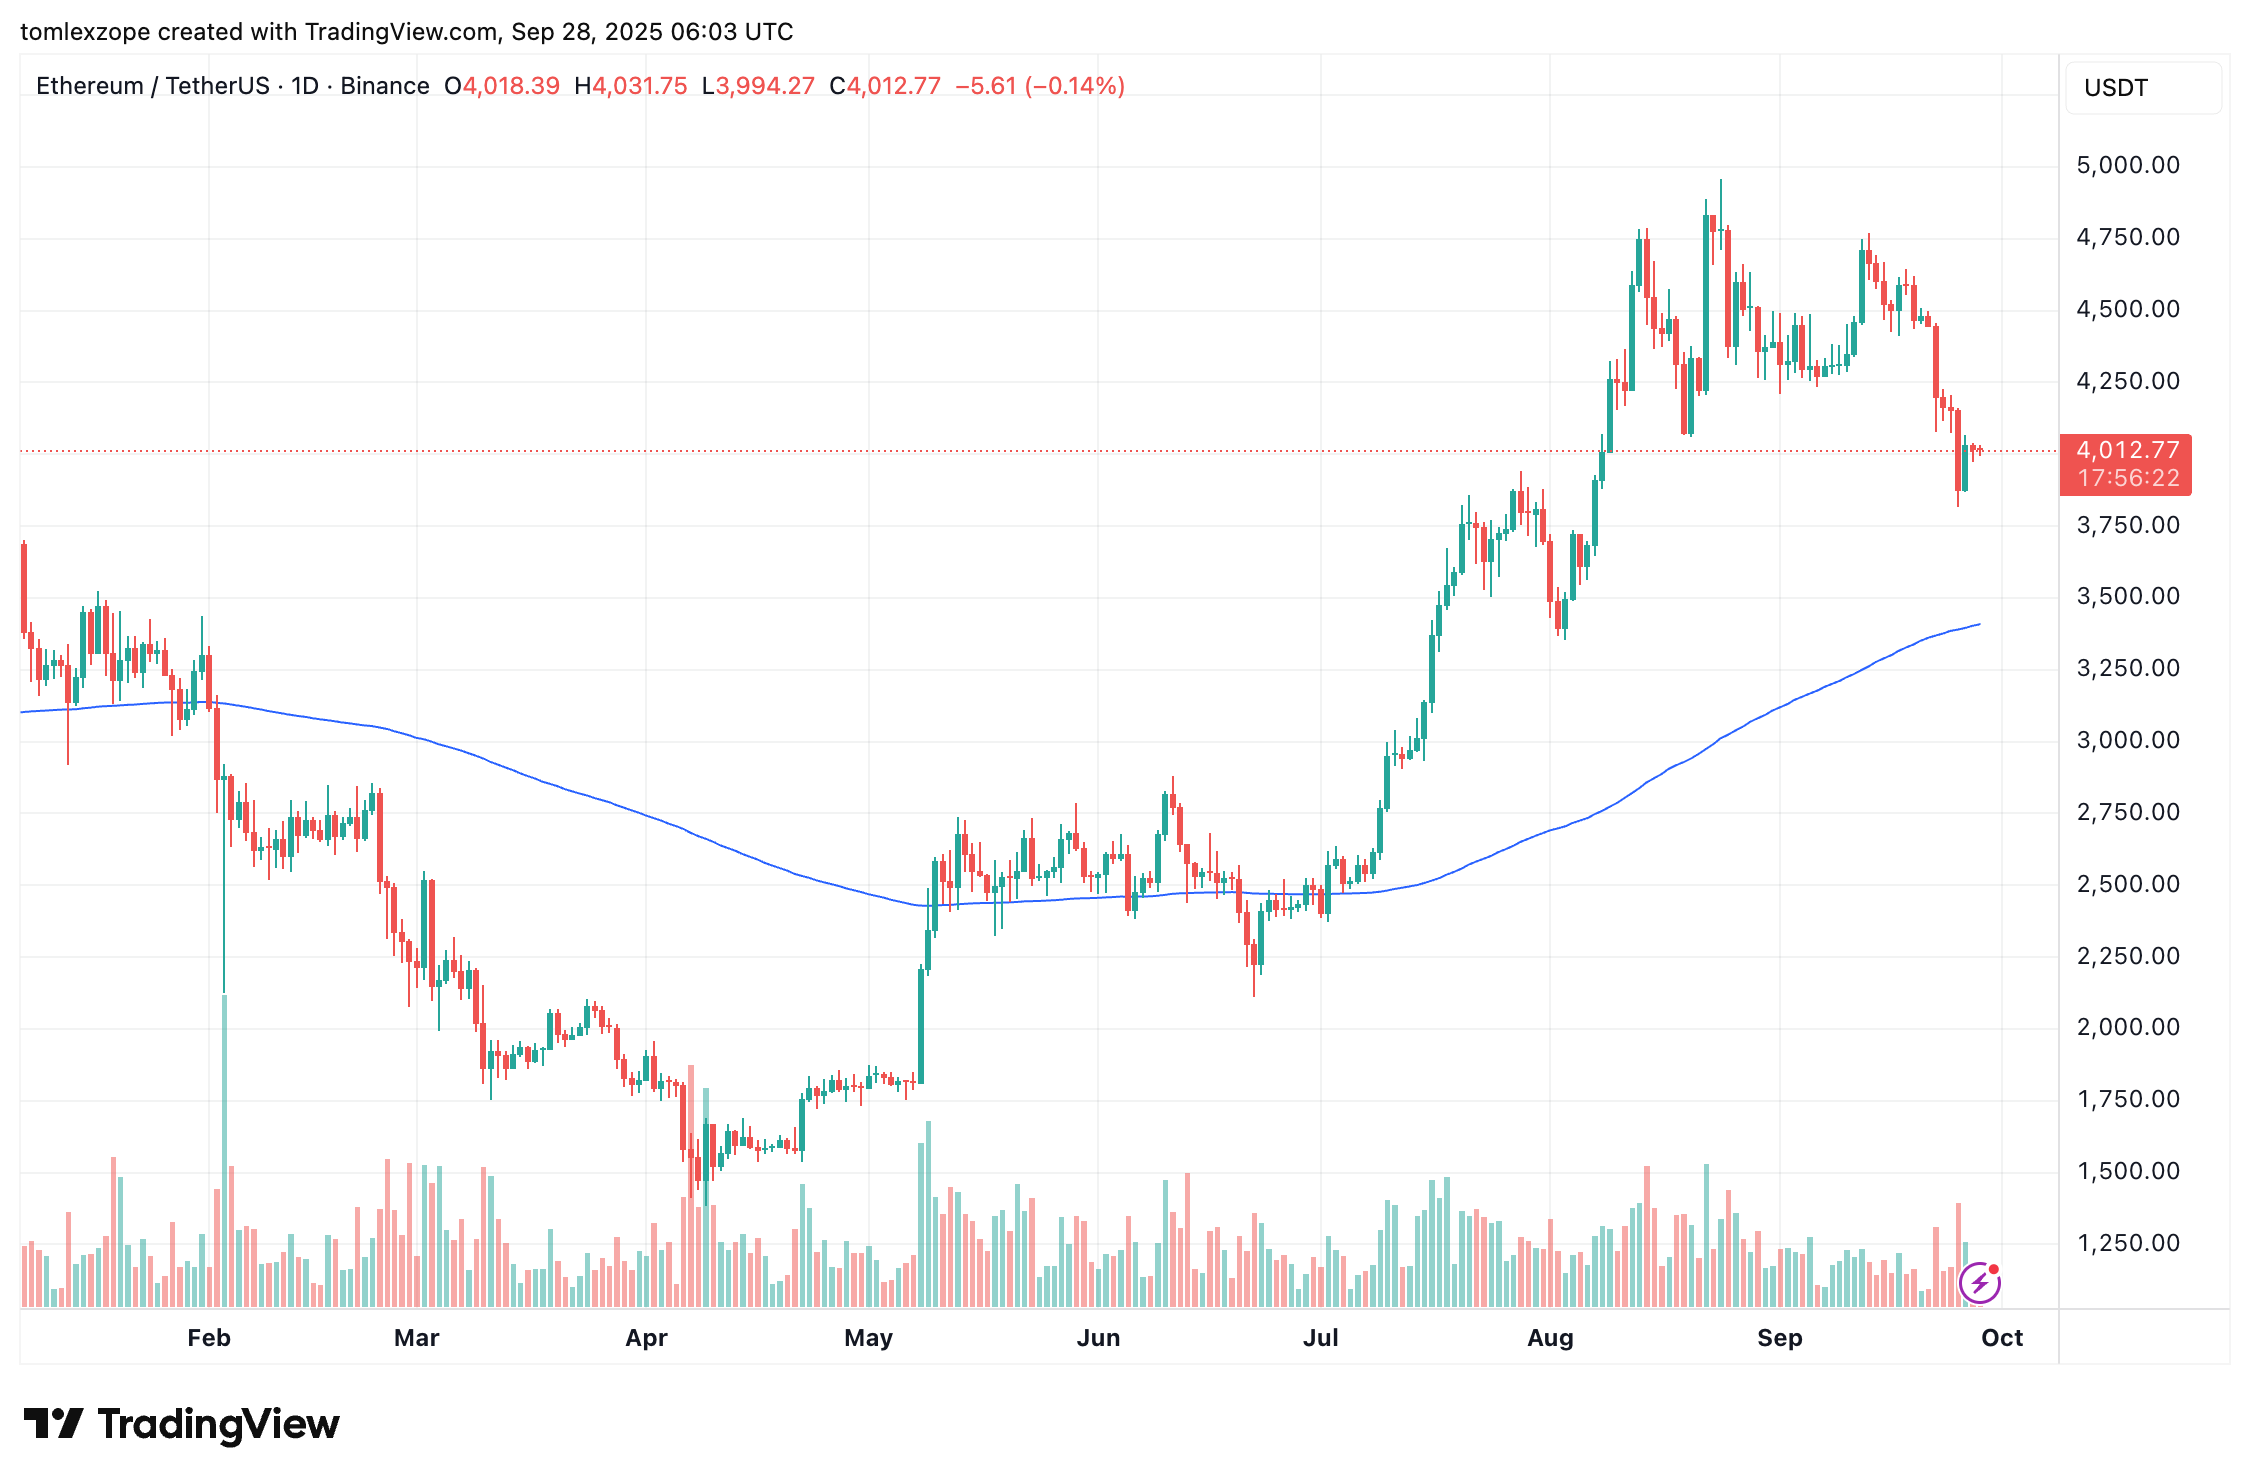
As of this writing, the price of ETH stands at around $3,994, reflecting no significant movement in the past 24 hours. While the largest altcoin by market cap seems to be hanging on to the major $4,000 level, its performance over the past week is still quite worrying. According to data from CoinGecko, the Ethereum price is down by more than 10% in the last seven days.
Ethereum price

Featured image from Shutterstock, chart from TradingView

Disclaimer: For information purposes only. Past performance is not indicative of future results.
placeholder
US August CPI lands tonight: after a 5.4% PPI shock, will the Fed hike on September 16?US August PPI came in at 5.4% year-on-year, above the 5.3% consensus, with core PPI at 4.6%. Traders have pushed the odds of a 25bp Fed hike on September 15-16 to around 70%. Tonight's CPI is the last major inflation print before the decision — here is the full calendar, the consensus numbers, and what a hot versus cool reading would mean for the dollar, yields, gold and stocks.
Author  Irene Q.
Sep 11, Fri
US August PPI came in at 5.4% year-on-year, above the 5.3% consensus, with core PPI at 4.6%. Traders have pushed the odds of a 25bp Fed hike on September 15-16 to around 70%. Tonight's CPI is the last major inflation print before the decision — here is the full calendar, the consensus numbers, and what a hot versus cool reading would mean for the dollar, yields, gold and stocks.
placeholder
Brent tests $108 as a key export pipeline stays shut — can the rally clear $110?Brent crude rose 2.55% to $106.97 and WTI 2.32% to $102.30 as a major regional export pipeline remained offline with no restart timeline. Front-month backwardation has widened to $5.53 from $3.84 a week ago, European gas is at its highest since December 2022, and one analyst sees $119.48 if talks stall.
Author  Irene Q.
Sep 14, Mon
Brent crude rose 2.55% to $106.97 and WTI 2.32% to $102.30 as a major regional export pipeline remained offline with no restart timeline. Front-month backwardation has widened to $5.53 from $3.84 a week ago, European gas is at its highest since December 2022, and one analyst sees $119.48 if talks stall.
placeholder
Fed hike odds near 90% into Wednesday's decision — how to trade the dollar, gold and the S&P 500A 0.3% monthly core CPI print has lifted the market-implied probability of a 25bp Fed hike on 16 September to roughly 86.5% ~ 90%, which would be the first increase since July 2023. Here is the decision timeline, the pricing versus the forecasts, both scenarios, and the key levels for the dollar, gold and the S&P 500.
Author  Suzie
Sep 14, Mon
A 0.3% monthly core CPI print has lifted the market-implied probability of a 25bp Fed hike on 16 September to roughly 86.5% ~ 90%, which would be the first increase since July 2023. Here is the decision timeline, the pricing versus the forecasts, both scenarios, and the key levels for the dollar, gold and the S&P 500.
placeholder
Gold falls below $4,300 as higher US yields bolster Fed rate hike betsGold price (XAU/USD) tumbles to near $4,295 during the early Asian session on Tuesday. The precious metal faces some selling pressure as rising bond yields and surging energy prices strengthen expectations that the US Federal Reserve (Fed) will raise interest rates this week. 
Author  FXStreet
Yesterday 01: 23
Gold price (XAU/USD) tumbles to near $4,295 during the early Asian session on Tuesday. The precious metal faces some selling pressure as rising bond yields and surging energy prices strengthen expectations that the US Federal Reserve (Fed) will raise interest rates this week. 
placeholder
【Daily Brief】10-year Treasury yield briefly tops 5%, S&P 500 slips to 7,602 and the dollar firms at 99.3 as the Fed's decision eve beginsThe 10-year Treasury yield touched 5.014% on Monday — its first print above 5% since October 2023 — while the S&P 500 closed 0.48% lower at 7,619.98 and the dollar index firmed to 99.3. Here is the full market wrap ahead of Wednesday's FOMC decision, the dot plot and the August retail sales report, plus today's CLARITY Act Senate vote.
Author  Irene Q.
20 hours ago
The 10-year Treasury yield touched 5.014% on Monday — its first print above 5% since October 2023 — while the S&P 500 closed 0.48% lower at 7,619.98 and the dollar index firmed to 99.3. Here is the full market wrap ahead of Wednesday's FOMC decision, the dot plot and the August retail sales report, plus today's CLARITY Act Senate vote.
goTop
quote