


Stellar Price Forecast: XLM falls more than 6% despite SEC's approval of Hashdex ETF
- Stellar price tumbles more than 6%, nearing a key support zone that could determine its next move.
- The US SEC approved Hashdex Nasdaq Crypto Index US ETF, offering exposure to Bitcoin, Ether, XRP, Solana, and Stellar.
- The technical outlook signals a potential rebound as bullish bets among traders increase.
Stellar (XLM) price stabilizes around $0.354 at the time of writing on Friday, after slipping more than 6% on Thursday. This drop occurred despite the US Securities and Exchange Commission (SEC) approval of the Hashdex Nasdaq Crypto Index US Exchange Traded Fund (ETF), which provides exposure to major cryptocurrencies, including Stellar. Despite the short-term weakness, XLM is approaching a crucial support level that could trigger a rebound, with technical signals suggesting growing bullish interest among traders.
Approval of the first multi-asset spot crypto ETP in the US
Hashdex Asset Management Ltd. (Hashdex), a leading global crypto asset manager, and Nasdaq Global Indexes announced on Thursday that the Hashdex Nasdaq Crypto Index US ETF (NCIQ) will expand the product to include Ripple (XRP), Solana (SOL), and Stellar (XLM).
The expansion follows US SEC approval, which permits the ETF to hold assets beyond Bitcoin and Ethereum under the regulator’s new generic listing standards. With the three additional assets, Hashdex can now give investors broader exposure to the crypto market.
“The expansion of the NCIQ will now provide investors access to Bitcoin, Ether, XRP, Solana, and Stellar all in one product, giving investors an easier way to participate in a fast-growing crypto industry,” said Marcelo Sampaio, Co-Founder and CEO of Hashdex.
Despite the 6% drop in XLM price on Thursday, the SEC’s approval of the Hashdex Nasdaq Crypto Index US ETF could support long-term growth by increasing investor exposure to Stellar’s native token.
Apart from XLM’s inclusion in the NCIQ ETF, Stellar’s ecosystem is also expanding. Last week, PayPal launched its stablecoin, PayPal USD (PYUSD), on the Stellar network, underscoring the blockchain’s growing adoption in real-world payments.
On the derivatives side, Stellar shows some signs of recovery. Coinglass’s long-to-short ratio for XLM is one and is rising, indicating that traders are betting on the asset price to rise.
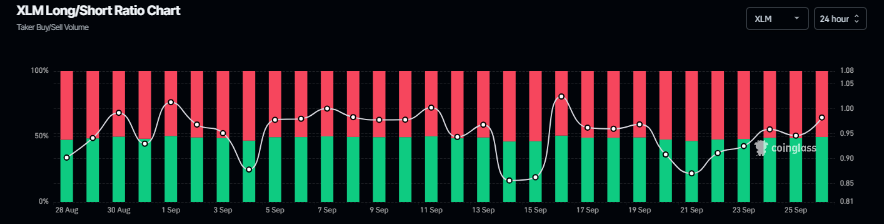
XLM long-to-short ratio chart. Source: Coinglass
Stellar Price Forecast: XLM nears key support
Stellar price faced rejection from the upper trendline of the falling wedge pattern on September 18 and declined by 11.5% by Thursday. At the time of writing on Friday, it trades around $0.354.
Suppose XLM finds support around the 200-day Exponential Moving Average at $0.340, which roughly coincides with the weekly support at $0.331. XLM could extend the recovery toward the upper trendline boundary around $0.381.
The Relative Strength Index (RSI) on the daily chart reads 39, below the neutral level of 50, indicating bearish momentum. For the recovery rally to be sustained, the RSI must move above the neutral level.
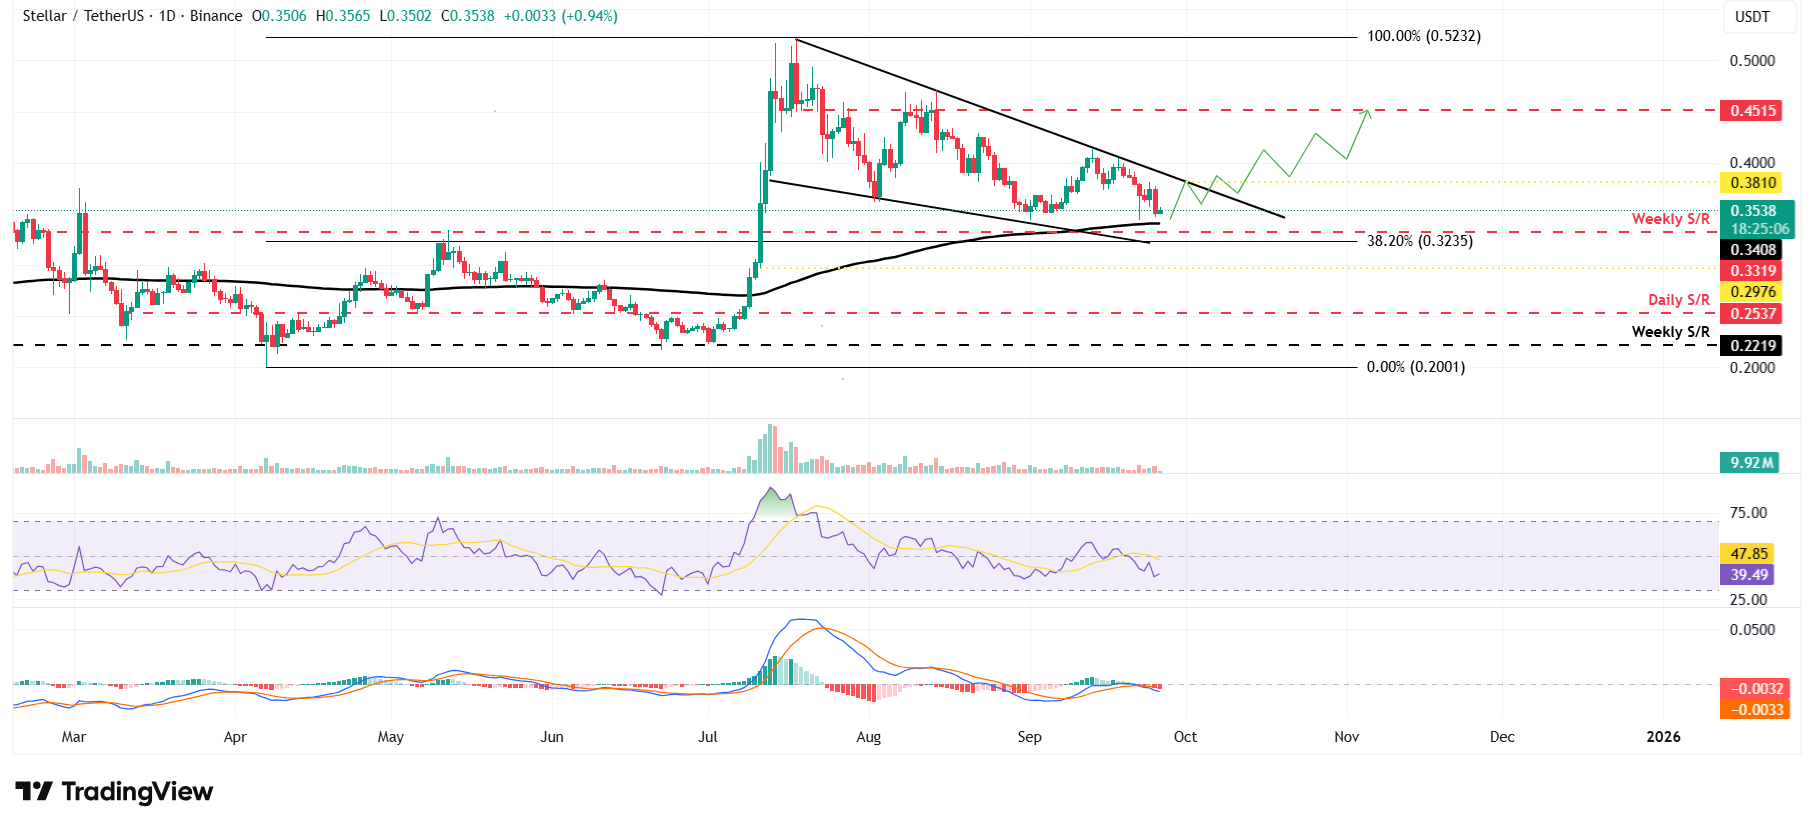
XLM/USDT daily chart
However, if XLM fails to find support around the weekly level at $0.331, it could extend the decline toward the July 11 low of $0.297.
Recommended Articles


