Here’s The Boundary Bitcoin Bulls Must Defend To Save Rally

Source Newsbtc

On-chain analytics firm Glassnode has revealed where a Bitcoin level historically seen as a key battleground between bulls and bears currently lies.

Bitcoin Short-Term Holder Cost Basis Is Situated At $111,400 Right Now

In a new post on X, Glassnode has talked about the Bitcoin Realized Price of the short-term holders. The “Realized Price” is an on-chain indicator that measures, in short, the average cost basis or acquisition level of the average investor on the BTC network.

When the spot price of the cryptocurrency is trading above this metric, it means the holders as a whole are sitting on some net unrealized profit. On the other hand, being under the indicator implies the overall market is underwater.

In the context of the current topic, the Realized Price of a specific part of the blockchain is of interest: the short-term holders (STHs). This cohort includes the investors who purchased their coins within the past 155 days.

Now, here is the chart shared by the analytics firm that shows the trend in the Bitcoin STH Realized Price over the last few years:

Bitcoin STH Realized Price

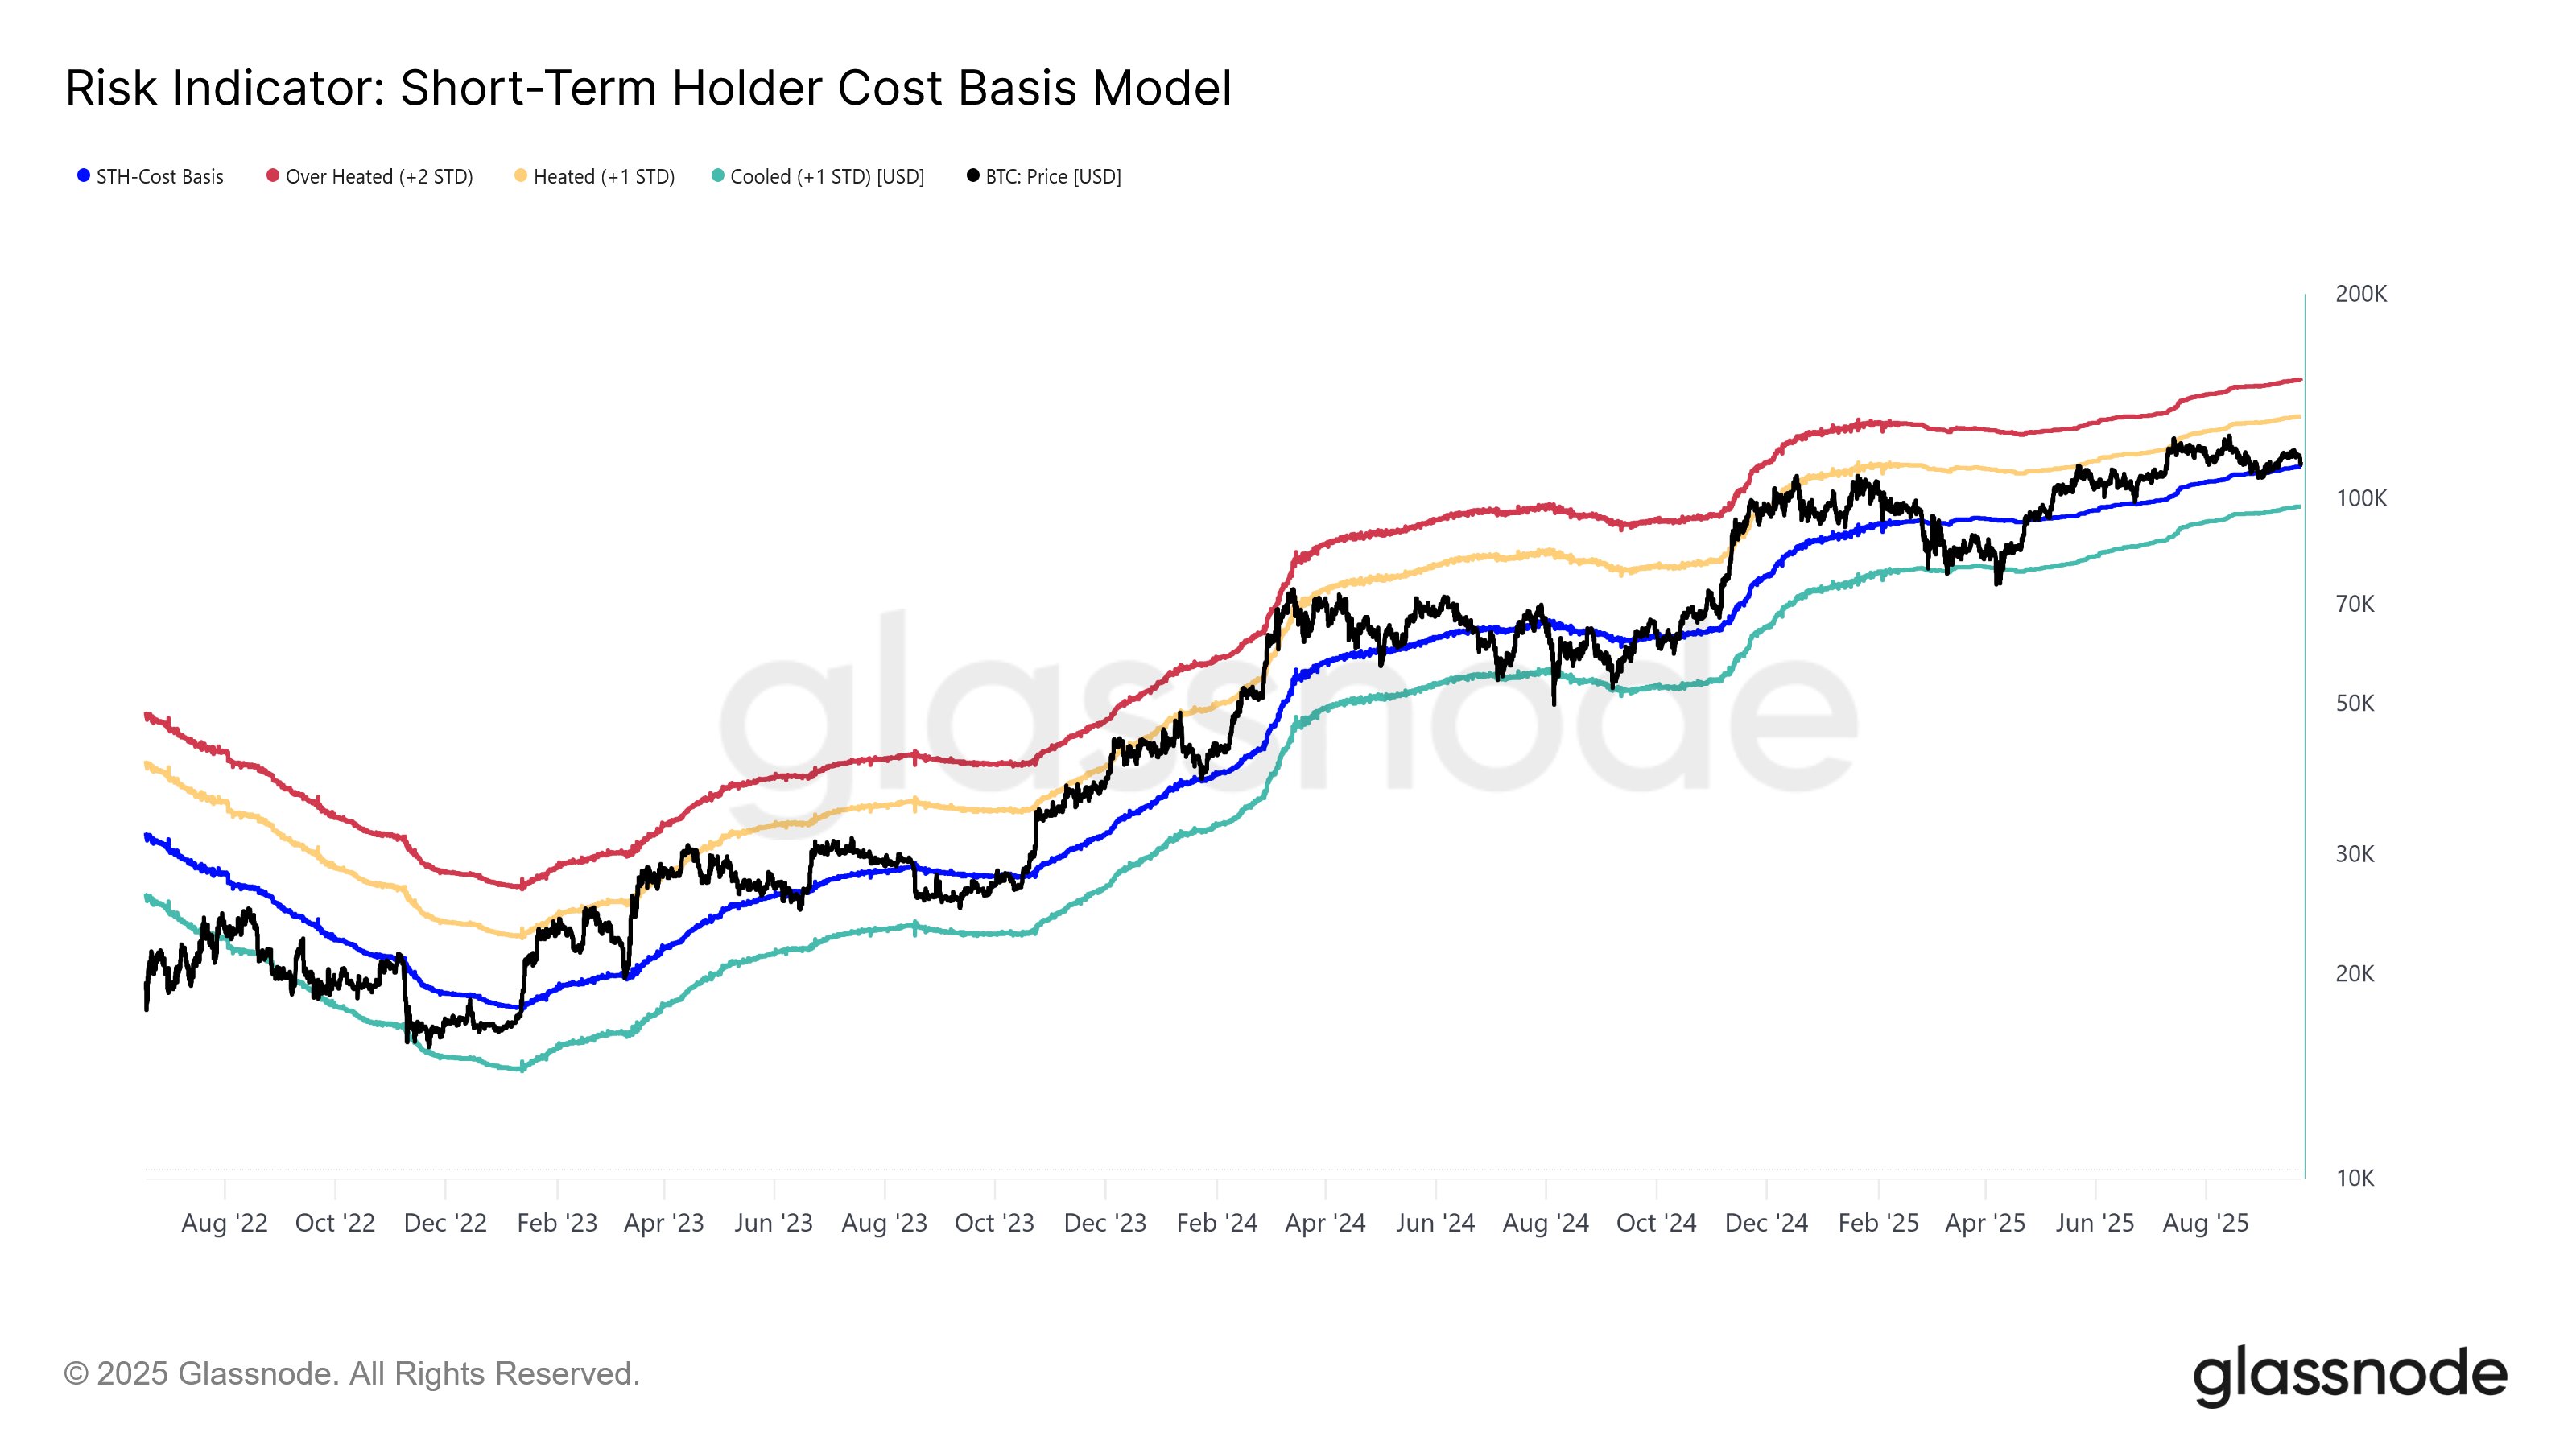
As displayed in the above graph, the Bitcoin STH Realized Price is currently sitting at $111,400, which means that the cryptocurrency’s spot price is trading quite near it.

As such, if the asset’s latest bearish momentum continues, a retest of the level could happen. Historically, BTC has had some notable interactions with the metric, with it rotating roles as both support and resistance.

The explanation behind this trend lies in the fact that STHs include the most reactive investors in the market. If the mood in the sector is bullish, these traders participate in buying on retests of their cost basis, believing the decline to be just a “dip.” Similarly, they sell at their break-even mark when the sentiment is bearish, fearing that they will drop into losses again.

When one of these patterns doesn’t hold for the indicator, it can be a sign that the market structure is shifting. In other words, which side of the line BTC is trading could have an impact on its trajectory. “The short-term holder cost basis is often treated as the key battle line between bulls & bears,” notes Glassnode.

Given the relevance that the STH Realized Price has had in the past, a retest for Bitcoin, if one happens, could be worth watching. “Sustained trading below this level could signal a shift toward a mid- to long-term bearish market structure,” explains the analytics firm.

BTC Price

Bitcoin has been unable to make any recovery since Monday’s plunge as its price is still floating around the $112,800 mark.

Bitcoin Price Chart
Disclaimer: For information purposes only. Past performance is not indicative of future results.
placeholder
A Crash After a Surge: Why Silver Lost 40% in a Week?TradingKey - Spot Silver ( XAGUSD) prices have continued to decline; on Thursday, silver plummeted as much as 20% to break below $71 per ounce, and on Friday the sell-off intensified as prices fell fu
Author  TradingKey
Feb 06, Fri
TradingKey - Spot Silver ( XAGUSD) prices have continued to decline; on Thursday, silver plummeted as much as 20% to break below $71 per ounce, and on Friday the sell-off intensified as prices fell fu
placeholder
Bitcoin is trading around $63,000, down nearly 40% from its peak near $126,000Wall Street desks are no longer talking about upside dreams. The talk right now is how far Bitcoin charts could fall if selling keeps piling up. According to data from TradingView, Bitcoin’s price now sits at a shocking $63,500, after falling from $70,000 just this morning, losing $13,000 in 6 days, and staying far below […]
Author  Cryptopolitan
Feb 06, Fri
Wall Street desks are no longer talking about upside dreams. The talk right now is how far Bitcoin charts could fall if selling keeps piling up. According to data from TradingView, Bitcoin’s price now sits at a shocking $63,500, after falling from $70,000 just this morning, losing $13,000 in 6 days, and staying far below […]
placeholder
WTI declines below $63.00 as US-Iran talks loom West Texas Intermediate (WTI), the US crude oil benchmark, is trading around $62.85 during the Asian trading hours on Friday. The WTI price declines after the United States (US) and Iran agreed to hold talks in Oman on Friday. 
Author  FXStreet
Feb 06, Fri
West Texas Intermediate (WTI), the US crude oil benchmark, is trading around $62.85 during the Asian trading hours on Friday. The WTI price declines after the United States (US) and Iran agreed to hold talks in Oman on Friday. 
placeholder
Bitcoin Surrenders $65,000 as Analysts Warn of ‘Structural’ Market BreakBitcoin plunges 11% to break $65k as analysts term the crash "structural," citing a $1 trillion market wipeout and $2.09 billion in daily liquidations.
Author  Mitrade
Feb 06, Fri
Bitcoin plunges 11% to break $65k as analysts term the crash "structural," citing a $1 trillion market wipeout and $2.09 billion in daily liquidations.
placeholder
Bitcoin Drops to $70,000. U.S. Government Refuses to Bail Out Market, End of Bull Market or Golden Pit? The U.S. government refuses to bail out Bitcoin, and with Fed rate cuts nowhere in sight, a continued downward trend to test for a bottom is likely after a brief rebound.During the mid-da
Author  TradingKey
Feb 05, Thu
The U.S. government refuses to bail out Bitcoin, and with Fed rate cuts nowhere in sight, a continued downward trend to test for a bottom is likely after a brief rebound.During the mid-da
goTop
quote