Cardano Price Forecast: ADA targets $1 as whale holdings, open interest surge

Source Fxstreet
  • Cardano extends a falling wedge breakout, with bulls targeting the $1 milestone. 
  • Large investors holding over 10 million ADA have expanded their portfolio to 18.79 billion tokens. 
  • ADA Open Interest increases, inching closer to a record high.

Cardano (ADA) struggles to surpass $0.90 at press time on Thursday following a positive week so far. The derivatives market data suggests increasing interest in Cardano as large wallet investors, also known as whales, extend their buying streak.

Whales continue to acquire more ADA

Santiment data shows that the large wallet investors with over 10 million ADA hold 18.79 billion tokens, up from 18.63 billion tokens on September 1. This increase in 16 million ADA tokens reflects a boost in risk-on sentiment of large investors, anticipating further recovery.

Even so, investors with 10,000 to 10 million ADA offload their holdings to 15.53 billion ADA, from 15.64 billion ADA in the same time period. This suggests a shakeout of medium-scale investors as Cardano struggles to uphold the bullish trend. 

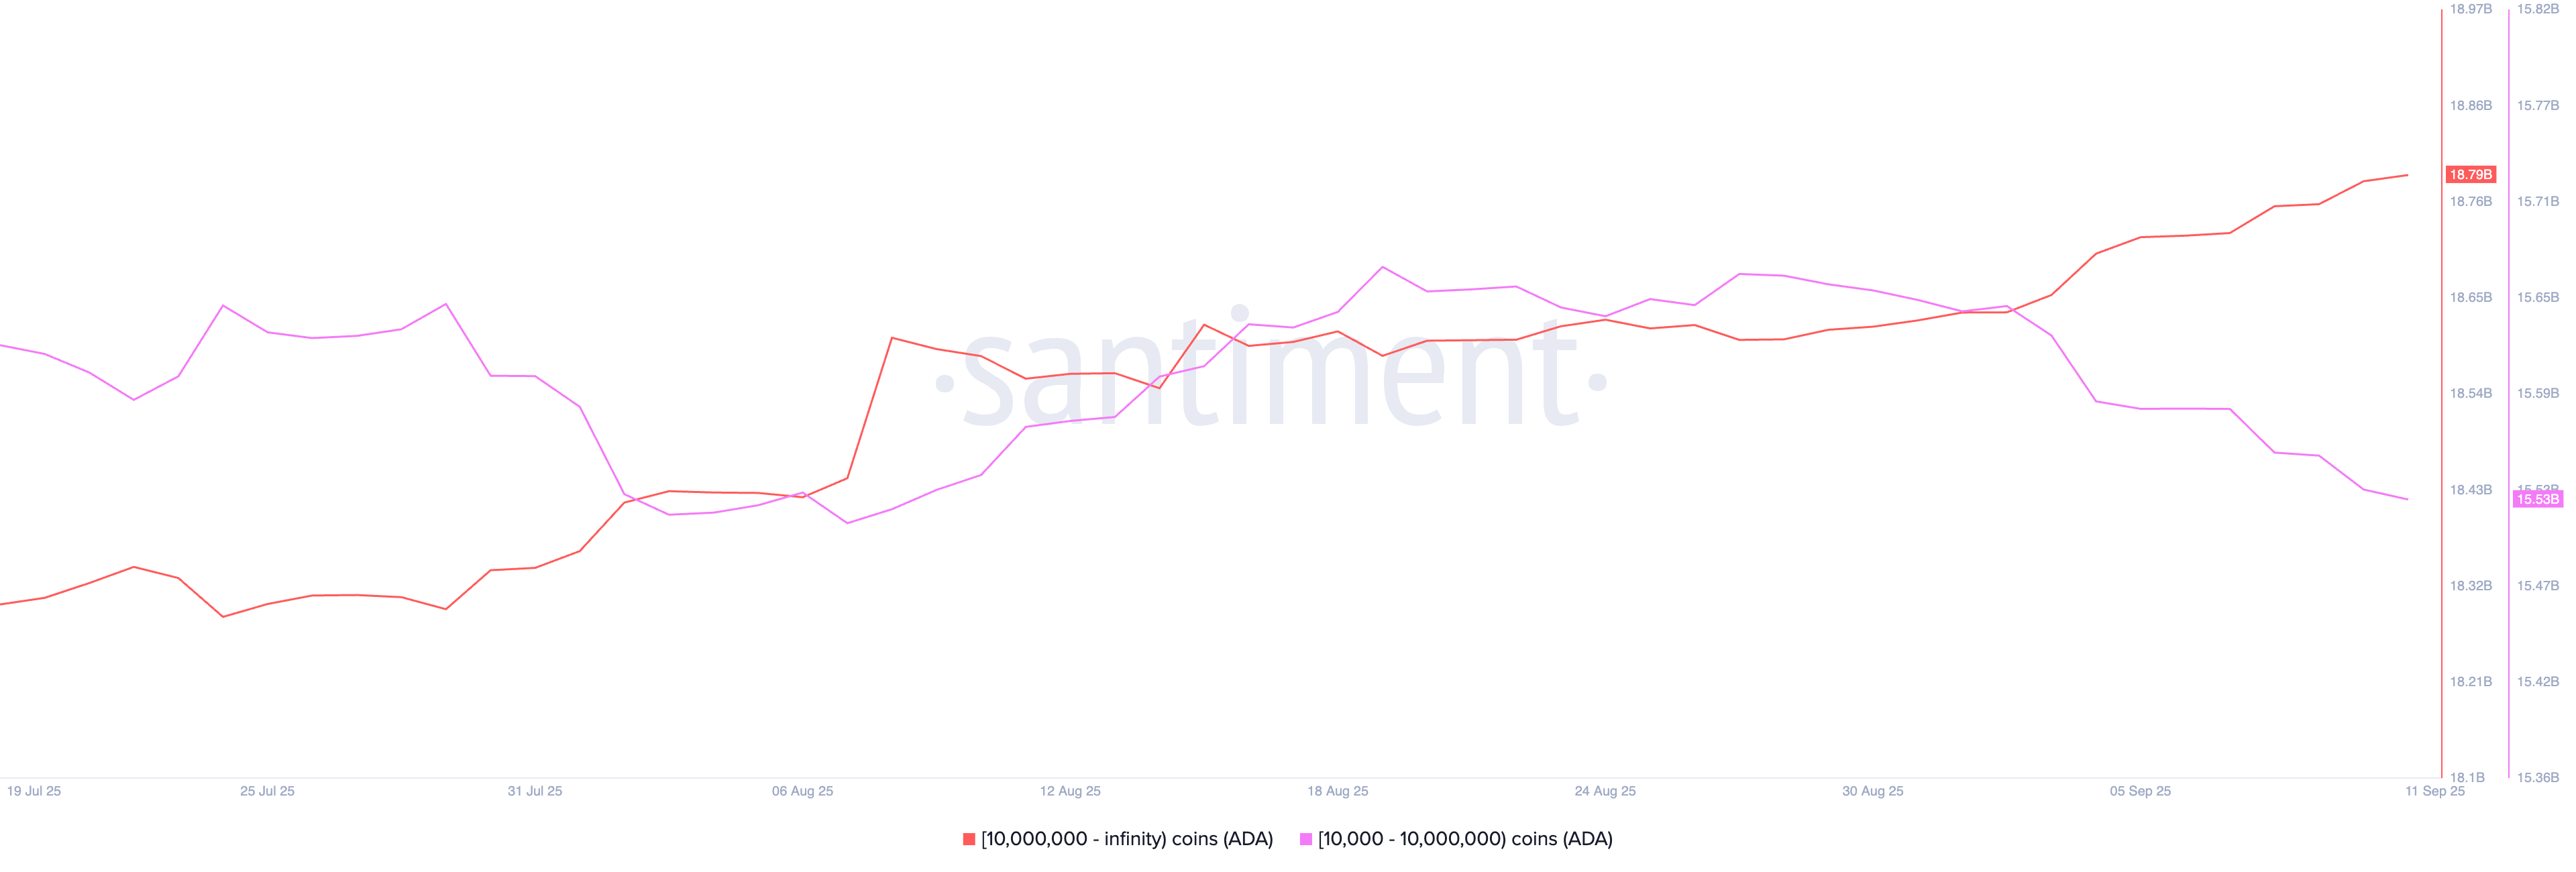
Cardano supply distribution. Source: Santiment

Open Interest surge signals bullish anticipation

CoinGlass data shows that the ADA Open Interest is rising to $1.77 billion, from $1.72 billion on Thursday. This surge in capital inflow into Cardano derivatives inches closer to its record high of $1.87 billion, suggesting a boost in risk-on sentiment among investors. 

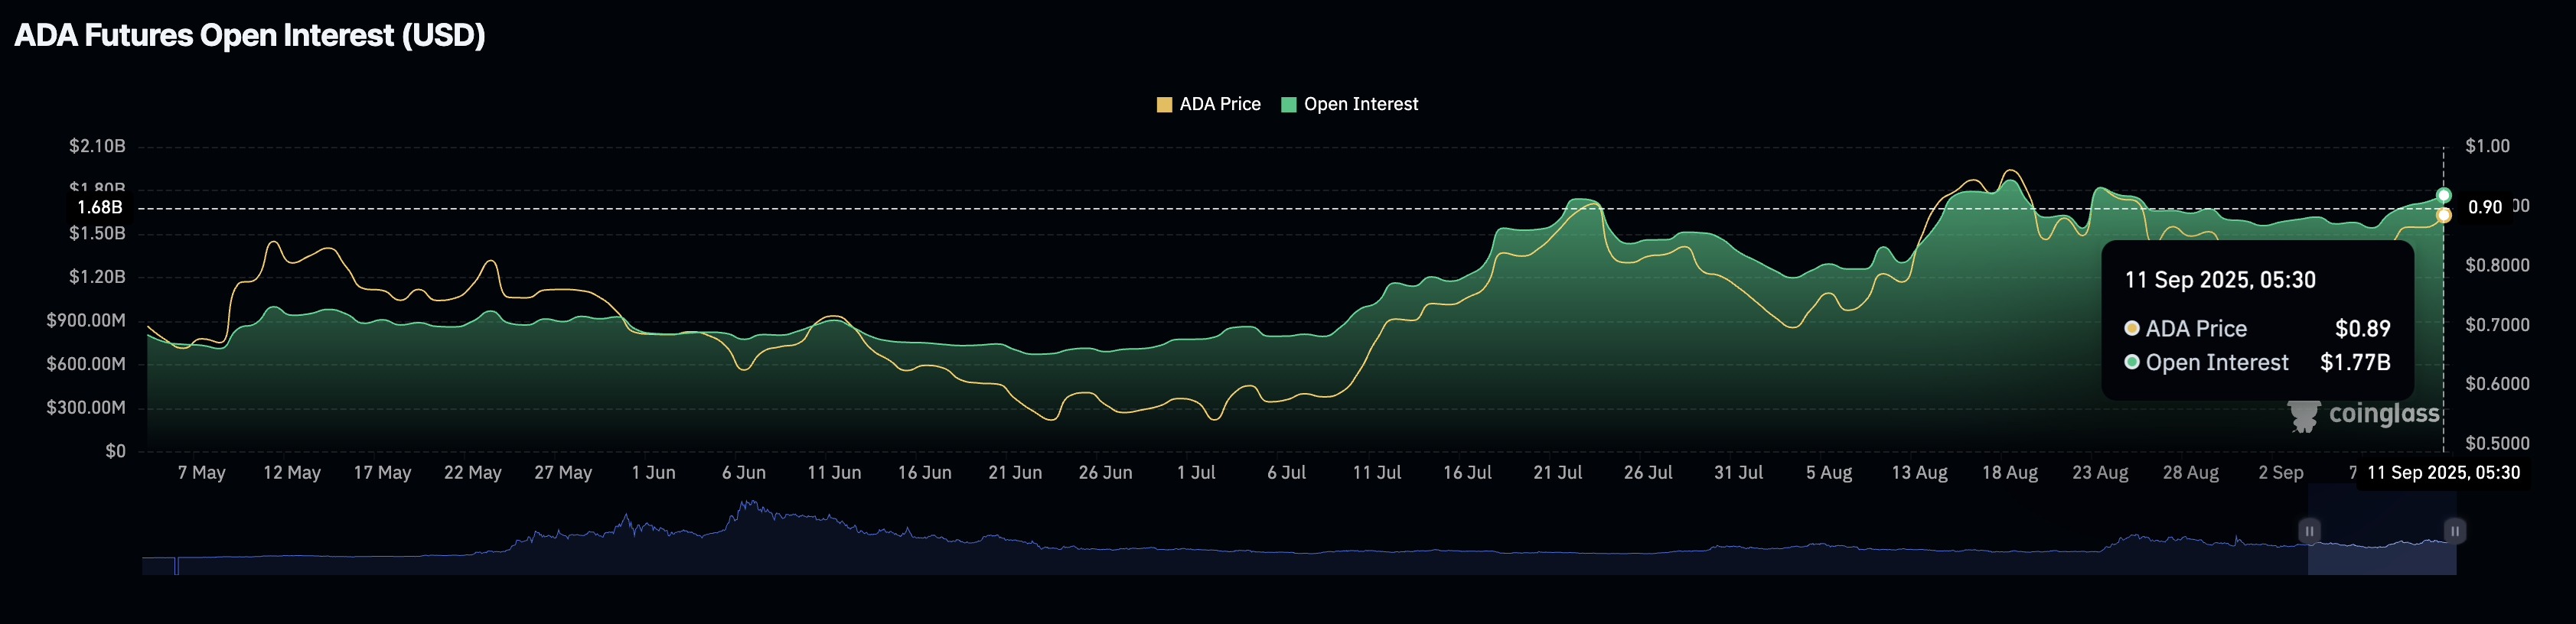
Cardano Open Interest. Source: CoinGlass

Cardano at a crucial crossroads targets $1

Cardano recovers with a falling wedge pattern breakout rally on the 4-hour chart,  struggling to surpass the $0.8947 level. At the time of writing, ADA stalls below this key resistance, with the 38.2% Fibonacci level at $0.8753 acting as the immediate support level, derived by the retracement between the August 2 low at $0.6842 and the August 14 high at $1.0193 

If Cardano’s rally surpasses the $0.8947 resistance level, it could target the $1.0000 psychological level. 

The 50-period Exponential Moving Average crosses above the 100-period EMA on the 4-hour chart, marking a Golden Cross pattern, which indicates a stronger recovery outpacing the prevailing trend. 

Still, the momentum indicators on the same chart show a risk of downside reversal. The Moving Average Convergence Divergence (MACD) moves closer to its signal line, risking a potential crossing below the same, which would indicate a bearish shift in momentum, triggering a sell signal. 

Additionally, the Relative Strength Index (RSI) at 60, pointing downside as it reverses from the overbought boundary, indicates that the buying pressure is softening. 

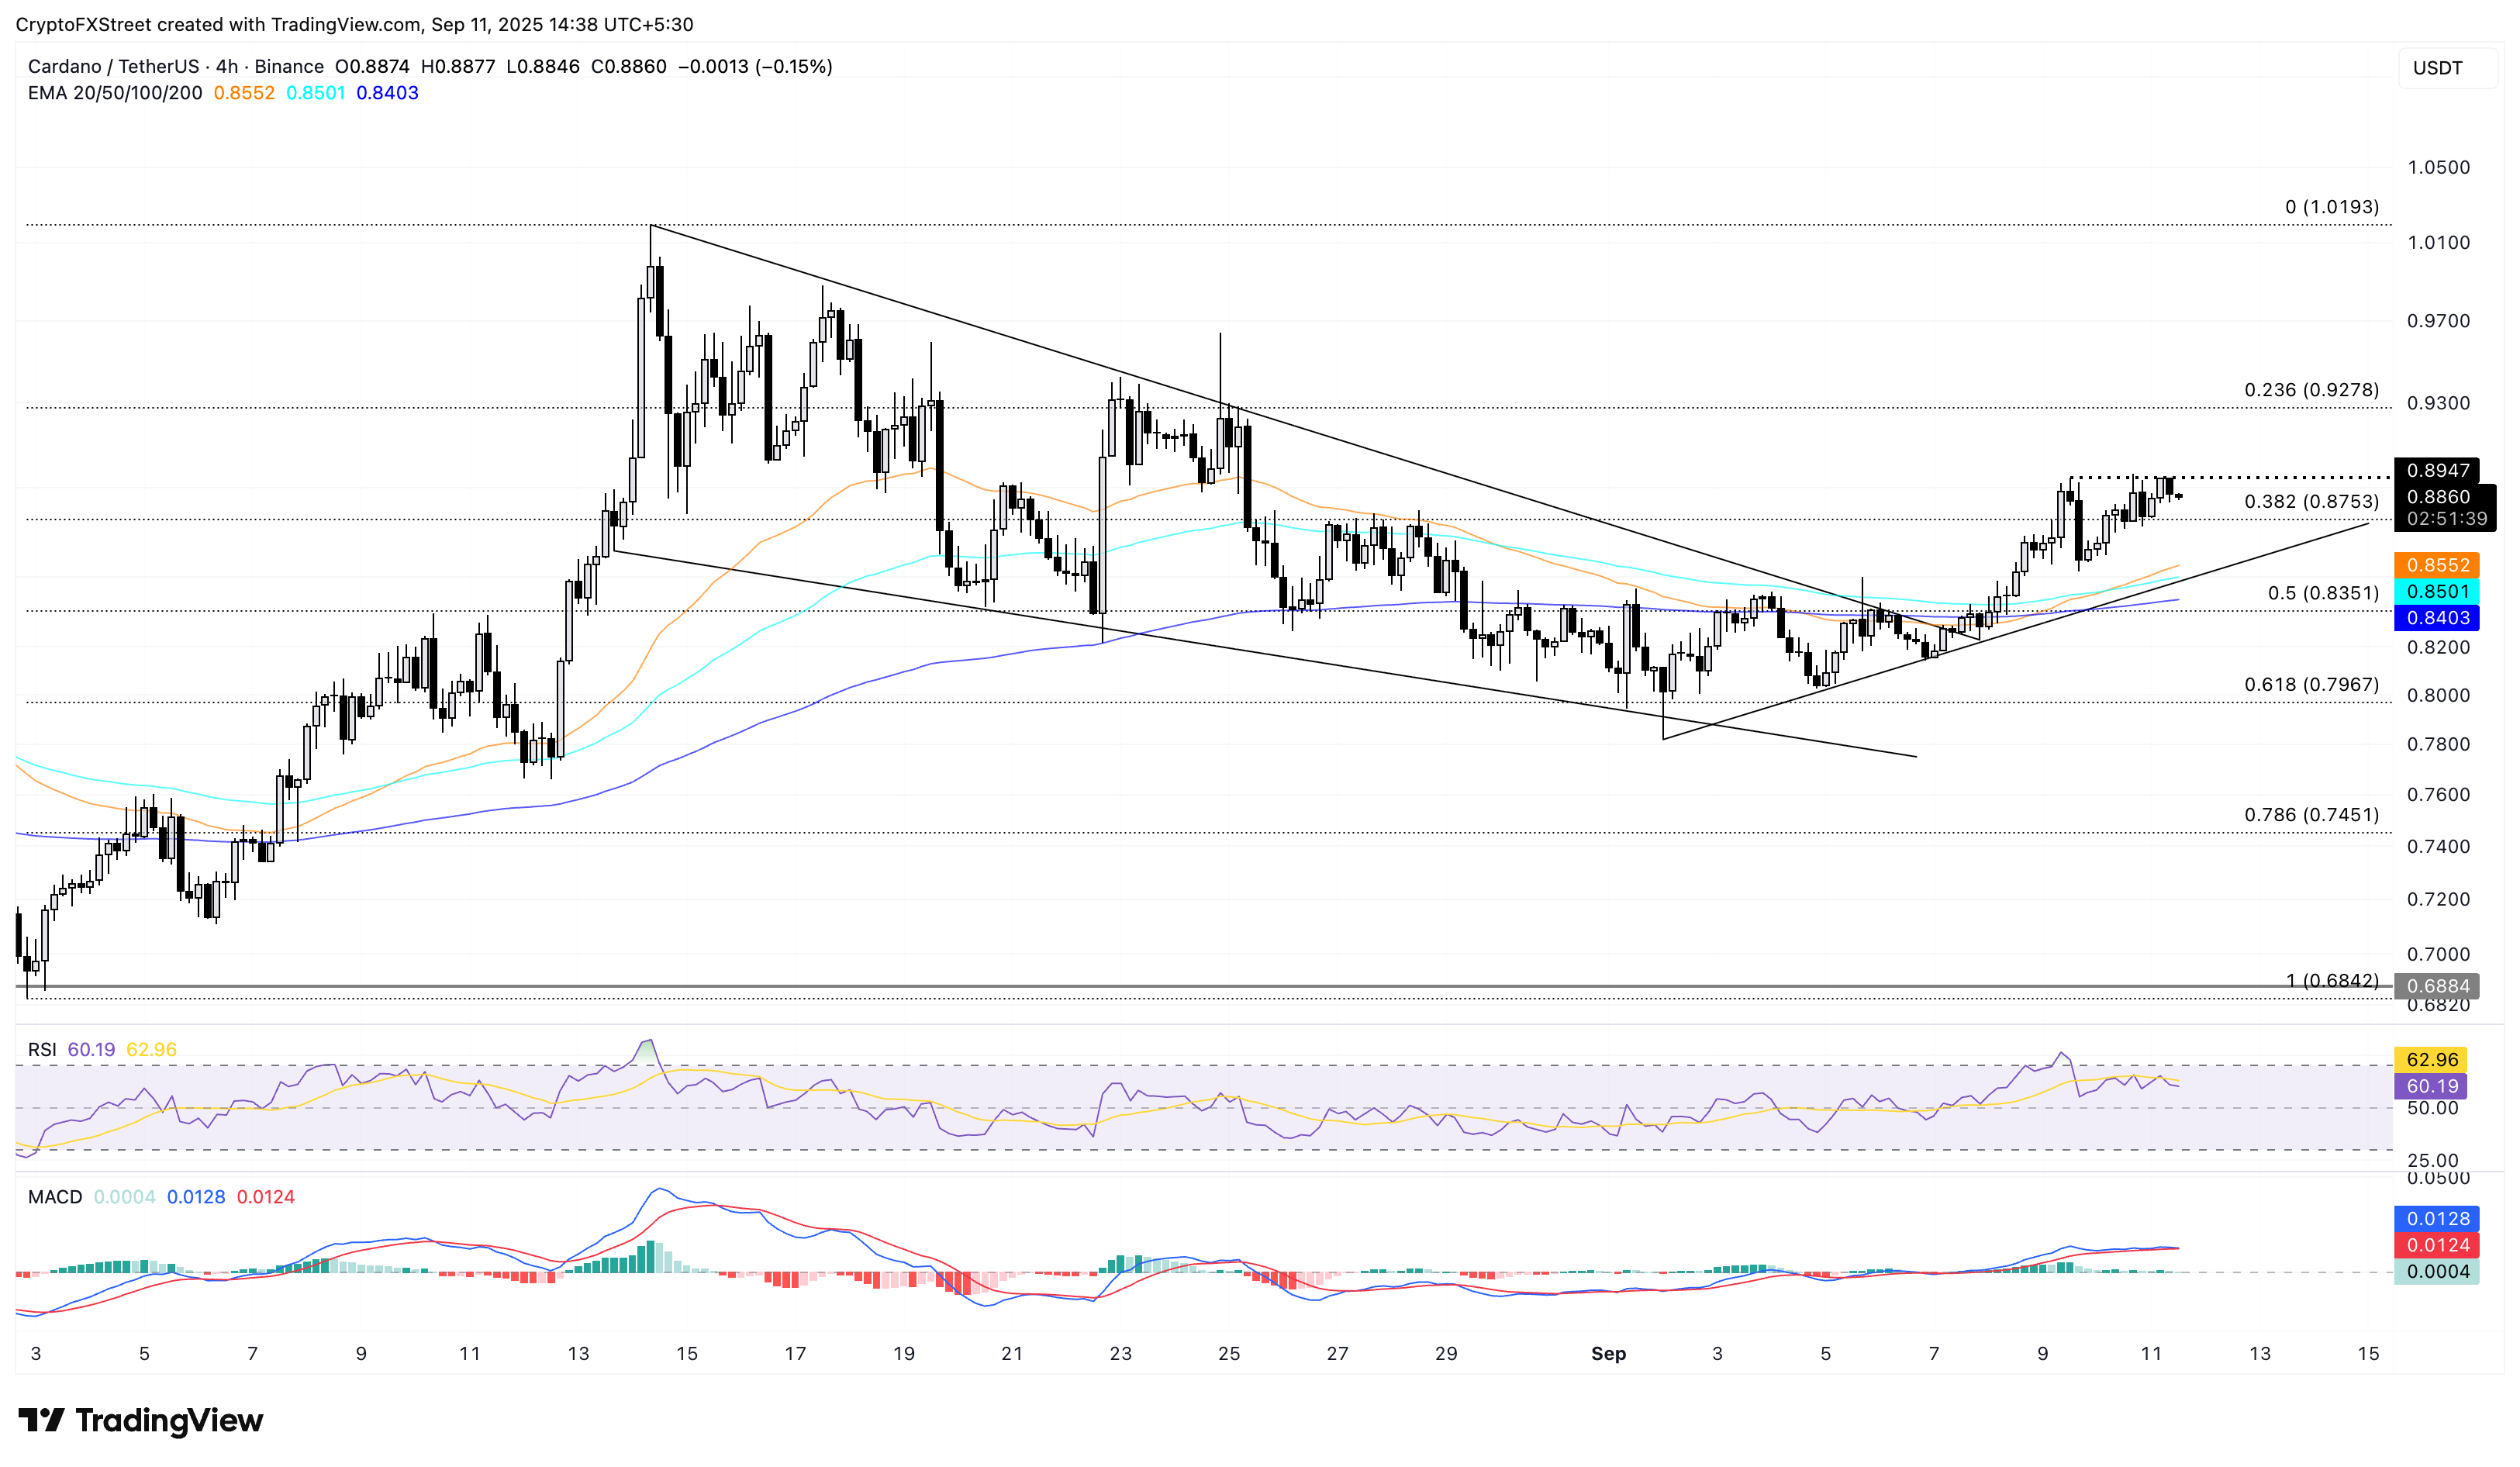
ADA/USDT daily price chart.

Looking downside, Cardano’s drop below $0.8753 could lead to a decline to the 50-period EMA at $0.8551.

Disclaimer: For information purposes only. Past performance is not indicative of future results.
placeholder
A Crash After a Surge: Why Silver Lost 40% in a Week?TradingKey - Spot Silver ( XAGUSD) prices have continued to decline; on Thursday, silver plummeted as much as 20% to break below $71 per ounce, and on Friday the sell-off intensified as prices fell fu
Author  TradingKey
Feb 06, Fri
TradingKey - Spot Silver ( XAGUSD) prices have continued to decline; on Thursday, silver plummeted as much as 20% to break below $71 per ounce, and on Friday the sell-off intensified as prices fell fu
placeholder
Bitcoin is trading around $63,000, down nearly 40% from its peak near $126,000Wall Street desks are no longer talking about upside dreams. The talk right now is how far Bitcoin charts could fall if selling keeps piling up. According to data from TradingView, Bitcoin’s price now sits at a shocking $63,500, after falling from $70,000 just this morning, losing $13,000 in 6 days, and staying far below […]
Author  Cryptopolitan
Feb 06, Fri
Wall Street desks are no longer talking about upside dreams. The talk right now is how far Bitcoin charts could fall if selling keeps piling up. According to data from TradingView, Bitcoin’s price now sits at a shocking $63,500, after falling from $70,000 just this morning, losing $13,000 in 6 days, and staying far below […]
placeholder
WTI declines below $63.00 as US-Iran talks loom West Texas Intermediate (WTI), the US crude oil benchmark, is trading around $62.85 during the Asian trading hours on Friday. The WTI price declines after the United States (US) and Iran agreed to hold talks in Oman on Friday. 
Author  FXStreet
Feb 06, Fri
West Texas Intermediate (WTI), the US crude oil benchmark, is trading around $62.85 during the Asian trading hours on Friday. The WTI price declines after the United States (US) and Iran agreed to hold talks in Oman on Friday. 
placeholder
Bitcoin Surrenders $65,000 as Analysts Warn of ‘Structural’ Market BreakBitcoin plunges 11% to break $65k as analysts term the crash "structural," citing a $1 trillion market wipeout and $2.09 billion in daily liquidations.
Author  Mitrade
Feb 06, Fri
Bitcoin plunges 11% to break $65k as analysts term the crash "structural," citing a $1 trillion market wipeout and $2.09 billion in daily liquidations.
placeholder
Bitcoin Drops to $70,000. U.S. Government Refuses to Bail Out Market, End of Bull Market or Golden Pit? The U.S. government refuses to bail out Bitcoin, and with Fed rate cuts nowhere in sight, a continued downward trend to test for a bottom is likely after a brief rebound.During the mid-da
Author  TradingKey
Feb 05, Thu
The U.S. government refuses to bail out Bitcoin, and with Fed rate cuts nowhere in sight, a continued downward trend to test for a bottom is likely after a brief rebound.During the mid-da
Related Instrument
goTop
quote