


XRP Price Starts September Weak, But Metrics Signal 8% Rebound Ahead
The XRP price hasn’t had the brightest start to September. The token slipped over 3% in the last 24 hours and was trading near $2.73 at press time. This latest dip adds to its 7-day losses to 8.6%.
The early weakness has left traders cautious, but a closer look at on-chain and derivatives data shows reasons to believe a rebound could be on the way.
Whale Flows Cool as Derivatives Sentiment Improves
Whale-to-exchange flows dropped to 1,025 XRP on August 31, one of the lowest levels in a month. By September 1, flows had recovered slightly to 1,768 XRP, keeping pressure near the lows.
This suggests that large holders are still sending less XRP to exchanges (since August 26), easing the selling pressure.
 XRP Whales Not As Aggressive: CryptoQuant
Some might read this as whales losing interest, but derivatives data gives a more nuanced view. The taker buy/sell ratio, which measures aggressive buying against selling in futures, has a history of marking local bottoms.
 XRP Derivatives Showing Growing Bullishness: CryptoQuant
- On August 2, the ratio hit 0.88, and XRP rallied from $2.76 to $3.07, a gain of 11%.
- On August 5, the ratio dropped to 0.90, followed by a 12% rally.
- On August 19, another low at 0.90 preceded a close to 8% rally.
For token TA and market updates: Want more token insights like this? Sign up for Editor Harsh Notariya’s Daily Crypto Newsletter here.
The latest low was 0.90 on August 29. The XRP price has not yet rallied, but the ratio has since climbed to 0.96, indicating that sentiment is turning more positive.
This rising bullishness, along with fewer whale selling instances, further supports the XRP price recovery narrative.
Bullish Divergence and Key XRP Price Levels to Watch
The second bullish sign comes from the Money Flow Index (MFI). This indicator tracks both price and trading volumes to show whether money is flowing in or out of an asset.
While XRP’s price fell through late August, the MFI rose steadily from 31.24 on August 22 to 47.49 on September 1. This bullish divergence between price and MFI often signals that traders are buying the dip.
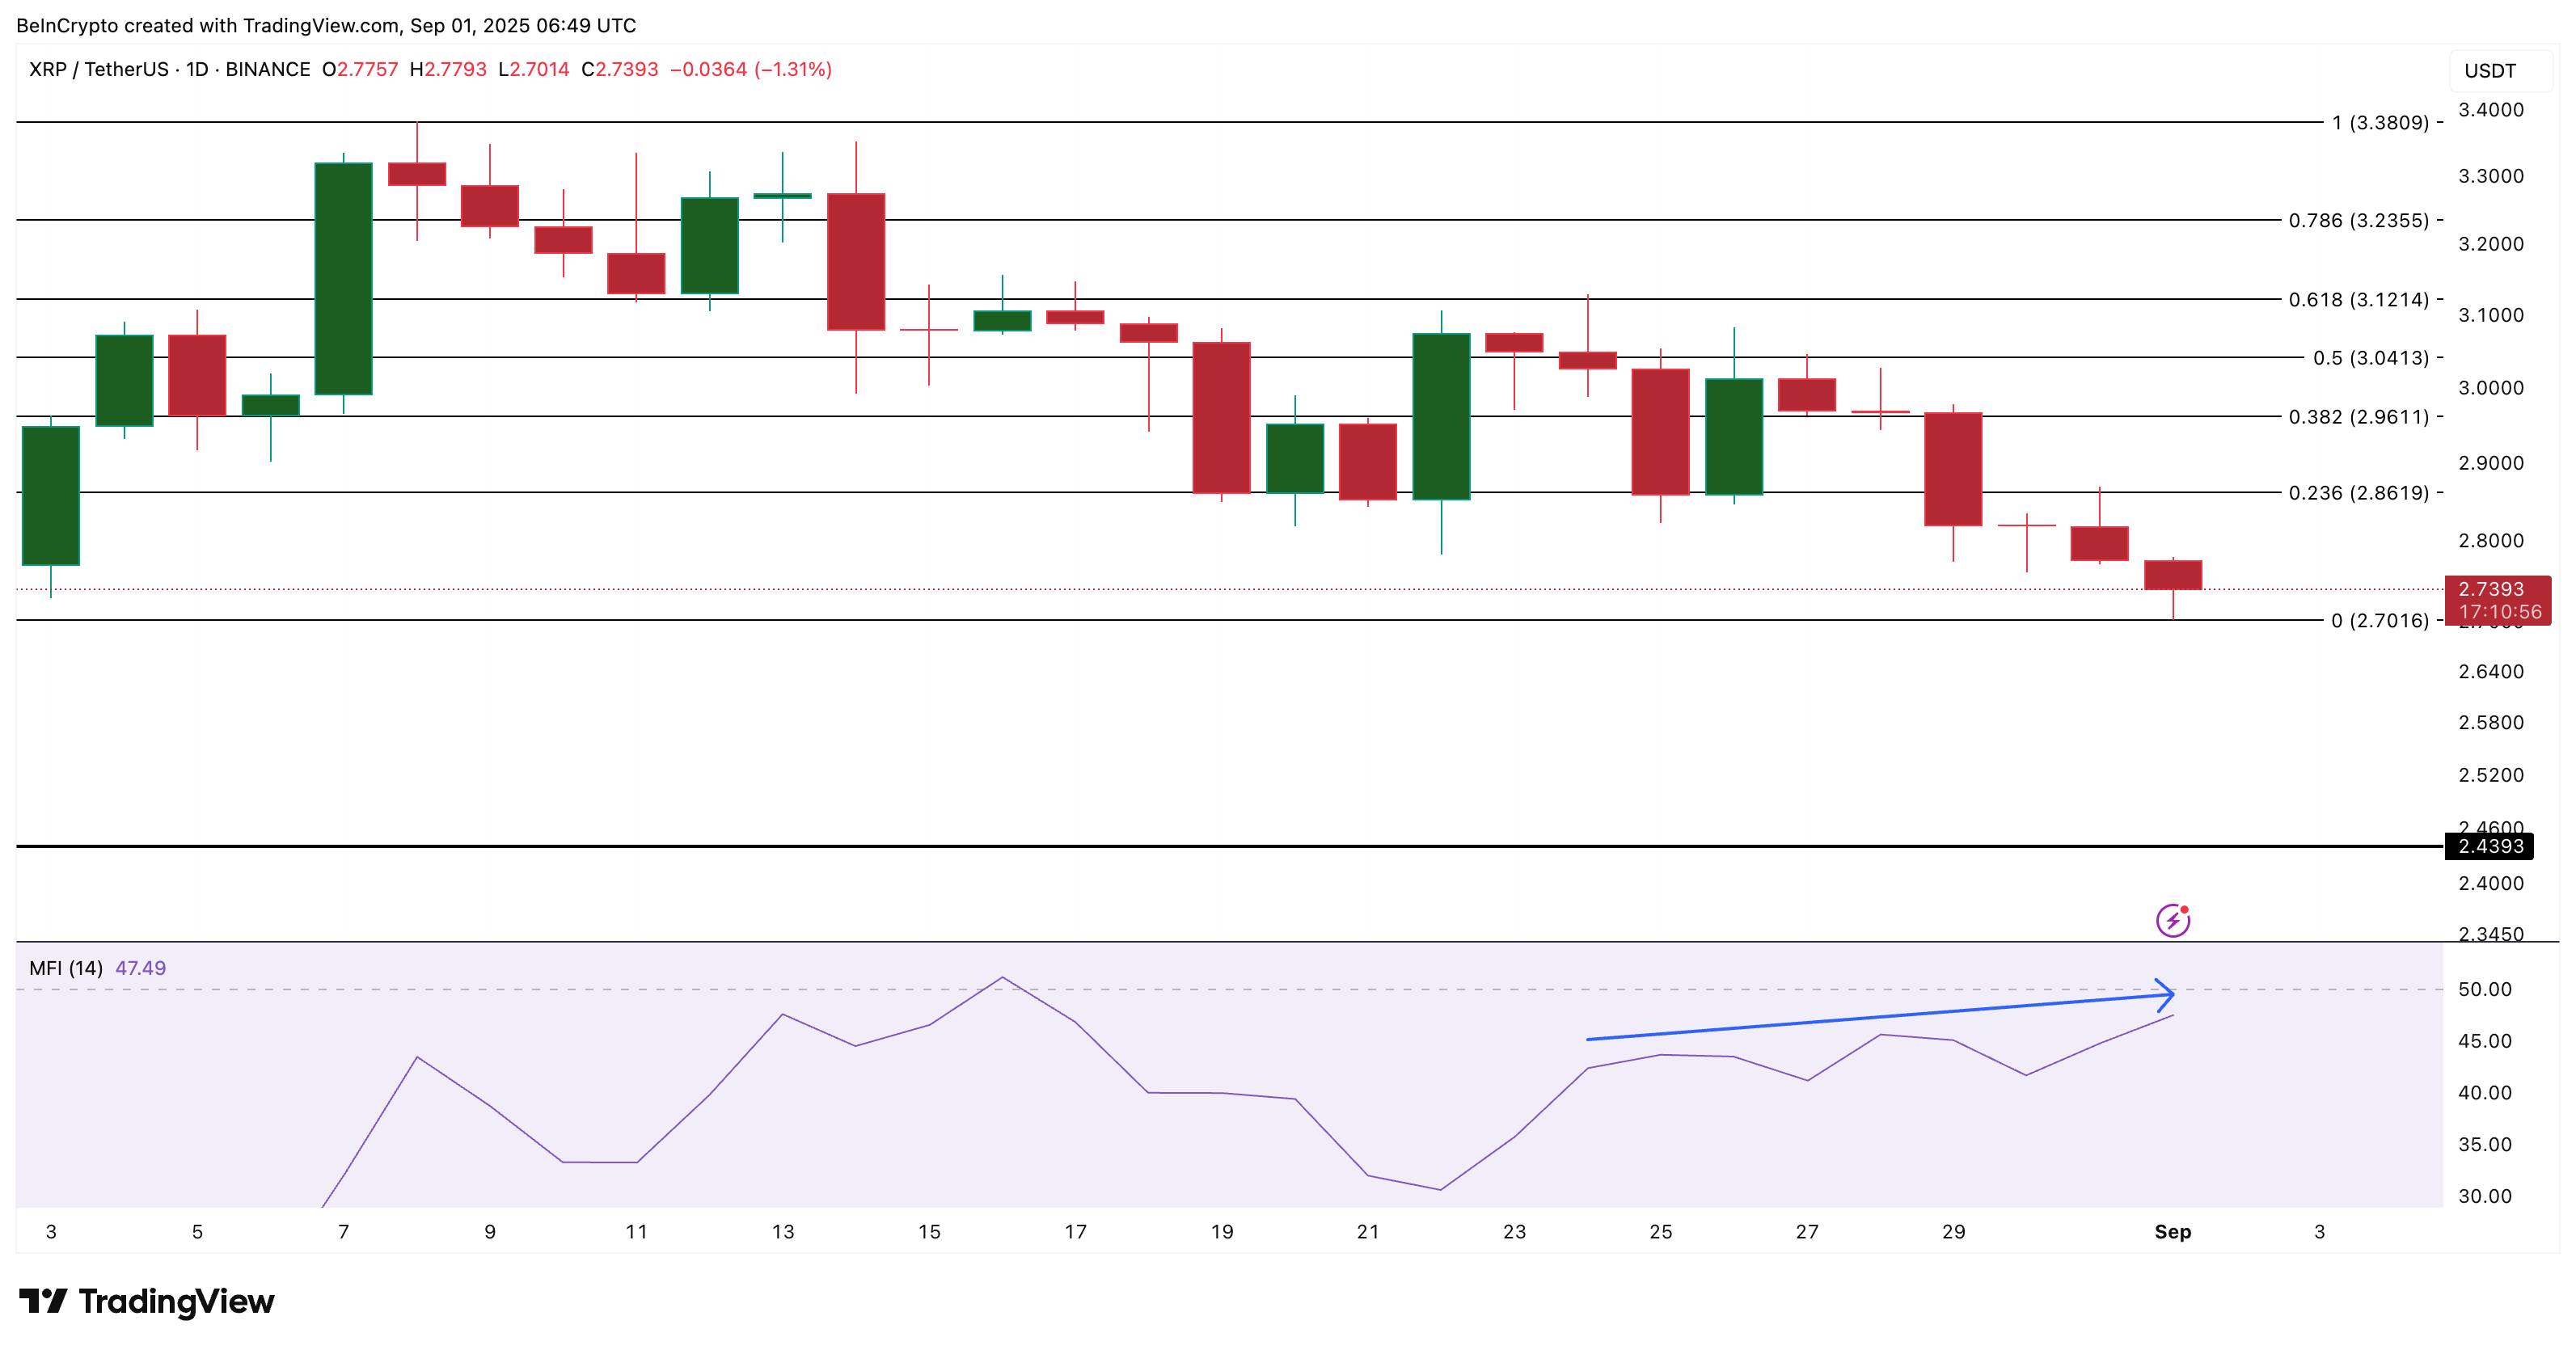 XRP Price Analysis: TradingView
The XRP price chart also backs up this view. $2.70 remains a critical support level. A daily close below it could open the way for a slide toward $2.43, invalidating the rebound hypothesis.
But as long as XRP holds above support, bulls have a chance to turn momentum. If sentiment from derivatives and inflows continues to firm up, the next resistance to test will be $2.96. This move would mark about an 8% rebound from current levels, the minimum XRP price rise seen over the past month after the Taker Buy/Sell Ratio hit a local bottom.
Recommended Articles


