


What to Expect From Ethereum in September
Ethereum (ETH) price seems to be ending August on a strong note, gaining over 23% and breaking a three-year streak of negative August performances. Unlike Bitcoin, which has struggled through the month, the ETH price has shown resilience.
However, September has historically been one of Ethereum’s weaker months, with only marginal gains of 3.20% in 2024 and 1.49% in 2023 after a series of red Septembers before that. Now, with the charts flashing mixed signals, ETH could be headed for a choppy month.
Long-Term Holders May Book Profits
One key metric to watch is Ethereum’s Net Unrealized Profit/Loss (NUPL), which measures the overall profitability of holders.
A high NUPL means most wallets are sitting on profits, often a signal that some may take profit. Ethereum’s long-term holder NUPL currently sits at 0.62, close to its three-month high.
 Ethereum Holders Might Book Profits: Glassnode
In the past, similar levels have triggered corrections. On August 17, when NUPL touched 0.63, ETH fell from $4,475 to $4,077 (-8.9%). Later that month, at 0.66, ETH dropped from $4,829 to $4,380 (-9.3%). This suggests that September could bring volatility or range-bound action.
 Ethereum Price’s Historical Performance: CryptoRank
Historically, September hasn’t been ETH’s strongest month. That history, combined with high NUPL, supports the case for choppiness.
For token TA and market updates: Want more token insights like this? Sign up for Editor Harsh Notariya’s Daily Crypto Newsletter here.
Still, long-term fundamentals remain supportive of a price surge. In an exclusive interview with BeInCrypto, Kevin Rusher, CEO of RAAC, explained:
“In September, I expect the drivers for Ethereum’s price to remain largely the same as they are today, key among these the growing trend of companies buying up ETH for their treasuries. In fact, just this week, Standard Chartered named this as the main reason for increasing its ETH price target to $7,500, he mentioned”
This treasury accumulation trend, alongside Ethereum’s role in DeFi and real-world asset (RWA) tokenization, could help cushion downside moves even if near-term volatility persists.
Cost Basis Heatmap Highlights Critical Resistance
Another important metric is the Cost Basis Heatmap, which shows where ETH was last accumulated. These zones often act as natural support or resistance.
 Key ETH Accumulation Clusters: Glassnode
The strongest support cluster lies between $4,323 and $4,375, where more than 962,000 ETH were accumulated. Below that, additional zones exist at $4,271–$4,323 (418,872 ETH) and $4,219–$4,271 (329,451 ETH), providing buffers in case the Ethereum price dips.
The heavier challenge lies higher. Between $4,482 and $4,592, nearly 1.9 million ETH were accumulated, making this a formidable resistance zone.
If the ETH price clears this, momentum could extend toward $4,956. More on this later when we discuss the Ethereum price action
Technical Charts Signal At Ethereum Price Choppiness
The 2-day Ethereum price chart shows that it has broken below an ascending trendline. This doesn’t confirm a bearish reversal, but it does suggest fading bullish momentum.
The Relative Strength Index (RSI), which measures the speed and strength of price movements, has formed a bearish divergence — with price making higher highs while RSI trended lower.
This typically signals weakening strength and a likelihood of range-bound trading, more so if it forms on a longer timeframe.
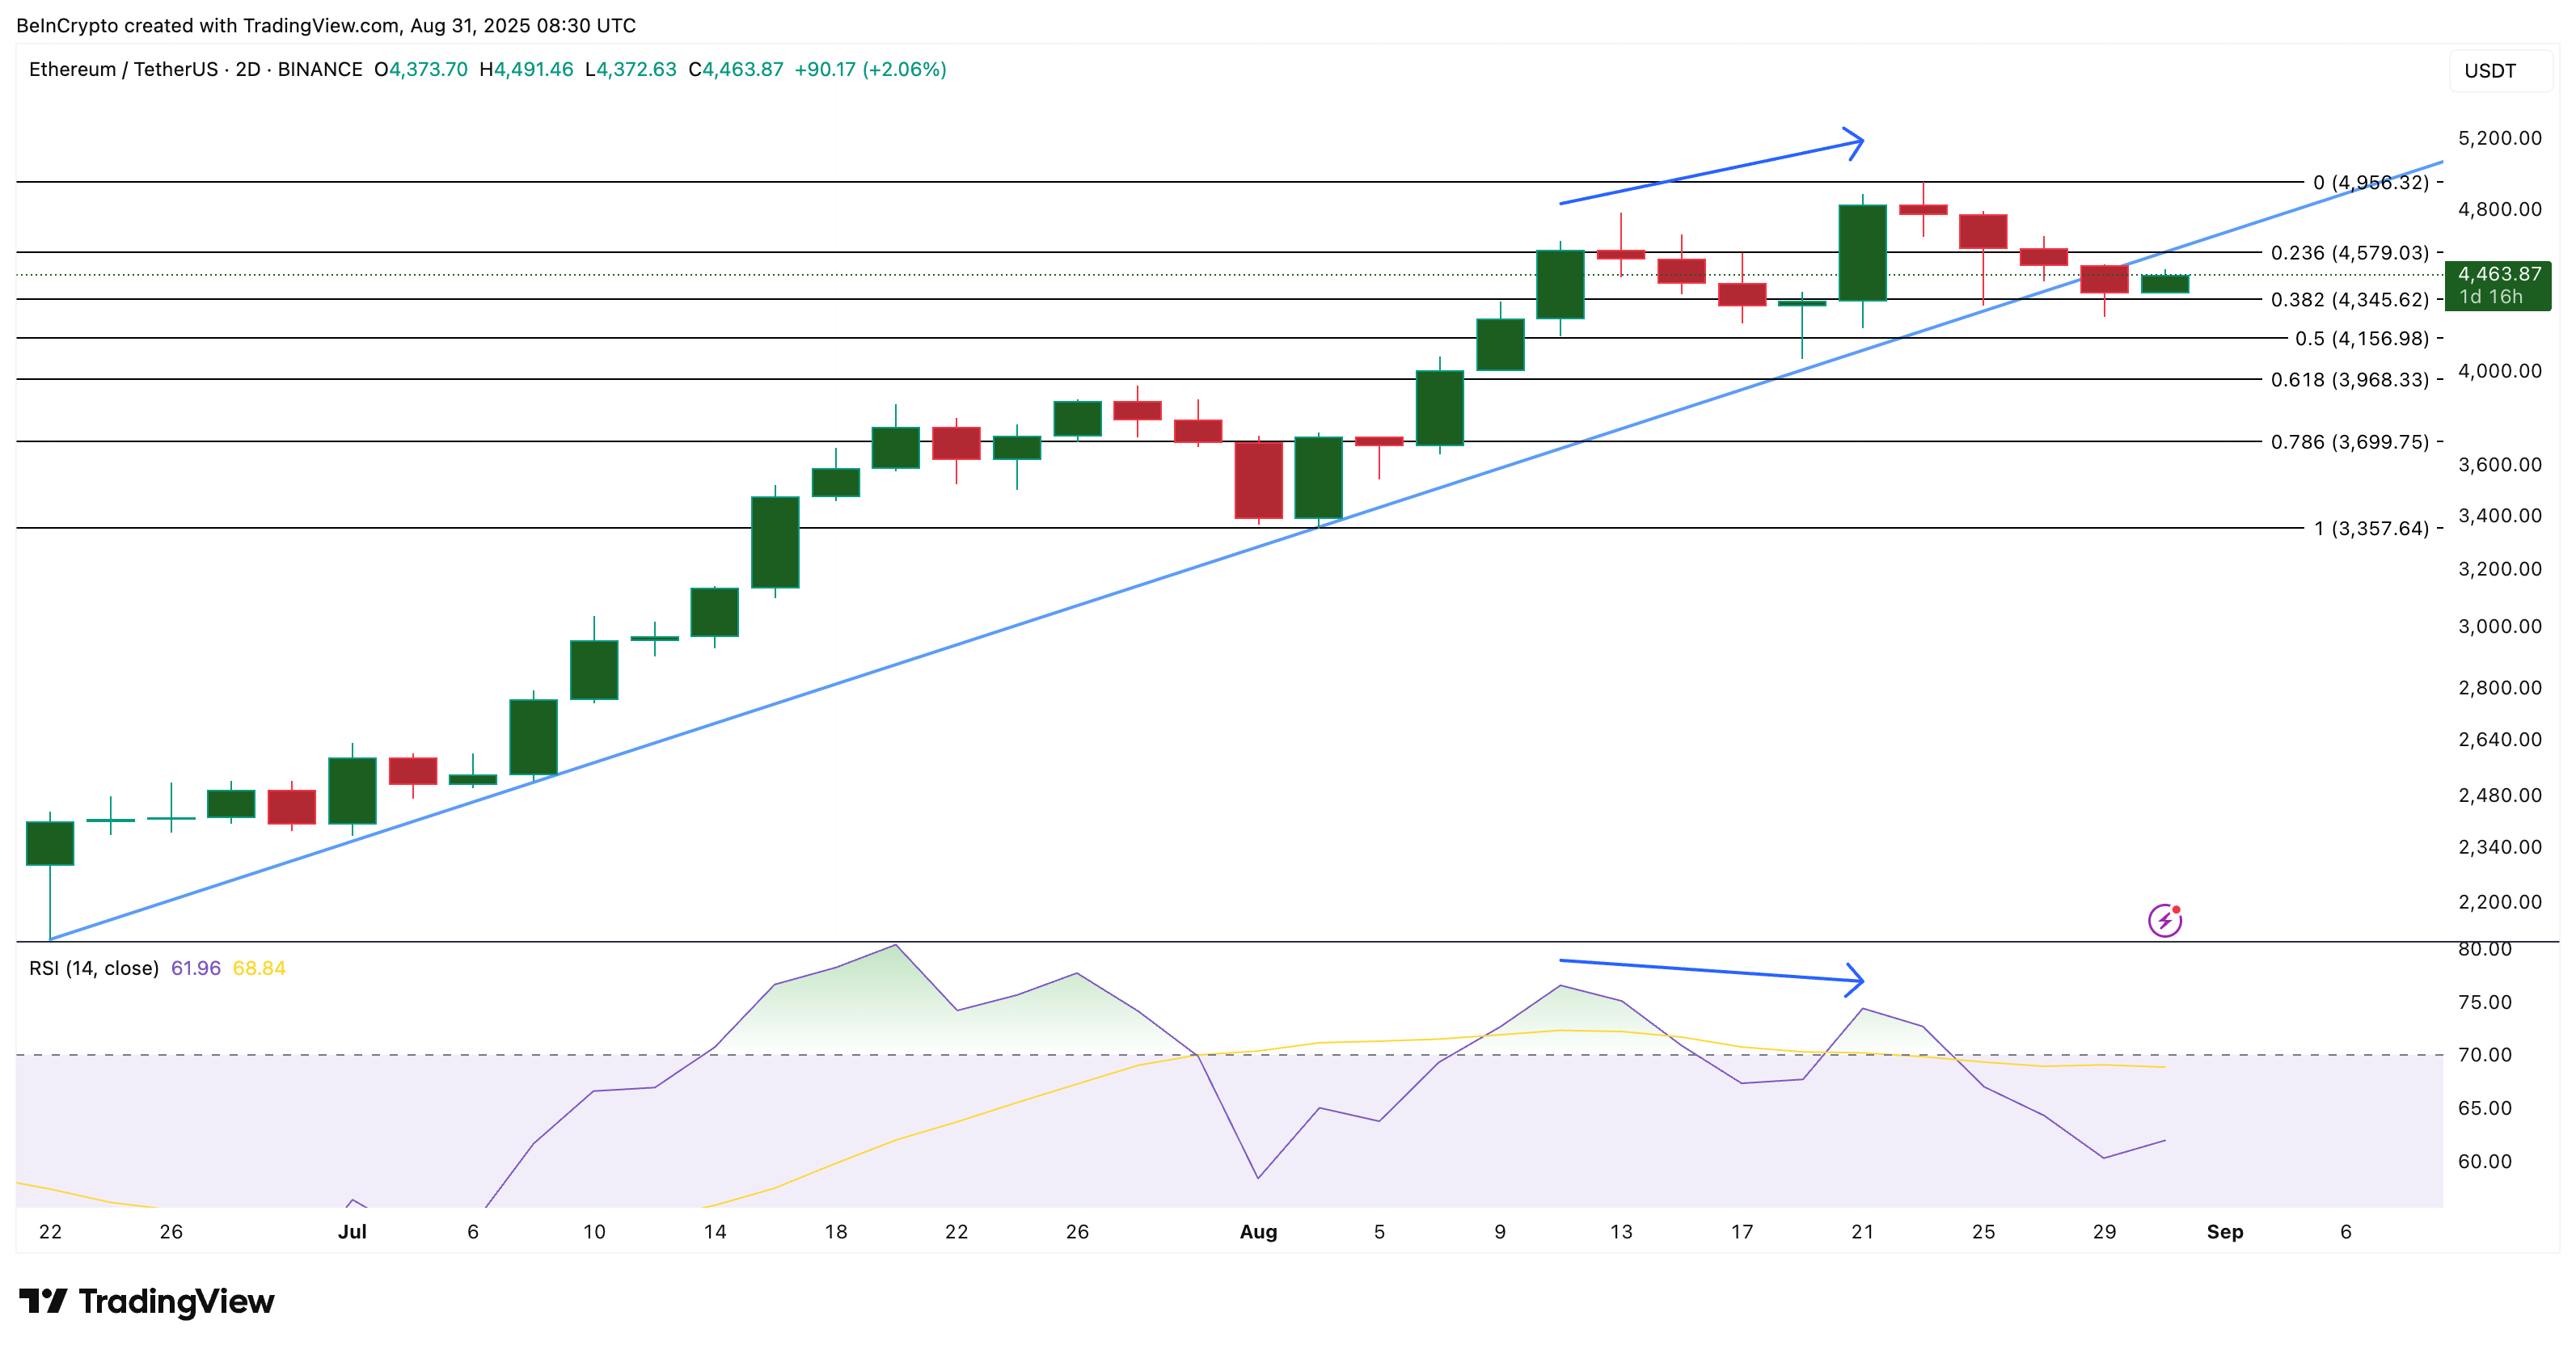 Ethereum Price Analysis: TradingView
If ETH reclaims $4,579 (almost breaking the cost basis resistance), upside momentum could return, with the key target at $4,956.
On the downside, watch $4,345 and $4,156 as important support levels. A break below $4,156 could open further downside risks, while a sustained hold above $4,579 keeps $4,956 (close to $5,000, which is a key psychological level) within reach.
However, for Ethereum, that level couldn’t just be the start of something bigger, as summed up by Rusher.
“Yes, $5,000 is still a meaningful milestone. Psychologically, investors like round numbers, plus it’s a fresh all-time high. Once ETH gets past the $5,000 mark, it will eventually become a strongly defended support level, he added”
However, if the Ethereum price closes under $4,156 with a complete 2-day candle, the bullish narrative might take some more time to materialize.
And with the long-term holder NUPL closing in on 3-month highs, talks regarding choppiness find more weight.
Recommended Articles


