215% PENGU Rally Incoming? Analyst Says Token ‘Inches’ From Next Leg Up

Source Newsbtc

An analyst believes Pudgy Penguins (PENGU) could be close to a big breakout based on this technical analysis (TA) pattern in its 4-hour chart.

PENGU Has Potentially Been Following A Bull Flag Recently

In a new post on X, analyst Ali Martinez has shared what could be next for Pudgy Penguins according to a chart pattern. The formation in question is a Bull Flag, which is a type of Flag. Flags form whenever the price of an asset experiences a period of consolidation inside a parallel channel following an initial sharp move. This starting move is known as the ‘pole,’ and the channel makes up for the ‘flag.’

A Bull Flag occurs when the pole is in the up direction and the flag corresponds to parallel consolidation to a net downside. When the price is trading inside the flag channel, it’s likely to face resistance at the upper line and support at the lower one. A move out of either of these levels can signal a breakout in that direction.

Bull Flags are assumed to be bullish continuation patterns, so a breakout may be more likely to occur above the resistance line of the parallel channel. Such a breakout is also considered to be of the same length as the pole of the pattern.

Like the Bull Flag, there is also a formation called the Bear Flag. It works much in the same way, except for the fact that the pole and flag are both flipped in orientation. That is, the pole corresponds to a sharp downward move, while the flag represents a phase of consolidation to the upside.

Now, here is the chart shared by Martinez that shows the Bull Flag that the 4-hour price of PENGU has been trading inside for the past month:

PENGU Bull Flag

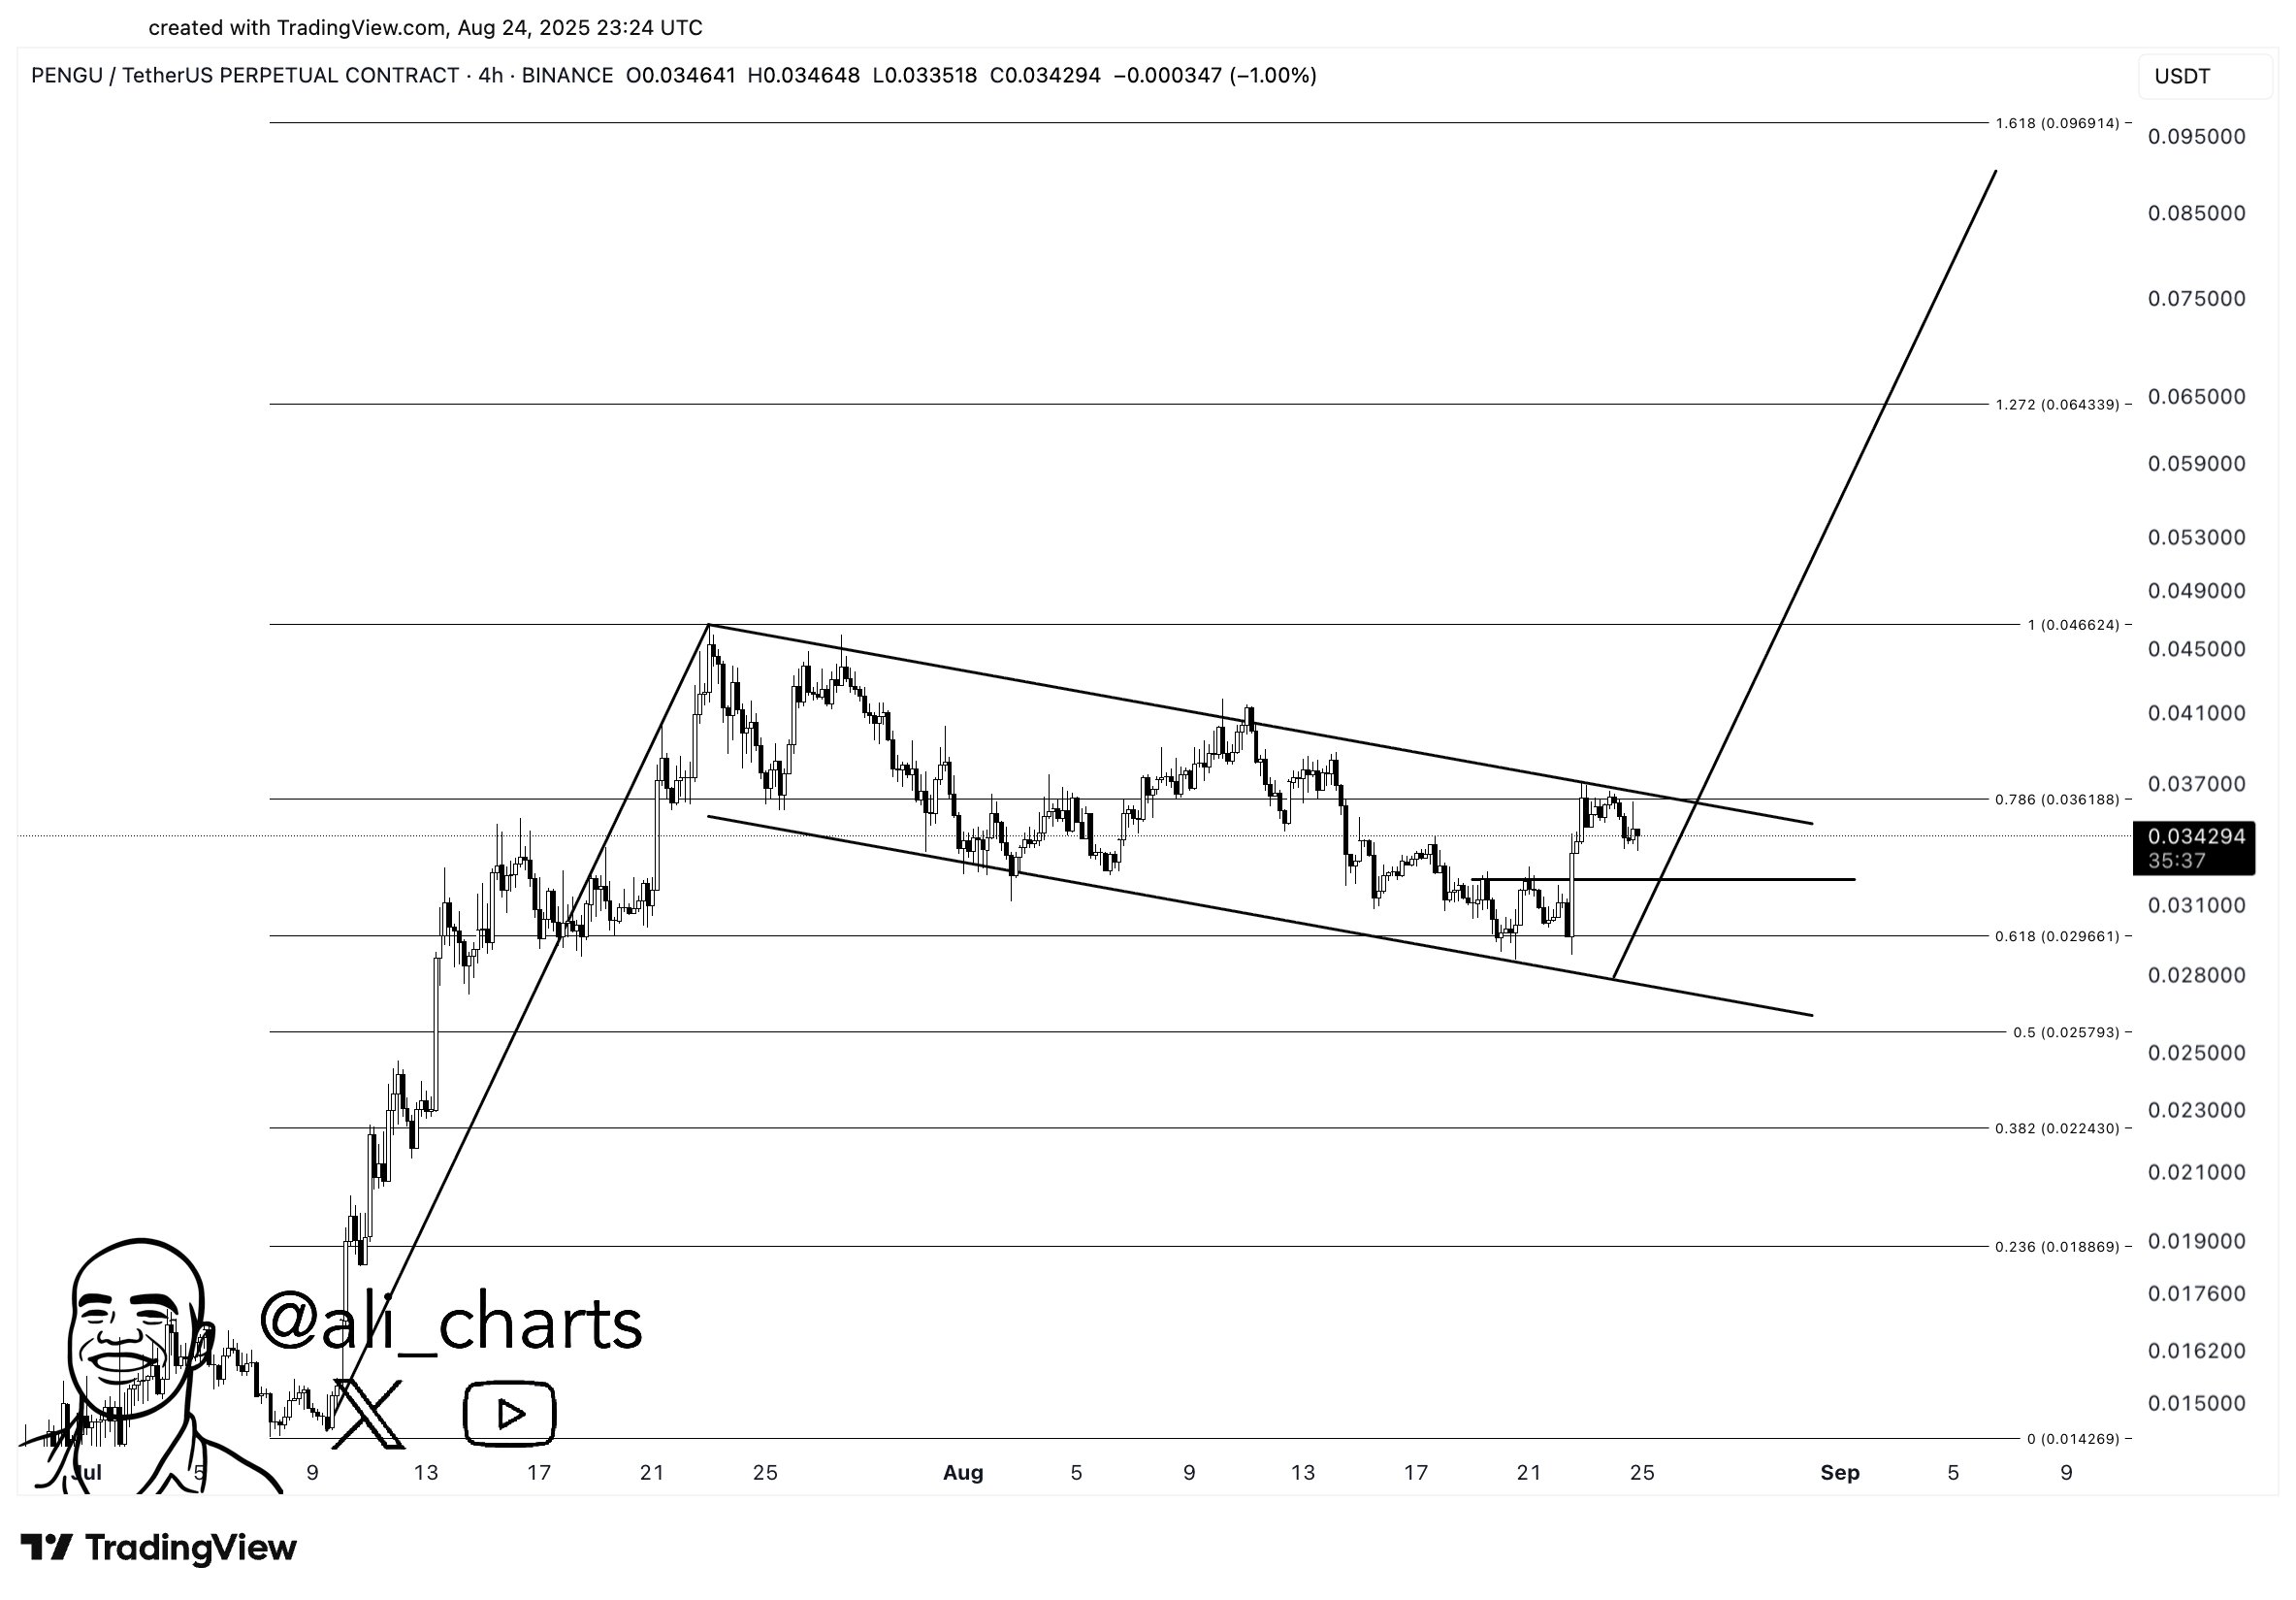
As displayed in the above graph, PENGU has slowly been descending within the channel of the Bull Flag. The memecoin recently made a retest of the upper level, but it ended up rejected. The asset has since faced a plunge, so it’s uncertain when the next attempt could occur. The longer the coin remains locked inside the channel, however, the likelier an escape could become, whether to the upside or downside.

In the view of the analyst, Pudgy Penguins is “inches away from a new leg up.” Going by the scale of the pole, a potential bullish breakout could send PENGU to near the $0.10 mark. It only remains to be seen how the cryptocurrency’s price will develop in the coming days and whether a surge above the Bull Flag will occur.

PENGU Price

At the time of writing, Pudgy Penguins is trading around $0.317, down more than 7% over the last 24 hours.

Pudgy Penguins PENGU Price Chart
Disclaimer: For information purposes only. Past performance is not indicative of future results.
placeholder
A Crash After a Surge: Why Silver Lost 40% in a Week?TradingKey - Spot Silver ( XAGUSD) prices have continued to decline; on Thursday, silver plummeted as much as 20% to break below $71 per ounce, and on Friday the sell-off intensified as prices fell fu
Author  TradingKey
Feb 06, Fri
TradingKey - Spot Silver ( XAGUSD) prices have continued to decline; on Thursday, silver plummeted as much as 20% to break below $71 per ounce, and on Friday the sell-off intensified as prices fell fu
placeholder
Bitcoin is trading around $63,000, down nearly 40% from its peak near $126,000Wall Street desks are no longer talking about upside dreams. The talk right now is how far Bitcoin charts could fall if selling keeps piling up. According to data from TradingView, Bitcoin’s price now sits at a shocking $63,500, after falling from $70,000 just this morning, losing $13,000 in 6 days, and staying far below […]
Author  Cryptopolitan
Feb 06, Fri
Wall Street desks are no longer talking about upside dreams. The talk right now is how far Bitcoin charts could fall if selling keeps piling up. According to data from TradingView, Bitcoin’s price now sits at a shocking $63,500, after falling from $70,000 just this morning, losing $13,000 in 6 days, and staying far below […]
placeholder
WTI declines below $63.00 as US-Iran talks loom West Texas Intermediate (WTI), the US crude oil benchmark, is trading around $62.85 during the Asian trading hours on Friday. The WTI price declines after the United States (US) and Iran agreed to hold talks in Oman on Friday. 
Author  FXStreet
Feb 06, Fri
West Texas Intermediate (WTI), the US crude oil benchmark, is trading around $62.85 during the Asian trading hours on Friday. The WTI price declines after the United States (US) and Iran agreed to hold talks in Oman on Friday. 
placeholder
Bitcoin Surrenders $65,000 as Analysts Warn of ‘Structural’ Market BreakBitcoin plunges 11% to break $65k as analysts term the crash "structural," citing a $1 trillion market wipeout and $2.09 billion in daily liquidations.
Author  Mitrade
Feb 06, Fri
Bitcoin plunges 11% to break $65k as analysts term the crash "structural," citing a $1 trillion market wipeout and $2.09 billion in daily liquidations.
placeholder
Bitcoin Drops to $70,000. U.S. Government Refuses to Bail Out Market, End of Bull Market or Golden Pit? The U.S. government refuses to bail out Bitcoin, and with Fed rate cuts nowhere in sight, a continued downward trend to test for a bottom is likely after a brief rebound.During the mid-da
Author  TradingKey
Feb 05, Thu
The U.S. government refuses to bail out Bitcoin, and with Fed rate cuts nowhere in sight, a continued downward trend to test for a bottom is likely after a brief rebound.During the mid-da
goTop
quote