

Bitcoin Correction Risks Deepen With $105,000 As Critical Support

Source Newsbtc

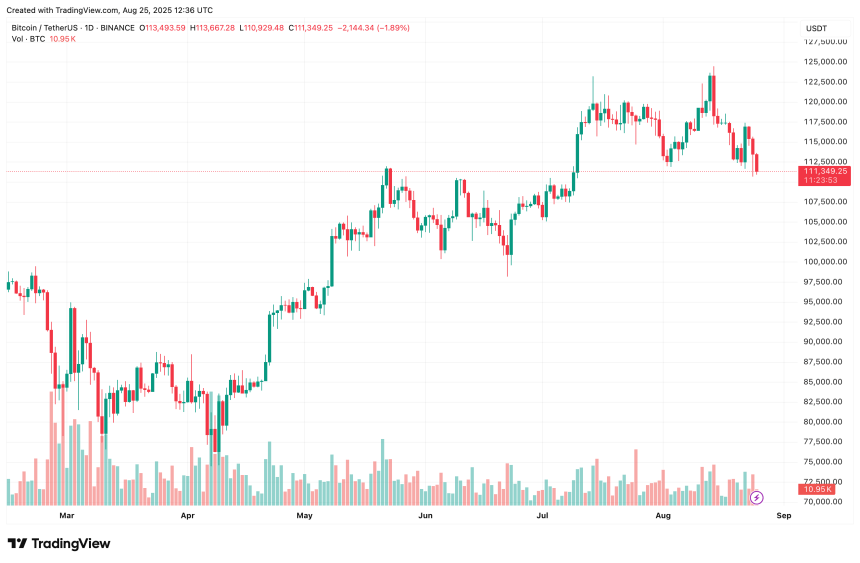
Following another unsuccessful attempt to create a new all-time high (ATH), Bitcoin (BTC) dropped to a weekly low of $110,820 on the Binance exchange yesterday. The world’s largest cryptocurrency by market cap has now entered a clear pullback phase, with $105,000 emerging as the critical support level that traders are closely watching.

Bitcoin Falls To $110,000 Amid Market Pullback

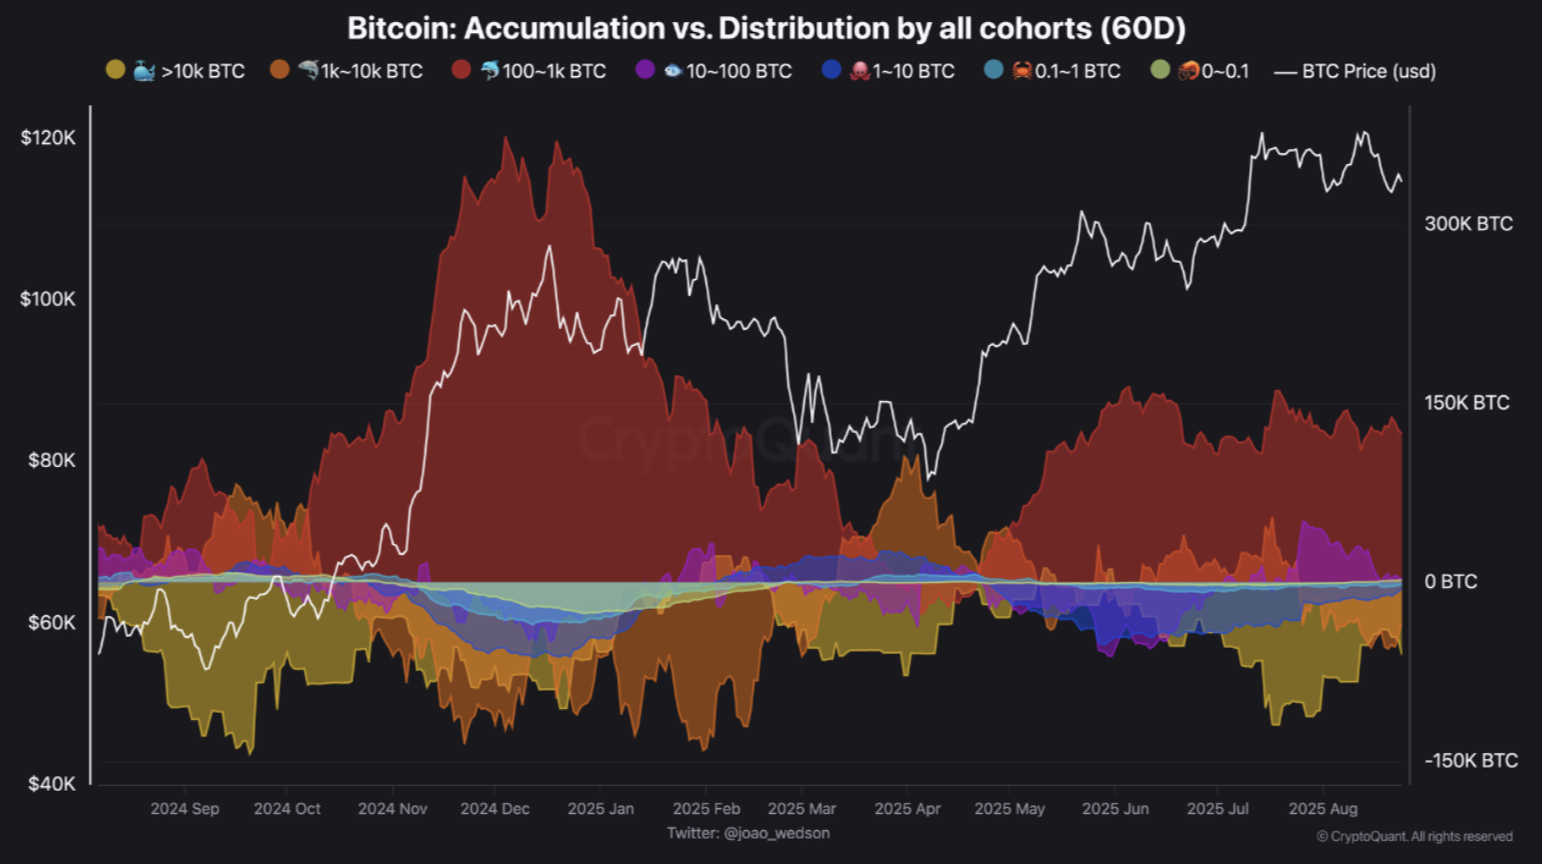
According to a CryptoQuant Quicktake post by contributor BorisD, Bitcoin’s current distribution phase could extend for several more days. Wallet accumulation and distribution patterns highlight stronger sell-offs among BTC whales, raising questions about short-term price stability.

For context, Bitcoin whales are individuals or entities that hold very large amounts of BTC, typically thousands of coins, giving them outsized influence on market trends. Their buying or selling activity can significantly move prices, making whale behavior a closely watched indicator for traders and analysts.

Interestingly, smaller wallet cohorts are showing different behavior. Wallets holding 0–0.1 BTC recently switched back to accumulation mode as the broader market declined. These smaller holders typically follow the price rather than set the trend. 

Wallets holding 0.1–1 BTC began accumulating even at ATH levels. This trend suggests retail investors remain confident in Bitcoin’s long-term trajectory.

On the other hand, wallets with 1–10 BTC halted their selling around the $107,000 level and returned to accumulation. This trend hints that mid-sized holders see current price levels as attractive buying opportunities, despite overall market weakness.
BTC

BTC Whales Continue To Sell

Larger holders are displaying more cautious behavior. Wallets with 10–100 BTC stopped accumulating at $118,000 and have since moved into distribution. 

BorisD pointed out that wallets with 100–1,000 BTC are the most important group to watch. While generally in accumulation mode, this cohort has shown a balance between buying and selling. The analyst added:

They have shown balance between accumulation and distribution since $105,000, reflecting indecision. This level acts as a critical support-turning zone.

Meanwhile, wallets with 1,000–10,000 BTC remain in consistent sell-off mode following the ATH of $124,474 reached on August 13. The largest wallets – holding more than 10,000 BTC – also began selling at those highs and continue to distribute. However, the pace of their selling has slowed as the price pulls back, indicating weakening distribution pressure.

The analyst emphasized that although distribution remains the dominant trend, its intensity is waning. The $105,000 support zone now stands out as the most crucial threshold. A decisive break below this level could shake market confidence and trigger widespread fear among investors.

Fellow CryptoQuant contributor, Julio Moreno, recently stated that the CryptoQuant Bull Score Index moved into neutral territory. However, it must trade over $112,000 to avoid a sharper price correction.

Another prominent crypto analyst, Tony “The Bull” Severino said that BTC’s path to $183,000 remains intact. At press time, BTC trades at $111,349, down 2.7% over the past 24 hours.
bitcoin
Disclaimer: For information purposes only. Past performance is not indicative of future results.
placeholder
The Fed will sit still on October 28 — but 100 of 100 economists now expect a December hikeA Reuters poll run October 16-20 found 94 of 100 economists expecting the Fed to hold at 3.75-4.00% on October 28 — and all 100 expecting a hike in December, against less than half a month earlier. The market is close to the same price, with CME FedWatch at roughly 17% for October and 82.8% for December. With the Fed in blackout since October 17, here are the five dates that decide the rest of the year, what each one is priced for, and the two directions each can take.
Author  Irene Q.
Oct 22, Thu
A Reuters poll run October 16-20 found 94 of 100 economists expecting the Fed to hold at 3.75-4.00% on October 28 — and all 100 expecting a hike in December, against less than half a month earlier. The market is close to the same price, with CME FedWatch at roughly 17% for October and 82.8% for December. With the Fed in blackout since October 17, here are the five dates that decide the rest of the year, what each one is priced for, and the two directions each can take.
placeholder
Gold falls to two‑month low below $4,050 as oil spikesGold price (XAU/USD) falls to the lowest in more than two months near $4,025 during the early Asian session on Friday. The precious metal faces some selling pressure as escalating tensions in the Middle East send oil surging ahead of a Federal Reserve (Fed) policy meeting.
Author  FXStreet
Oct 23, Fri
Gold price (XAU/USD) falls to the lowest in more than two months near $4,025 during the early Asian session on Friday. The precious metal faces some selling pressure as escalating tensions in the Middle East send oil surging ahead of a Federal Reserve (Fed) policy meeting.
placeholder
Gold Price Analysis Today | Forex Gold Analysis | XAU/USD Analysis - October 23, 2026Get the latest gold price analysis, forex gold insights, and XAU/USD analysis for October 23, 2026. Read on for the details.
Author  Mitrade
Oct 23, Fri
Get the latest gold price analysis, forex gold insights, and XAU/USD analysis for October 23, 2026. Read on for the details.
placeholder
Nasdaq closes at 26,008.86 — 8.9 points above 26,000, and the credit market never blinkedThe Nasdaq Composite fell 2.60% to 26,008.86 on October 22, its worst session since June, as Meta sank 6.98% on 2026 capex guidance of $135–145 billion. But the equal-weight S&P 500 rose 0.73%, high-yield credit was flat and 10-year yields fell 20 basis points. This was an AI de-rating, not a risk-off event — here is the transmission chain, the 29,000 / 28,200 levels and what would prove it wrong.
Author  Irene Q.
Oct 23, Fri
The Nasdaq Composite fell 2.60% to 26,008.86 on October 22, its worst session since June, as Meta sank 6.98% on 2026 capex guidance of $135–145 billion. But the equal-weight S&P 500 rose 0.73%, high-yield credit was flat and 10-year yields fell 20 basis points. This was an AI de-rating, not a risk-off event — here is the transmission chain, the 29,000 / 28,200 levels and what would prove it wrong.
placeholder
Brent tops $113 on Saudi supply risk — but the diesel line in the EIA report is the tellBrent's December contract settled at $113.17 on October 22, up 4.00% and the highest close since May 4, after Saudi Arabia restricted refined-product shipments. The same session's EIA report showed crude stocks down 3.06 million barrels and gasoline down 2.95 million — but distillates built 1.68 million. That single line decides whether $113 holds: here are the data, the 108.8 / 114.0 / 119.3 levels and the two scenarios.
Author  Irene Q.
Oct 23, Fri
Brent's December contract settled at $113.17 on October 22, up 4.00% and the highest close since May 4, after Saudi Arabia restricted refined-product shipments. The same session's EIA report showed crude stocks down 3.06 million barrels and gasoline down 2.95 million — but distillates built 1.68 million. That single line decides whether $113 holds: here are the data, the 108.8 / 114.0 / 119.3 levels and the two scenarios.
goTop
quote