


Dogecoin Price Forecast: What’s next as DOGE whales de-risk amid low wallet activity
- Dogecoin risks extending its decline toward $0.20, mirroring suppressed market sentiment.
- Large volume holders offload Dogecoin, suggesting de-risking narratives as cryptocurrencies trim short-term gains.
- Low Daily Active Addresses could be a catalyst for a steady Dogecoin sell-off.
Dogecoin (DOGE) recovery has become elusive, worsened by risk-off sentiment in the broader cryptocurrency market. A 5% decline on Monday sees the largest meme coin by market capitalization exchange hands below $0.22 at the time of writing.
Interest in DOGE remains shaky based on derivatives data. The futures Open Interest (OI) is down to $3.54 billion after peaking at approximately $5.35 billion on July 22. A steady decline in OI implies weak market sentiment, resulting in fewer traders betting on short-term price increases.
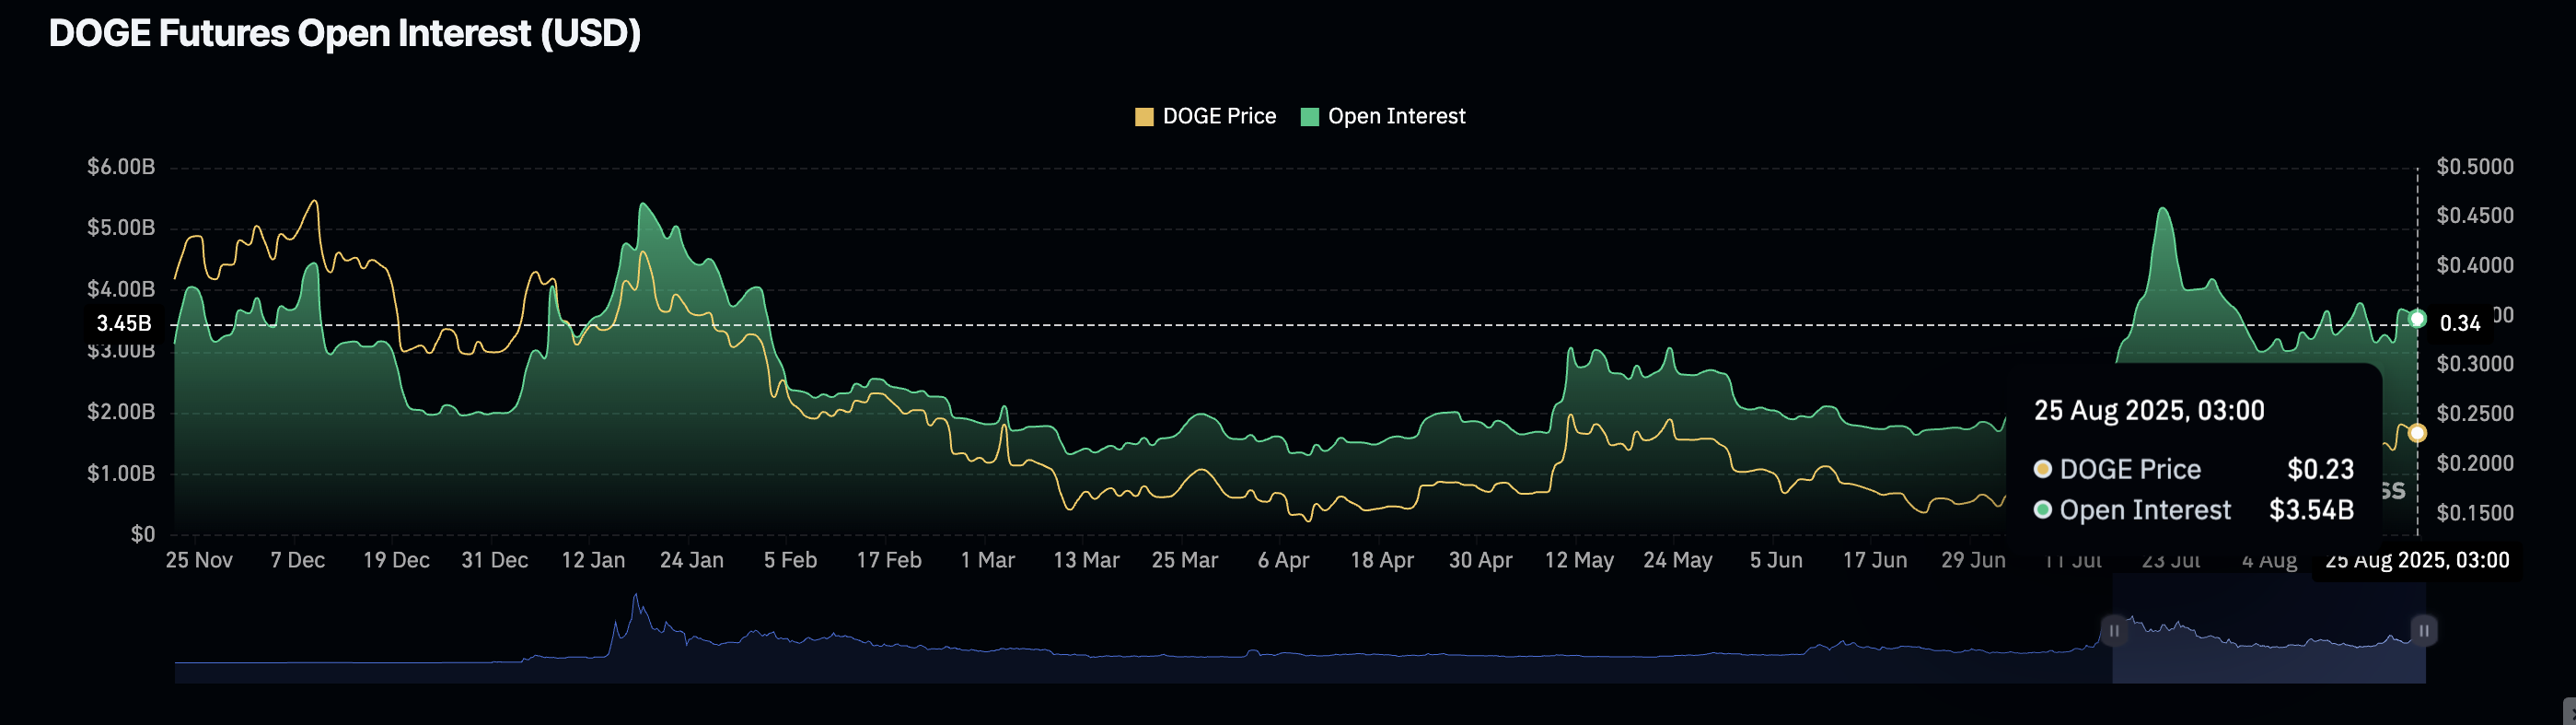
Dogecoin Futures Open Interest | Source: CoinGlass
Dogecoin whales de-risk amid risk-off sentiment
Large volume holders of DOGE have, over the past few weeks, persistently reduced exposure to Dogecoin, reflecting risk-off sentiment while suppressing upward price movement.
Addresses with between 10 million and 100 million coins account for 16.11% of the total supply, down from 16.85% recorded on July 17. The black line on the chart below shows that a recovery is underway, but may require time to establish an uptrend.
 [18-1756137905334-1756137905334.09.32, 25 Aug, 2025].png)
Dogecoin Supply Distribution | Source: Santiment
The number of Daily Active Addresses remains significantly suppressed, according to Santiment’s on-chain data. About 47,000 addresses interacted with the network on Sunday compared to 517,000 on June 21 and 675,000 addresses on May 14.
Fewer active addresses indicate low demand for DOGE – a condition likely to keep the price of DOGE on the back foot, searching for robust support.
 [18-1756137920617-1756137920617.09.20, 25 Aug, 2025].png)
Dogecoin Active Addresses | Source: Santiment
Technical outlook: Dogecoin holds above trendline support
Dogecoin price is struggling to hold $0.22 pivotal level as sellers maintain control over the trend. The Moving Average Convergence Divergence (MACD) indicator’s sell signal and the Relative Strength Index (RSI), which is extending the decline below the midline, reinforce the bearish outlook.
Traders will likely continue reducing exposure with the blue MACD line remaining below the red signal line. Apart from the ascending trendline support on the daily chart below, other key areas of interest for traders include the confluence established by the 100-day Exponential Moving Average (EMA) and the 200-day EMA at $0.21.
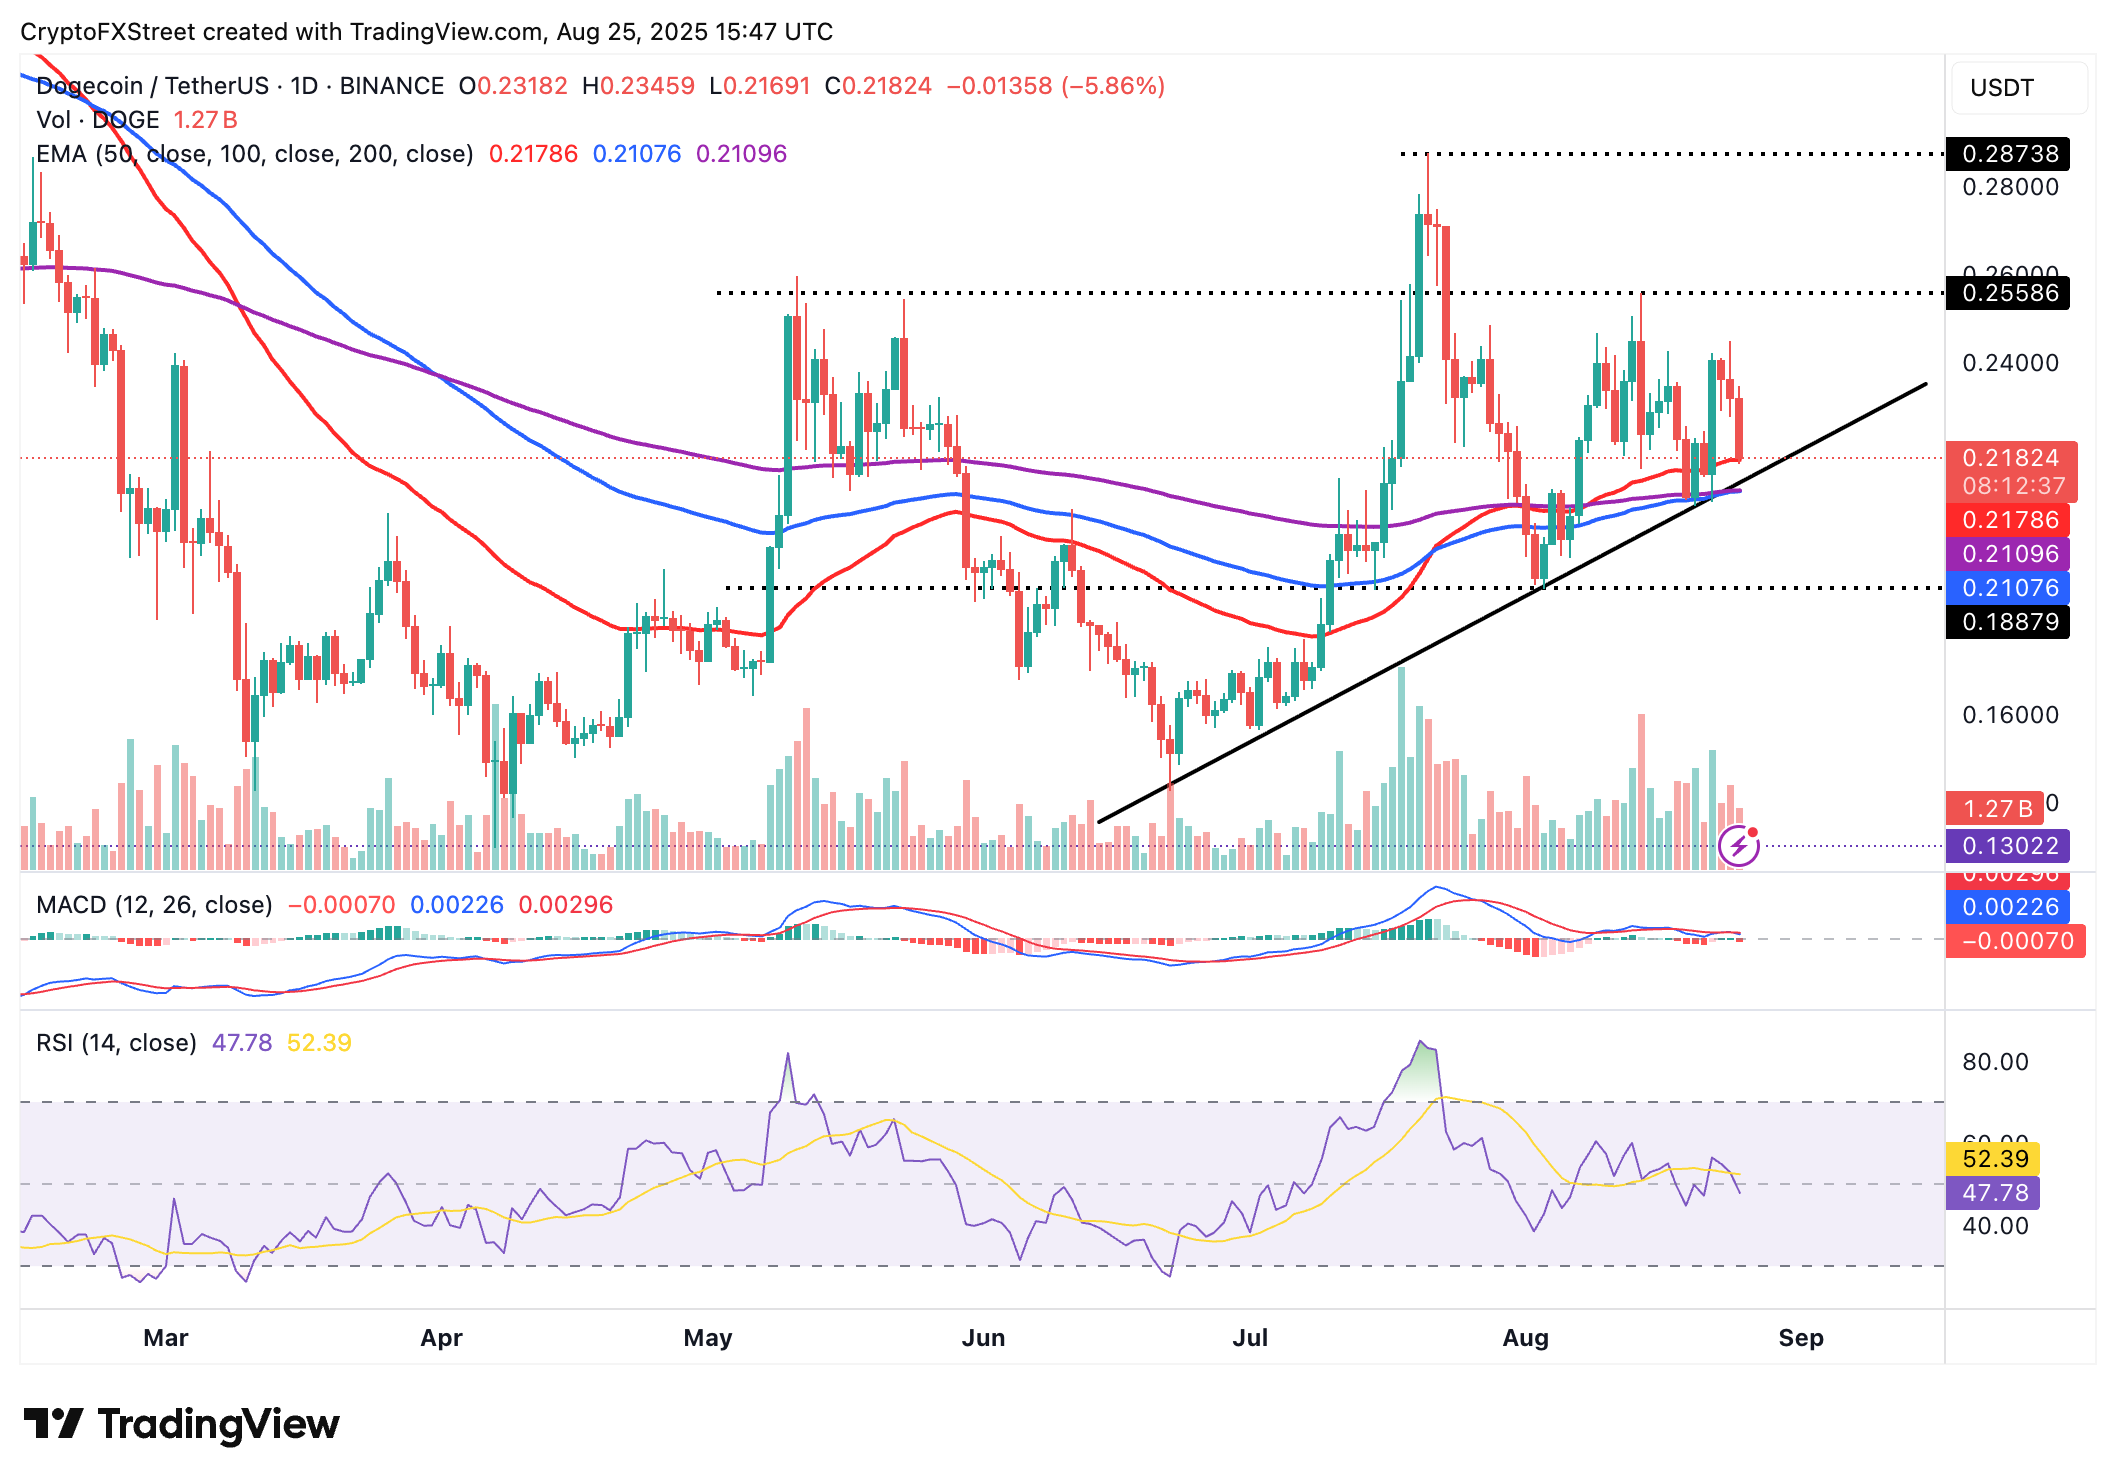
DOGE/USDT daily chart
If the sell-off intensifies due to rampant de-risking among whales and retail investors, support at $0.18 and $0.16 would be in line to absorb the selling pressure.
Still, the 50-day EMA at $0.21 could back a trend reversal, allowing bulls to reclaim support at $0.22 and affirm their influence ahead of the next leg up toward the critical $0.25 resistance.
Cryptocurrency metrics FAQs
The developer or creator of each cryptocurrency decides on the total number of tokens that can be minted or issued. Only a certain number of these assets can be minted by mining, staking or other mechanisms. This is defined by the algorithm of the underlying blockchain technology. On the other hand, circulating supply can also be decreased via actions such as burning tokens, or mistakenly sending assets to addresses of other incompatible blockchains.
Market capitalization is the result of multiplying the circulating supply of a certain asset by the asset’s current market value.
Trading volume refers to the total number of tokens for a specific asset that has been transacted or exchanged between buyers and sellers within set trading hours, for example, 24 hours. It is used to gauge market sentiment, this metric combines all volumes on centralized exchanges and decentralized exchanges. Increasing trading volume often denotes the demand for a certain asset as more people are buying and selling the cryptocurrency.
Funding rates are a concept designed to encourage traders to take positions and ensure perpetual contract prices match spot markets. It defines a mechanism by exchanges to ensure that future prices and index prices periodic payments regularly converge. When the funding rate is positive, the price of the perpetual contract is higher than the mark price. This means traders who are bullish and have opened long positions pay traders who are in short positions. On the other hand, a negative funding rate means perpetual prices are below the mark price, and hence traders with short positions pay traders who have opened long positions.
Recommended Articles


