


Bitcoin Price Forecast: BTC hovers around $120,000 resistance, catching up with Gold in YTD returns
- Bitcoin price flirts with resistance at $120,000, close to record highs.
- US CPI came slightly softer than expected, boosting rate-cut bets and igniting a risk-on rally.
- BTC gains 28% so far in 2025, similar to Gold’s year-to-date returns.
Bitcoin (BTC) price trades above its key resistance at $120,000 at the time of writing on Wednesday, near the record high, fueled by improved market sentiment after the US Consumer Price Index (CPI) data came slightly softer than expected on Tuesday. Moderate inflation levels strengthen the case for a September Federal Reserve (Fed) rate cut and beyond, a scenario that bodes well for risk assets such as Bitcoin.
Bitcoin overtakes Gold in performance
Bitcoin price has been faring well in the past few months, reaching an all-time high of $123,218 in July.
The graph below shows that BTC has caught up with Gold in year-to-date returns, posting a 28% gain, similar to Gold, indicating market participants might be treating Bitcoin as a viable store of value alongside Gold.
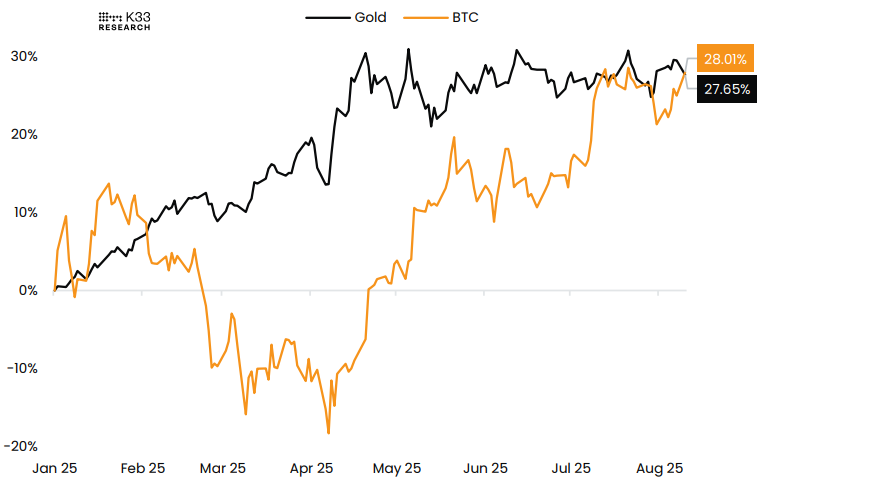
Year to date: BTC vs. Gold chart. Source: K33 Research
US CPI came in softer, boosting risk-off sentiment
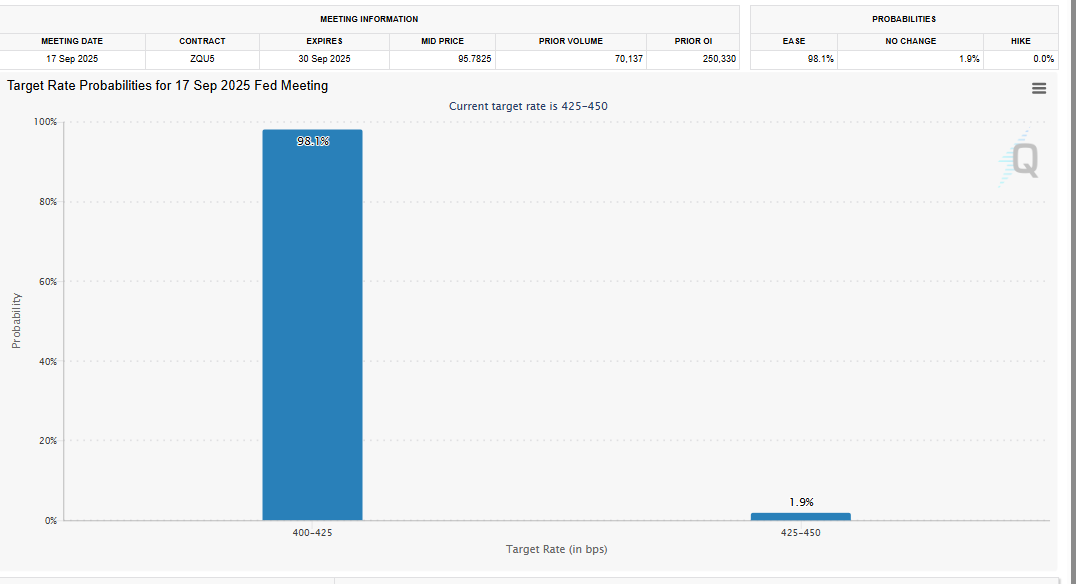
The US Bureau of Labor Statistics reported on Tuesday that the Consumer Price Index (CPI) data came slightly softer than expected — strengthening the case for a September Fed rate cut, with odds of a 25 basis points (bps) rate cut currently stand at 98%, according to CME Group's FedWatch Tool.
Meanwhile, US Treasury Secretary Scott Bessent said in an interview on Fox Business on Tuesday that the Fed should go for a larger, 50-basis-point rate cut:
The real thing now to think about is should we get a 50 basis-point rate cut in September. He said that two days after the US Federal Reserve left rates unchanged on July 30, revised data showed weaker job growth for May and June than official figures had previously indicated, suggesting the Fed “could have been cutting in June, July.
This slightly softer-than-expected data has ignited a risk-on rally for riskier assets such as Bitcoin.
Norway’s sovereign wealth fund’s indirect BTC exposure hits all-time high
A K33 Research report on Tuesday noted that Norway’s sovereign wealth fund (NBIM) currently holds an indirect exposure of 7,161 BTC, derived from its investments in companies with Bitcoin on their balance sheets. The firm’s indirect BTC exposure has been on a rising trend over the past five years, reaching all-time highs and driven largely by the accelerating Bitcoin treasury strategies of both new and established companies like Strategy.
“This exposure is likely an unintended byproduct of NBIM’s diversified portfolio rather than a strategic decision, but it highlights Bitcoin’s deepening integration into mainstream Finance. With the BTC treasury trend gaining momentum, most index or broad-market investors are likely to have similar indirect exposure,” said a K33 analyst.
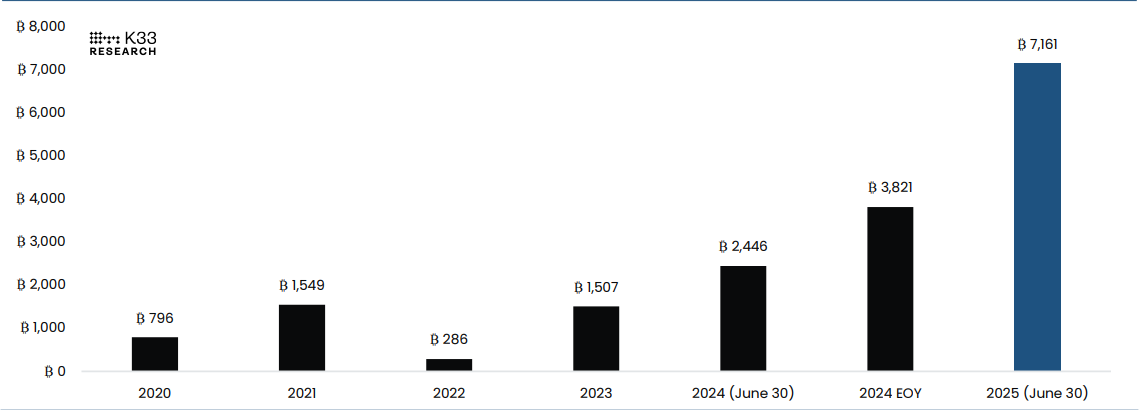
NBIM’s year-end indirect exposure to BTC chart. Source: K33 Research
Bitcoin Price Forecast: BTC nears key resistance at $120,000
Bitcoin price faced resistance around its key psychological level barrier at $120,000 on Monday and declined slightly. However, it reattempted to close above this resistance the next day but failed again. At the time of writing on Wednesday, it trades above this resistance at around $120,700.
If BTC closes above the $120,000 psychological level on a daily basis, it could extend the rally toward its record high of $123,218. If a successful close above this level occurs, BTC would enter price discovery mode with bulls targeting the psychological level of $125,000.
The Relative Strength Index (RSI) on the daily chart reads 63, above its neutral level of 50, indicating strong bullish momentum. The Moving Average Convergence Divergence (MACD) showed a bullish crossover on Monday, giving a buy signal.
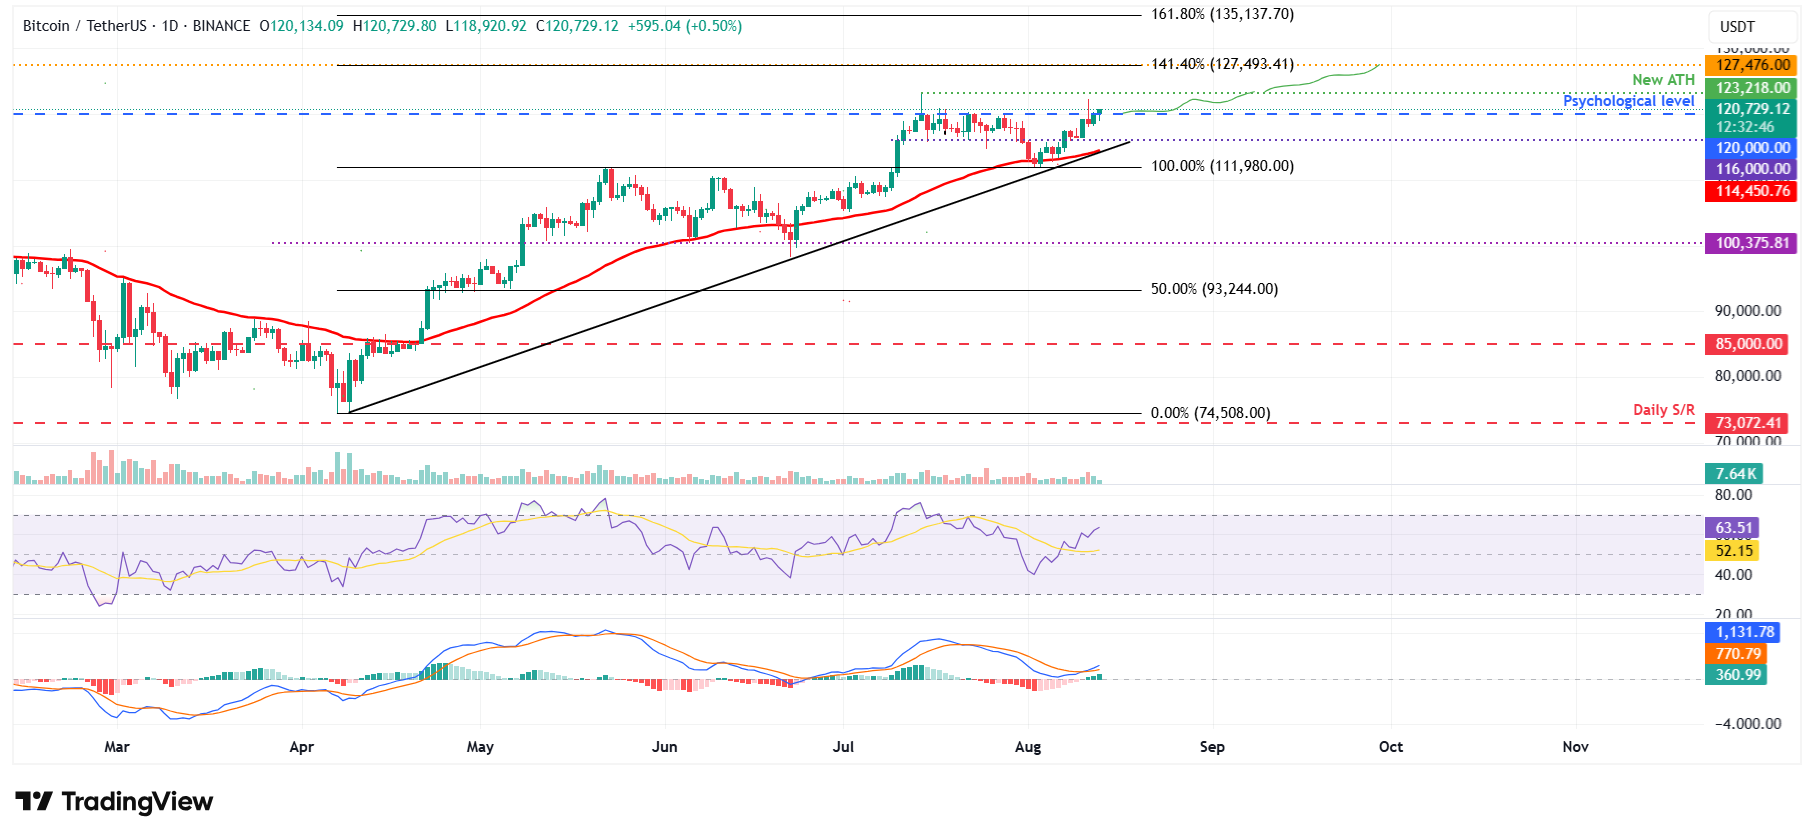
BTC/USDT daily chart
If BTC faces a correction from its $120,000 level, it could extend the decline to find support around the daily level at $116,000.
Bitcoin, altcoins, stablecoins FAQs
Bitcoin is the largest cryptocurrency by market capitalization, a virtual currency designed to serve as money. This form of payment cannot be controlled by any one person, group, or entity, which eliminates the need for third-party participation during financial transactions.
Altcoins are any cryptocurrency apart from Bitcoin, but some also regard Ethereum as a non-altcoin because it is from these two cryptocurrencies that forking happens. If this is true, then Litecoin is the first altcoin, forked from the Bitcoin protocol and, therefore, an “improved” version of it.
Stablecoins are cryptocurrencies designed to have a stable price, with their value backed by a reserve of the asset it represents. To achieve this, the value of any one stablecoin is pegged to a commodity or financial instrument, such as the US Dollar (USD), with its supply regulated by an algorithm or demand. The main goal of stablecoins is to provide an on/off-ramp for investors willing to trade and invest in cryptocurrencies. Stablecoins also allow investors to store value since cryptocurrencies, in general, are subject to volatility.
Bitcoin dominance is the ratio of Bitcoin's market capitalization to the total market capitalization of all cryptocurrencies combined. It provides a clear picture of Bitcoin’s interest among investors. A high BTC dominance typically happens before and during a bull run, in which investors resort to investing in relatively stable and high market capitalization cryptocurrency like Bitcoin. A drop in BTC dominance usually means that investors are moving their capital and/or profits to altcoins in a quest for higher returns, which usually triggers an explosion of altcoin rallies.
Recommended Articles


