


Pi Network Price Forecast: Repeating pattern breakout fuels hopes of uptrend
- Pi Network’s PI token breaks out of a repeating Adam and Eve pattern, hinting at a trend reversal.
- A large wallet investor that holds more PI than any individual exchange adds over 984,000 tokens.
- The technical outlook remains mixed as the spark of bullish momentum wanes.
Pi Network (PI) edges higher by 3% at press time on Monday, holding above the $0.4000 level price broke from a bullish pattern breakout on Friday. Betting heavily on a bullish recovery, large wallet investors — popularly known as whales — buy in large quantities.
Still, the technical outlook remains mixed as bullish momentum appears to be cooling down.
Whales buy the retest dip in Pi token
PiScan data shows that, out of the five largest transactions on Pi Network over the last 24 hours, four transactions include a whale acquiring PI tokens from the OKX exchange. In total, the whale buying spree grabbed over 2.25 million PI tokens worth approximately $901,500.
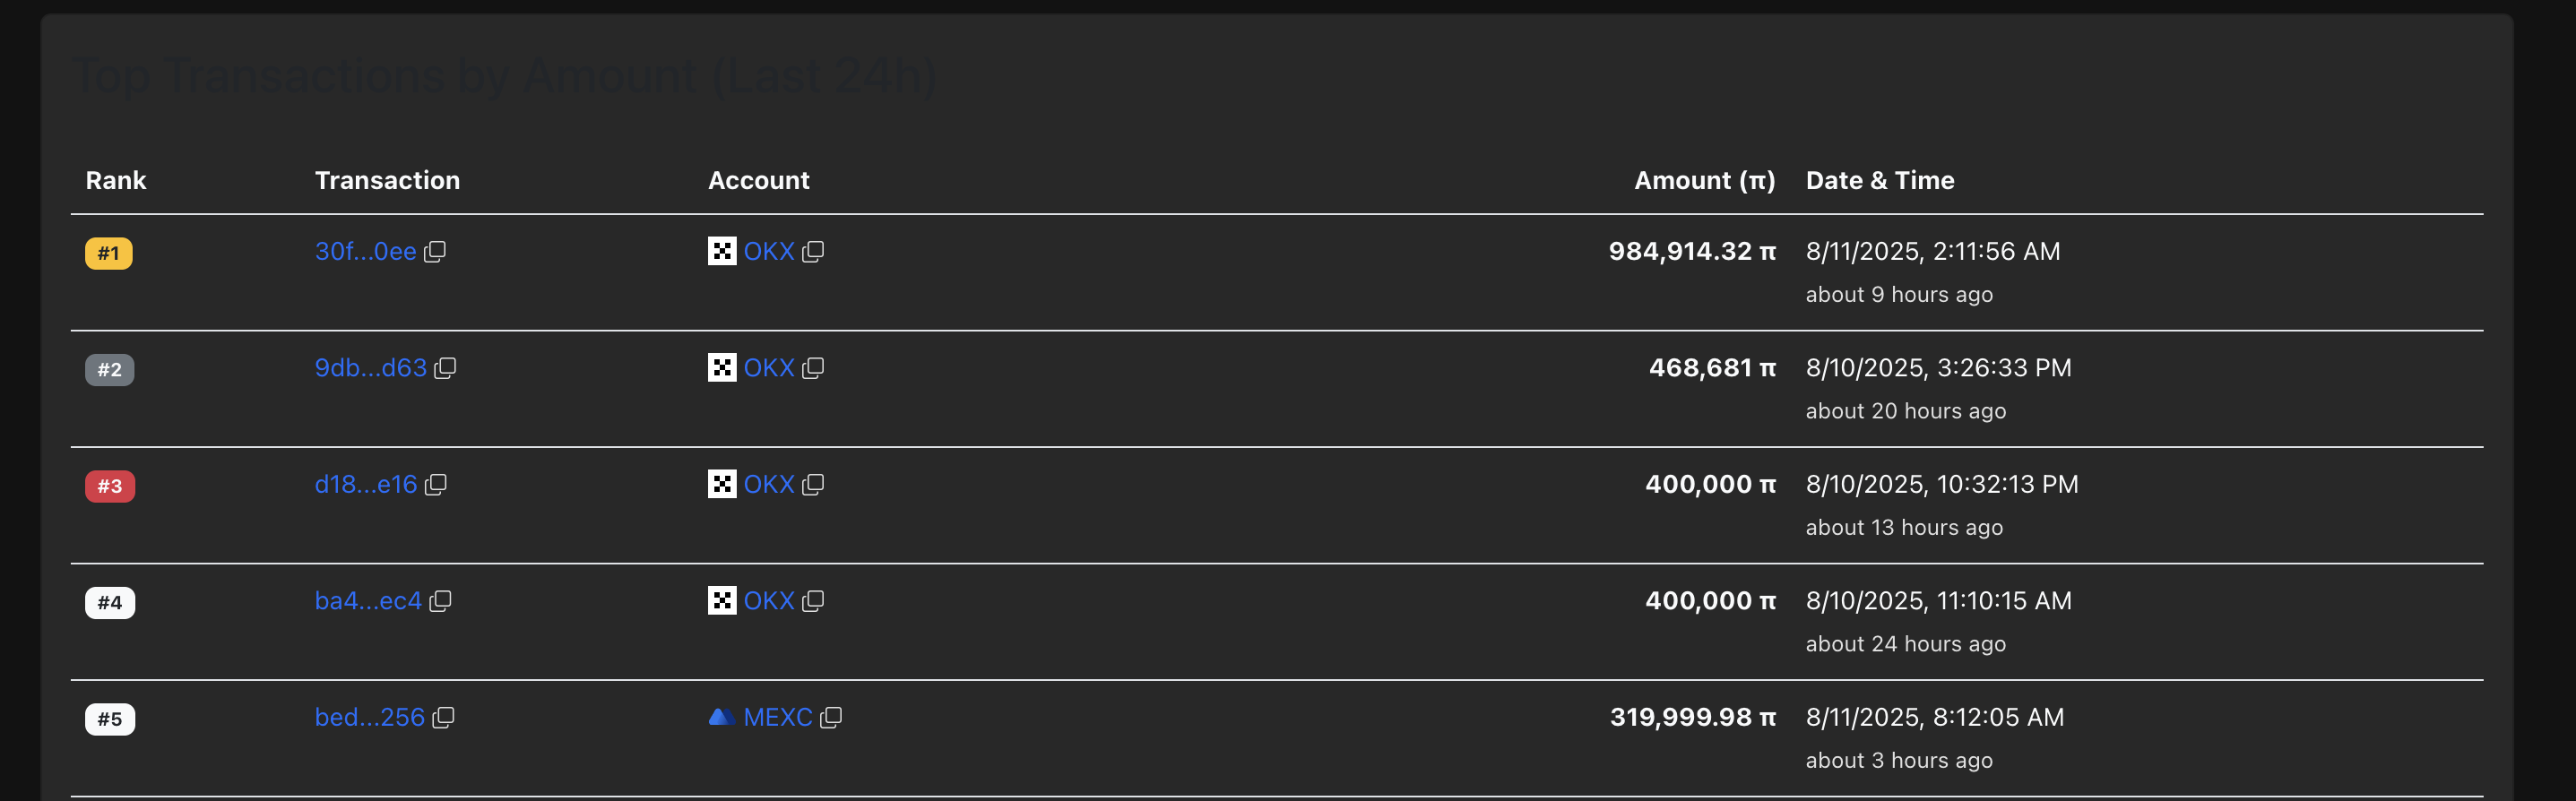
Large transaction data. Source: PiScan
Notably, a large-wallet investor made a purchase of 984,914 Pi tokens over the last 24 hours, increasing its holdings to 351.74 million tokens. As of Monday, PiScan data indicate that the investor’s PI token holding exceeds that of any individual centralized exchange (CEX).
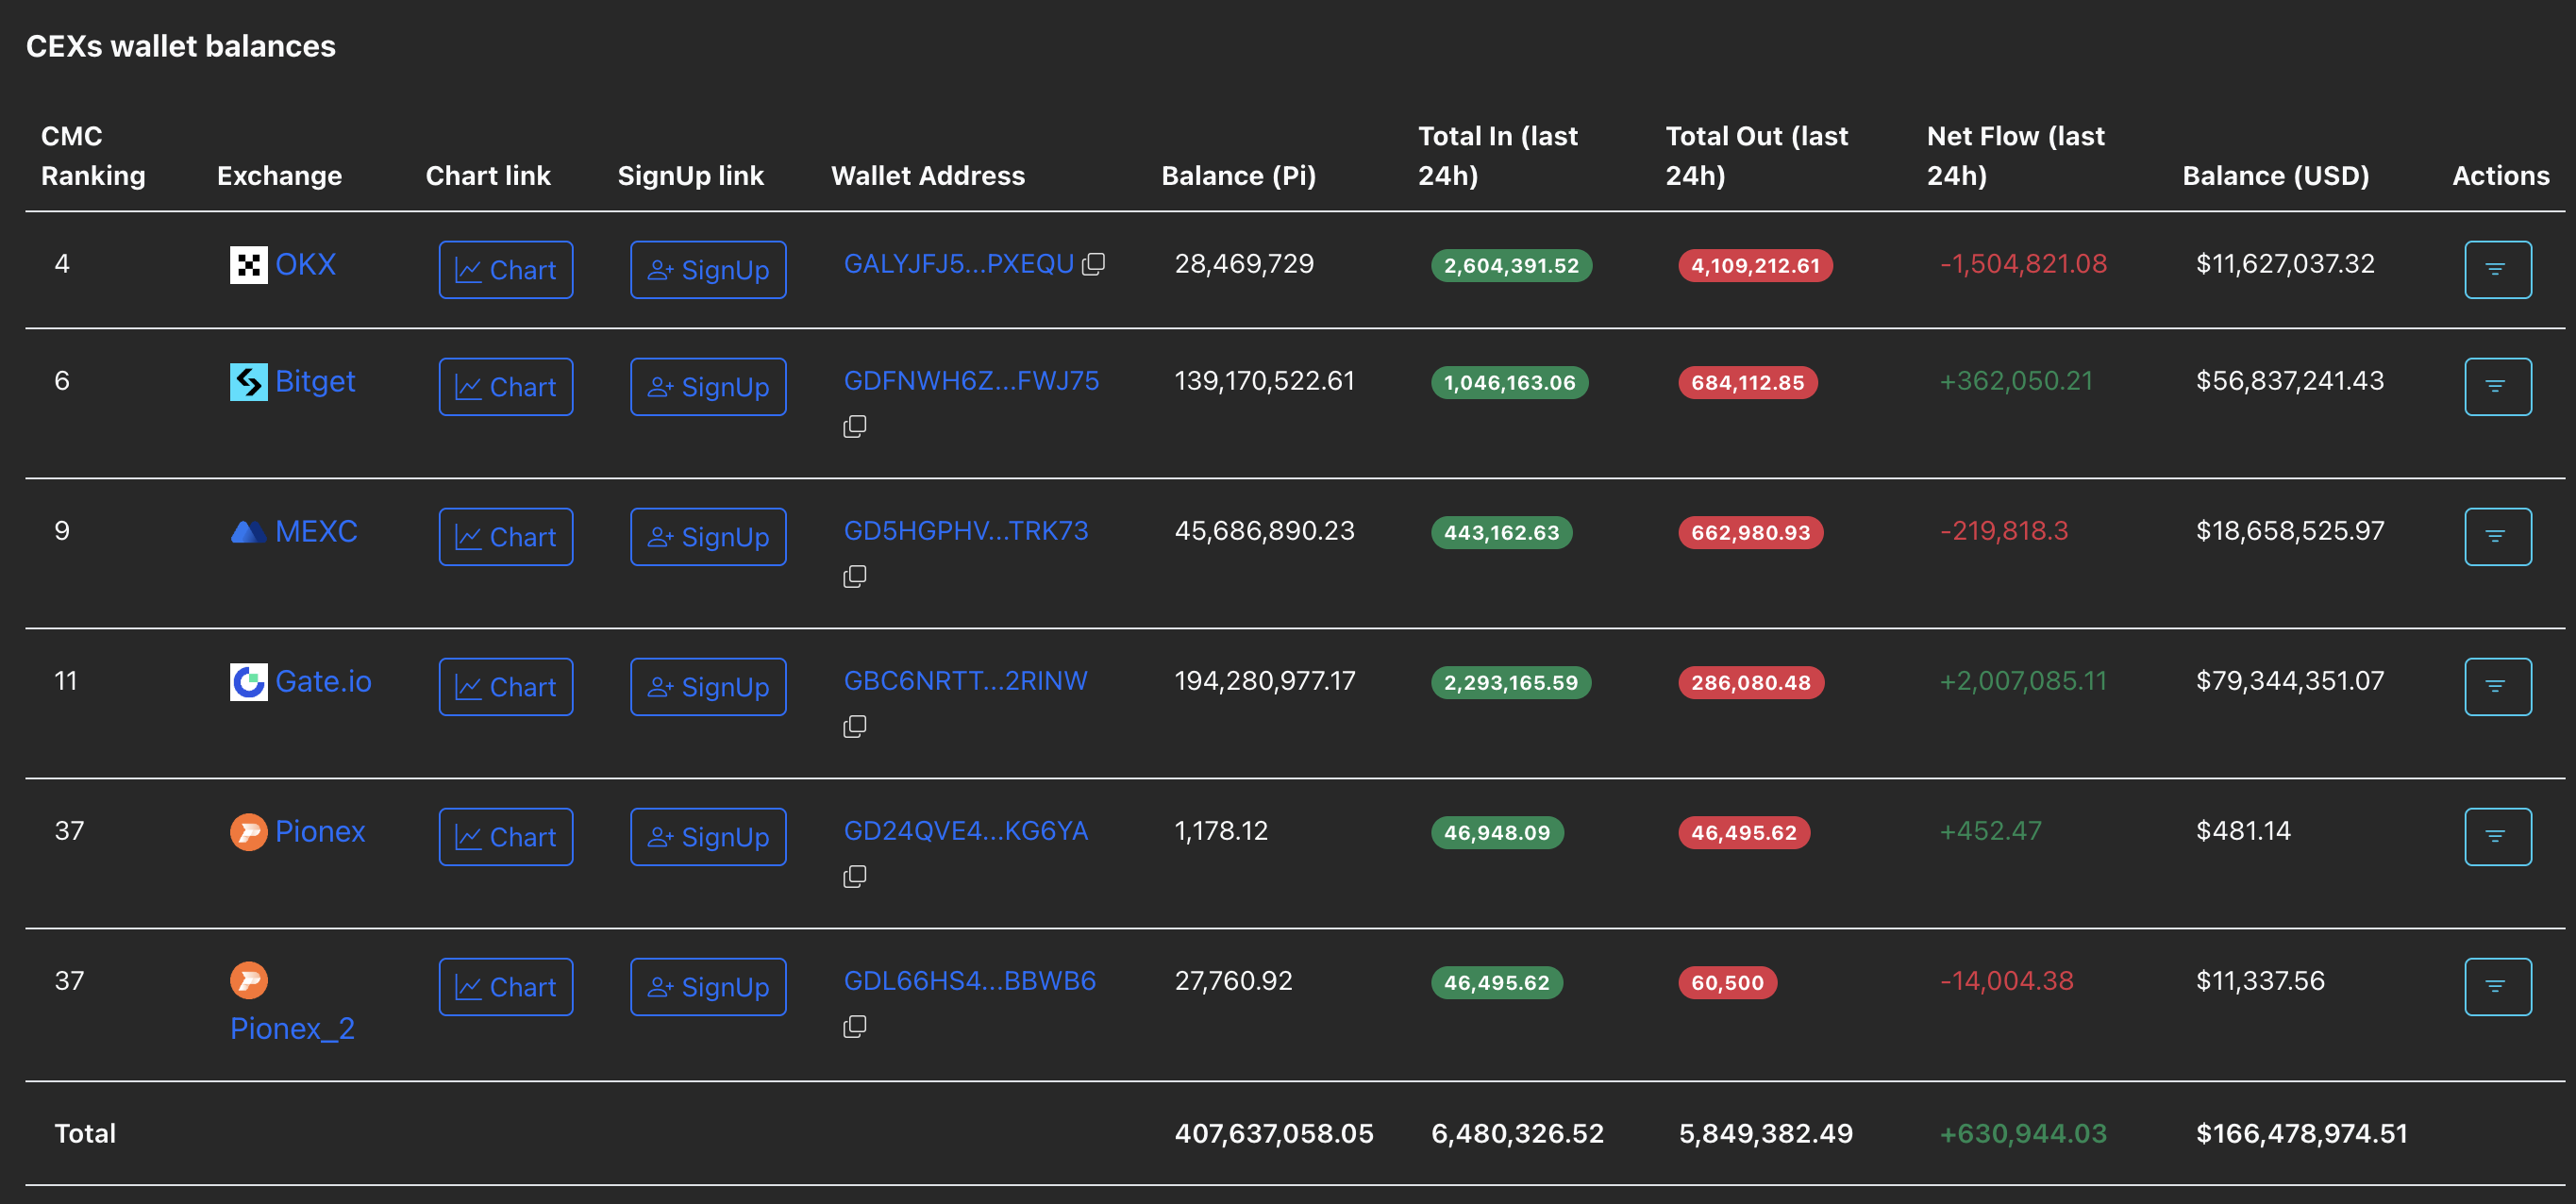
CEXs wallet balances. Source: PiScan
Pi Network breakout rally retests $0.40
The PI token rebounded with the repeating Adam and Eve pattern breakout on Friday, peaking at $0.4661 on Sunday before closing the day in the red at $0.3950. The PI token finds support on the 50-period Exponential Moving Average (EMA) at $0.3863 on the 4-hour chart, bouncing off over 3% so far on Monday and reclaiming its hold over $0.4000.
The Relative Strength Index (RSI) at 58 holds a sideways trend above the halfway line after slipping lower from the overbought zone on the same time frame. This suggests a cool-off in buying pressure, creating room for growth.
Similarly, the Moving Average Convergence Divergence (MACD) line moves flat after flashing a sell signal as it crossed below its signal line on Sunday.
If the PI token reclaims the 200-period EMA at $0.4271, it could extend the rally to the $0.4734 level, last tested on July 23.
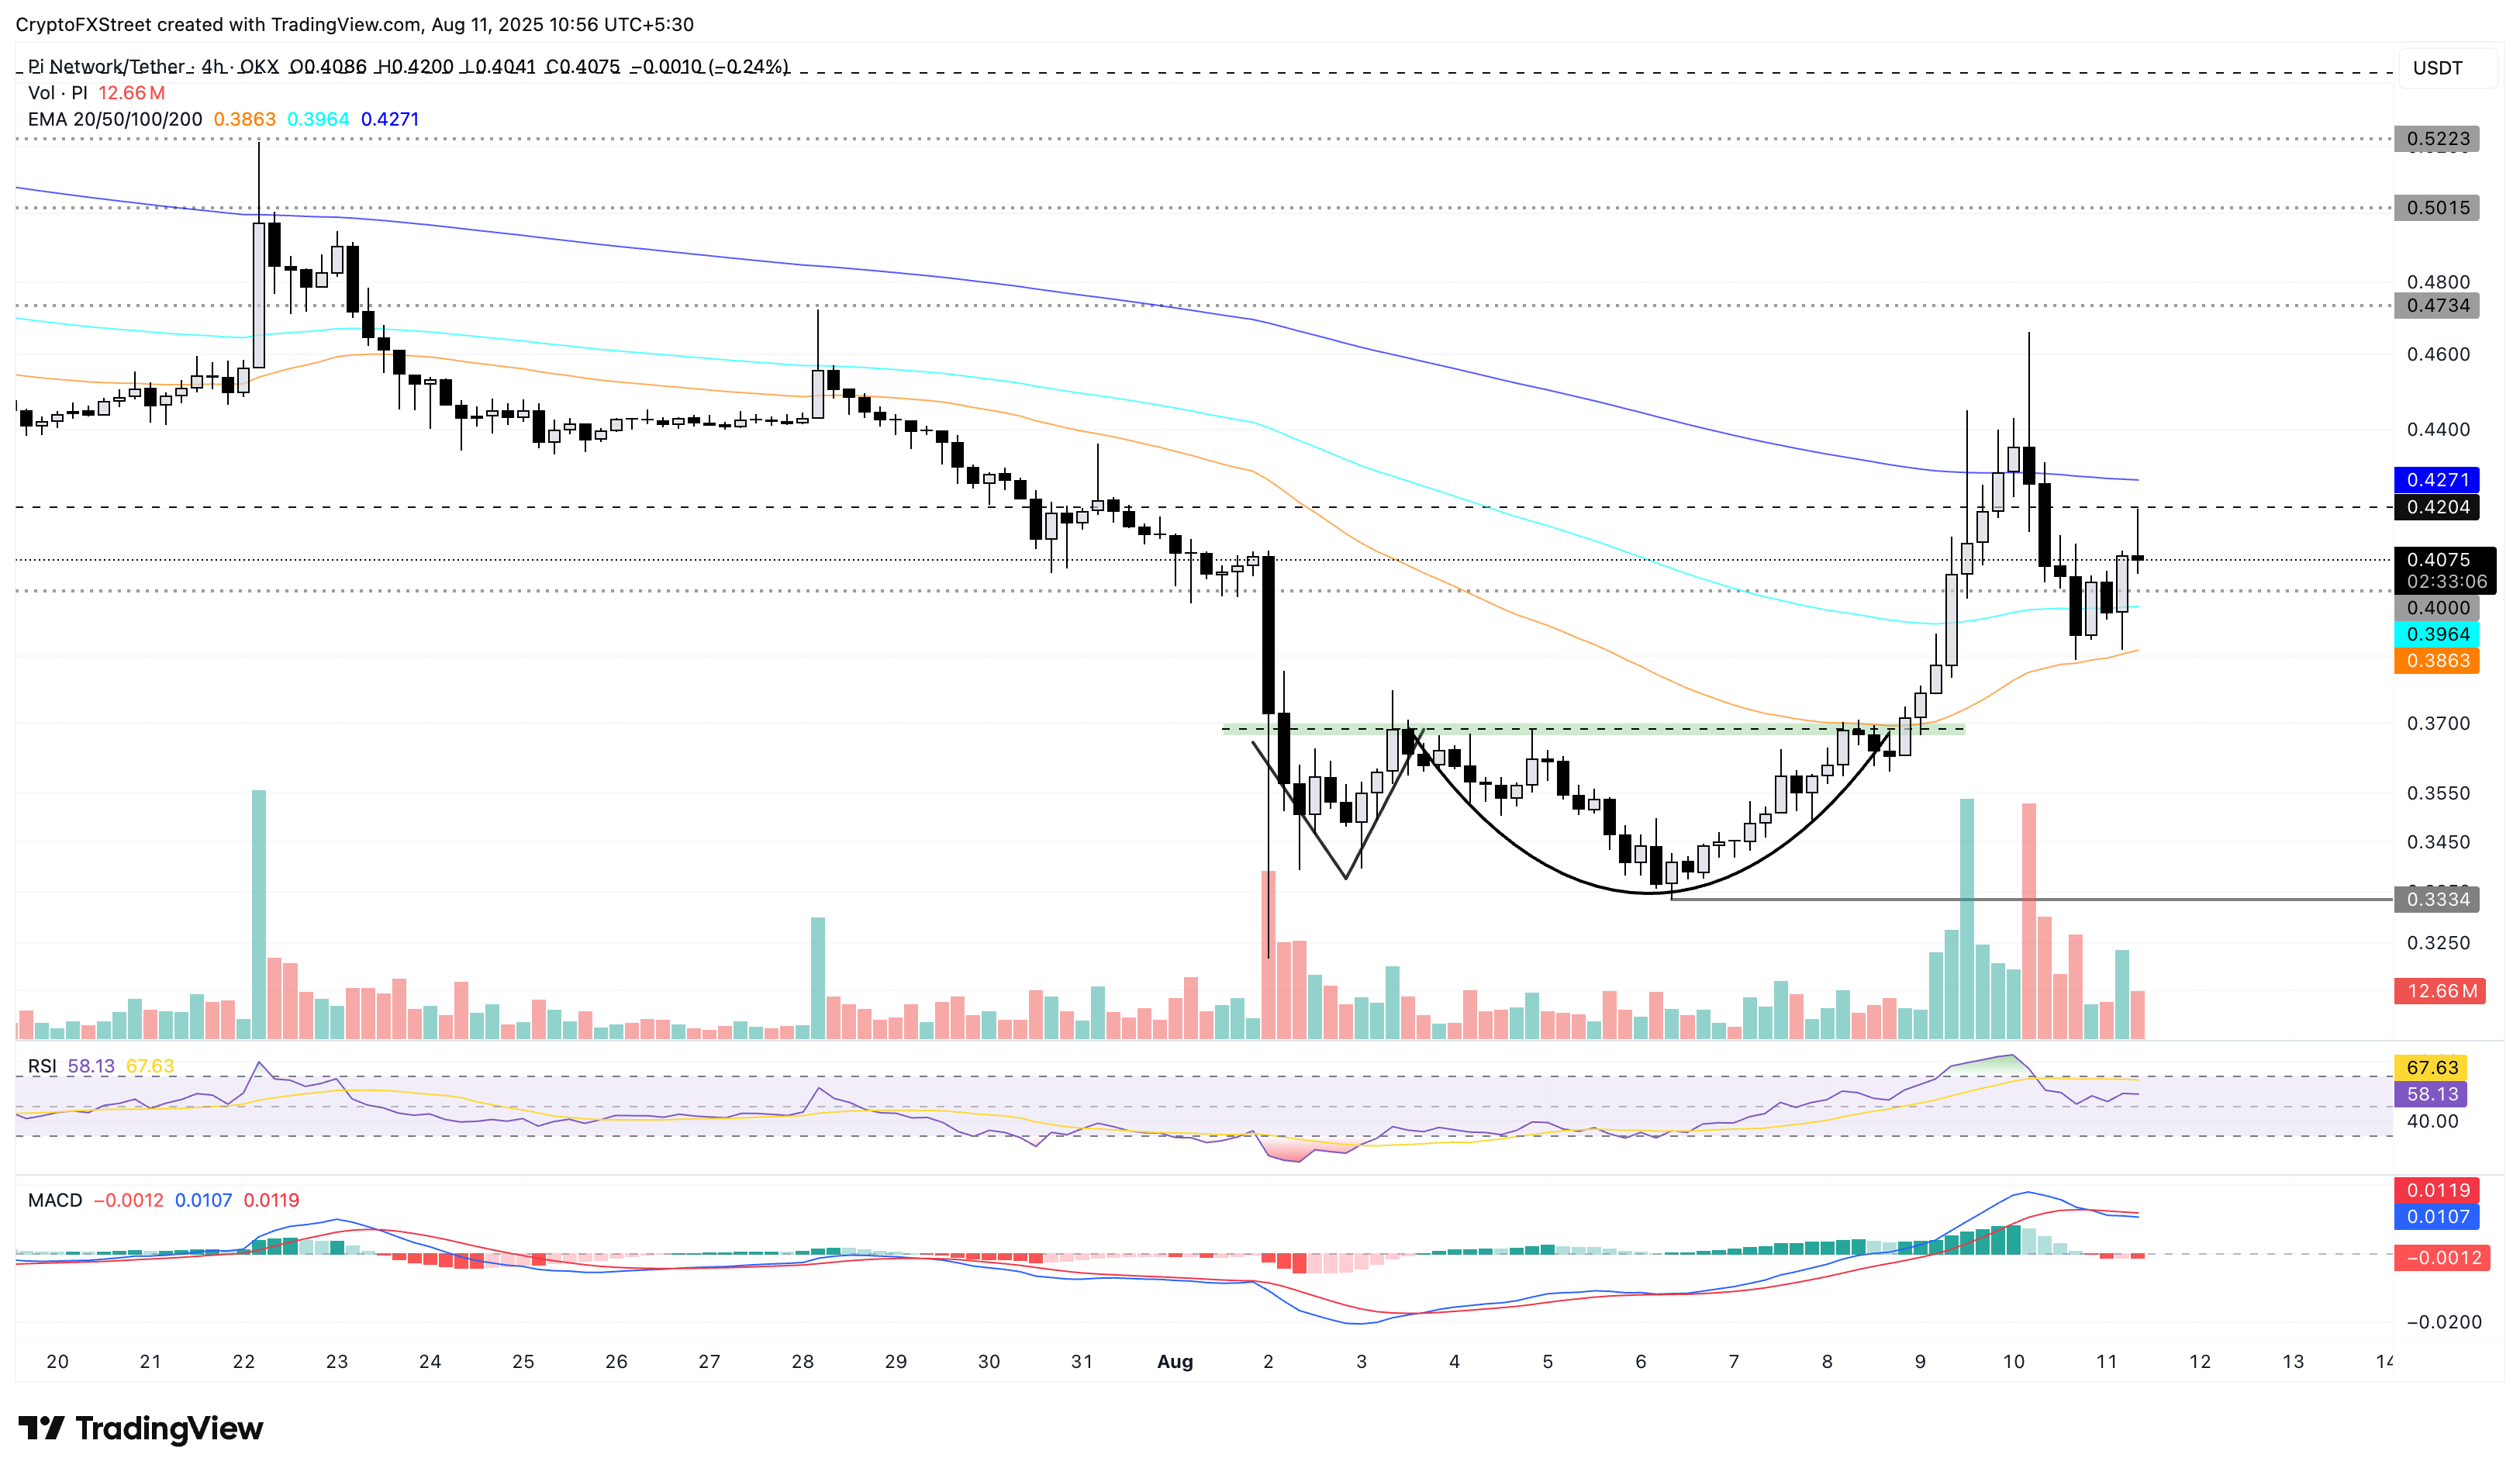
PI/USDT daily price chart.
On the contrary, if the 100-period EMA near the $0.4000 level fails to uphold bullish support, the PI token could retest the 50-period EMA at $0.3864.
Bitcoin, altcoins, stablecoins FAQs
Bitcoin is the largest cryptocurrency by market capitalization, a virtual currency designed to serve as money. This form of payment cannot be controlled by any one person, group, or entity, which eliminates the need for third-party participation during financial transactions.
Altcoins are any cryptocurrency apart from Bitcoin, but some also regard Ethereum as a non-altcoin because it is from these two cryptocurrencies that forking happens. If this is true, then Litecoin is the first altcoin, forked from the Bitcoin protocol and, therefore, an “improved” version of it.
Stablecoins are cryptocurrencies designed to have a stable price, with their value backed by a reserve of the asset it represents. To achieve this, the value of any one stablecoin is pegged to a commodity or financial instrument, such as the US Dollar (USD), with its supply regulated by an algorithm or demand. The main goal of stablecoins is to provide an on/off-ramp for investors willing to trade and invest in cryptocurrencies. Stablecoins also allow investors to store value since cryptocurrencies, in general, are subject to volatility.
Bitcoin dominance is the ratio of Bitcoin's market capitalization to the total market capitalization of all cryptocurrencies combined. It provides a clear picture of Bitcoin’s interest among investors. A high BTC dominance typically happens before and during a bull run, in which investors resort to investing in relatively stable and high market capitalization cryptocurrency like Bitcoin. A drop in BTC dominance usually means that investors are moving their capital and/or profits to altcoins in a quest for higher returns, which usually triggers an explosion of altcoin rallies.
Recommended Articles


