
Gold retreats below $3,200 as safe-haven demand fades, down over $300 from record high
- XAU/USD trades near $3,180, on track for a weekly loss of over 4%.
- Easing trade tensions and a stable geopolitical landscape reduce demand for the bullion.
- Price has fallen more than $300 from April’s all-time high of $3,500.
Gold (XAU/USD) continues to decline on Friday, falling toward $3,180 and marking a sharp weekly loss of over 4%, its biggest since November 2024. The precious metal has now shed over $300 from its record high of $3,500 set in April, as safe-haven demand weakens and technical selling accelerates.
Risk sentiment improved this week after the United States (US) and China agreed to reduce tariffs for 90 days, while geopolitical tensions remained muted with India-Pakistan and Middle East risks stabilizing. After a period of conflicting reports and diplomatic deadlock, Ukrainian and Russian officials finally opened direct talks for the first time since 2022.
In the latest macro release, the preliminary University of Michigan Consumer Sentiment Index for May fell sharply to 50.8, down from 52.2 in April and well below forecasts of 53.4. This reflects growing household concerns over persistent inflation and economic uncertainty. While this normally boosts Gold’s appeal, the market response has been muted, with traders focused on profit-taking and technical positioning instead.
This comes after a week of dovish US economic data, including softer-than-expected Consumer Price Index (CPI) and Producer Price Index (PPI) figures and a rise in Initial Jobless claims to a three-month high. Markets now price in at least two Federal Reserve (Fed) rate cuts in 2025, with the first likely in September. However, Fed Chair Jerome Powell cautioned that supply-driven shocks could reintroduce inflation volatility, complicating future monetary policy.
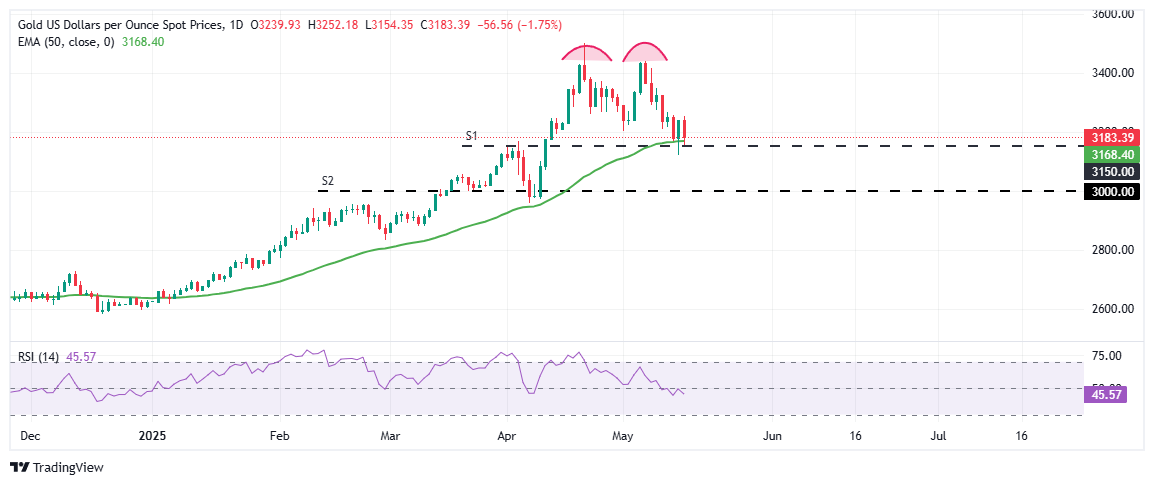
Technical analysis: XAU/USD weakens, double top signals bearish shift
From a technical perspective, the yellow metal remains under pressure heading into the weekend, trading near $3,180 after failing to hold above the psychological $3,200 mark. The daily chart reveals a bearish double top pattern, signaling a potential trend reversal from April’s record highs. The neckline of this pattern aligns closely with the $3,160–$3,150 support zone, which is also reinforced by the 50-day Exponential Moving Average (EMA) at $3,168. A decisive break below this zone could open the door for a deeper correction toward the $3,000 handle.
The Relative Strength Index (RSI) on the daily chart hovers near 45 below the neutral level, showing weakening bullish momentum and further confirming the bearish technical bias. Unless bulls reclaim the $3,250 psychological region with strong conviction, the path of least resistance for Gold remains tilted to the downside.
Recommended Articles


