

Crude Oil resumes choppy channel, WTI recovers $77.50

Source Fxstreet
  • Crude Oil markets continue to pattern into a sideways channel.
  • Barrel supplies continue to outpace demand that has failed to materialize.
  • Energy markets remain concerned about supply constraints that have yet to occur.

West Texas Intermediate (WTI) US Crude Oil rebounded on Monday after last week’s near-term decline, and WTI is once again trading back above $77.50 per barrel.

Concerns about global demand rising to outpace global barrel supply on the back of an expected explosion in Chinese Crude Oil demand have fizzled out, but markets remain concerned about barrel supply amidst Middle East geopolitical tensions and production caps from the Organization of the Petroleum Exporting Countries. According to a recent survey by Bloomberg, many energy market analysts expect OPEC to maintain current production caps through the second quarter in an attempt to keep Crude OIl supply low enough to keep prices high, but record pumping figures from non-OPEC countries, most notably the US, remains a key chink in the armor.

Geopolitical tensions remain high in the Red Sea as Houthis continue to target civilian shipping vessels. Crude Oil markets remain concerned about a possible kink in supply lines between Europe and Asia, keeping barrel bids elevated.

WTI technical outlook

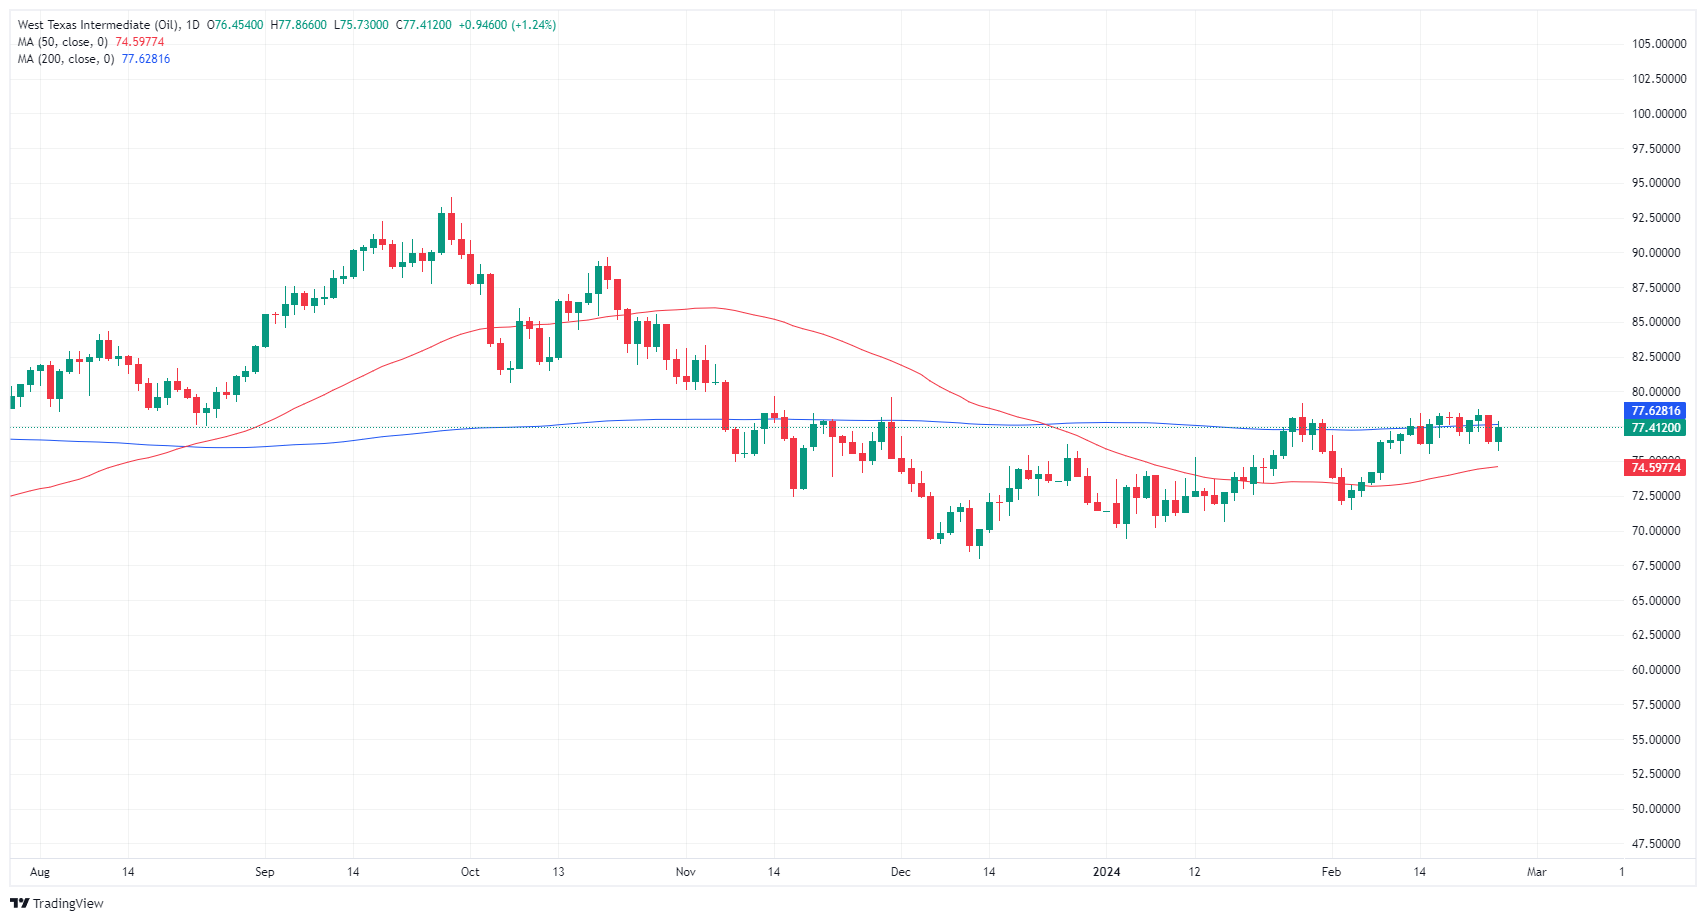
Choppy sideways trading has been the name of the game in WTI US Crude Oil recently. Intraday technicals have been increasingly chopping as US Crude Oil swings from one day to the next but largely remains capped below $79.00.

WTI prices have been hampered by the 200-day Simple Moving Average (SMA) at $77.62, a price that has seen Crude Oil spiral around since falling into the long-term region in November of 2022.

WTI hourly chart

WTI daily chart
 

Disclaimer: For information purposes only. Past performance is not indicative of future results.
placeholder
Bitcoin lost its 200-day average — but the exit started three sessions before the CPIBitcoin fell 2.5% to about $73,400 on 11 November, an 11-week low, breaking its 200-day moving average near $73,100. The 24-hour liquidation tally reached $632 to $705 million, roughly 82% of it longs. But spot ETF outflows began three sessions earlier and USDT's market cap has shrunk $6.6 billion in 60 days — the leveraged length left before the inflation print did. A double top at 81,890 and 81,080 leaves a measured target of 69,366.
Author  Suzie
14 hours ago
Bitcoin fell 2.5% to about $73,400 on 11 November, an 11-week low, breaking its 200-day moving average near $73,100. The 24-hour liquidation tally reached $632 to $705 million, roughly 82% of it longs. But spot ETF outflows began three sessions earlier and USDT's market cap has shrunk $6.6 billion in 60 days — the leveraged length left before the inflation print did. A double top at 81,890 and 81,080 leaves a measured target of 69,366.
placeholder
Core CPI stuck at 0.3% for a third straight month — and BLS couldn't publish the number that would explain itOctober headline CPI rose 0.4% m/m against a 0.3% consensus, and core rose 0.3% for a third consecutive month against 0.2% expected. BLS published no year-on-year figures because October 2025 collection was lost to the government shutdown. Energy cooled to 0.7% from 5.2% — shelter, food and transport services did the rest. The 2-year yield jumped 18 to 21 basis points, the 10-year added 12, and the dollar closed at 102.25.
Author  Irene Q.
15 hours ago
October headline CPI rose 0.4% m/m against a 0.3% consensus, and core rose 0.3% for a third consecutive month against 0.2% expected. BLS published no year-on-year figures because October 2025 collection was lost to the government shutdown. Energy cooled to 0.7% from 5.2% — shelter, food and transport services did the rest. The 2-year yield jumped 18 to 21 basis points, the 10-year added 12, and the dollar closed at 102.25.
placeholder
Gold Tumbles Toward $4,000 as Hotter-Than-Expected CPI Boosts Fed Rate-Hike Bets, Bulls Eye $3,975 SupportAs of the Asian session on Wednesday (November 11), gold prices (XAUUSD) rebounded slightly after a sharp decline in the previous session, last trading near $4,040, up about 0.3% on the d
Author  TradingKey
15 hours ago
As of the Asian session on Wednesday (November 11), gold prices (XAUUSD) rebounded slightly after a sharp decline in the previous session, last trading near $4,040, up about 0.3% on the d
placeholder
Gold Price Analysis Today | Forex Gold Analysis | XAU/USD Analysis - November 11, 2026Get the latest gold price analysis, forex gold insights, and XAU/USD analysis for November 11, 2026. Read on for the details.
Author  Mitrade
15 hours ago
Get the latest gold price analysis, forex gold insights, and XAU/USD analysis for November 11, 2026. Read on for the details.
placeholder
TradingKey Daily Market Briefing: US Stocks Retreat as CPI Tops Estimates; Nvidia Falls Over 5%, AMD and Broadcom Buck the Trend On November 10, the three major U.S. stock indices edged lower. U.S. October inflation data exceeded market expectations, driving Treasury yields rapidly higher and
Author  TradingKey
16 hours ago
On November 10, the three major U.S. stock indices edged lower. U.S. October inflation data exceeded market expectations, driving Treasury yields rapidly higher and
goTop
quote