

Natural Gas steadies as Iran accuses Israel of pipeline explosion
- Natural Gas eases a touch after its 12% intraday rally on Wednesday.
- Traders see upside potential for Gas prices as supply issues mount.
- The US Dollar Index falls below 104.00 as market mood improves.
Natural Gas (XNG/USD) is locking in its position above $1.80 on Thursday after booking over 12% gains on Wednesday. Price increases are driven by increasing geopolitical tensions in the Middle East and increasing supply woes. Iran’s Oil minister Javad Owji accused Israel of sabotaging its main Gas pipeline and blamed the country for a series of attacks that are targeting Iran’s nuclear program. On the supply side, Chesapeake Energy reported it will cut its Natural Gas production by 20%, whileNorwegian and US LNG exports are seen stalling or substantially falling..
The US Dollar (USD) is facing a steep decline despite geopolitical tensions arising further, with The US Dollar Index (DXY) sliding below 104.00 following a wave of risk-on after upbeat Nvidia earnings and the Fed Minutes not bearing any surprise.
Natural Gas is trading at $1.86 per MMBtu at the time of writing.
Natural Gas market movers: Supply side narrowing even further
- The overall Gas supply just got smaller, with Chesapeake reducing its output production for 2024. The energy company is set to reduce nearly 20% of its total output for 2024.
- An unplanned outage in Norway has extended into Friday for its main gas pipeline towards Europe.
- A major LNG gas terminal in Italy is starting an eight-month maintenance ahead of schedule.
- The US, Europe’s main Gas supplier, reports that an LNG export plant near the Sabine Pass will be closed for the rest of the week.
Natural Gas Technical Analysis: Time for traders to keep levels steady
Natural Gas had a field day on Wednesday with its 12% steep increase. Now it comes down to traders to maintain current price levels if more upside is to be had in the energy commodity. Some outside help from narrowing supply could push Natural Gas prices back to $2.
On the upside, Natural Gas is facing some pivotal technical levels to get back to. The next stop is $1.99, – the level which, when broken, saw an accelerated decline. After that, the green line at $2.13 comes into view, with the triple bottoms from 2023. If Natural Gas sees sudden demand pick up, $2.40 could come into play.
On the downside, $1.80 is a key support as it was a pivotal level back in July 2020. Should the recent headlines start to fade, or more supply emerge in the markets from other firms or countries to fill the gap, $1.64 and $1.53 (the low of 2020) are targets to look out for.
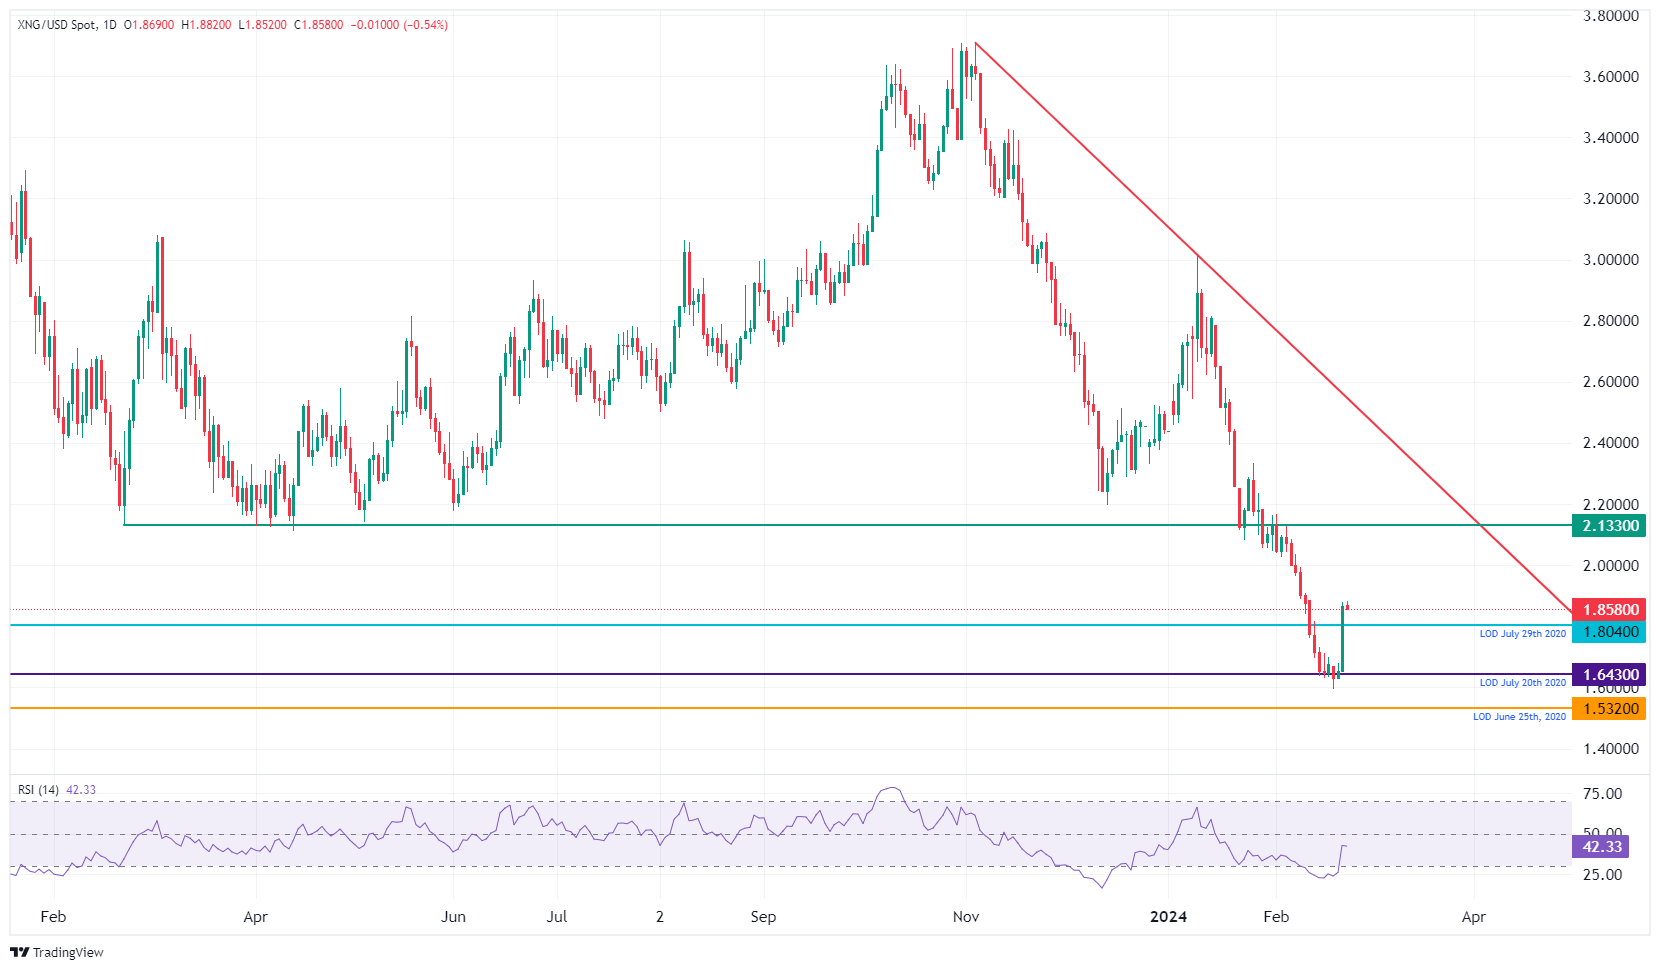
XNG/USD (Daily Chart)
Natural Gas FAQs
What fundamental factors drive the price of Natural Gas?
Supply and demand dynamics are a key factor influencing Natural Gas prices, and are themselves influenced by global economic growth, industrial activity, population growth, production levels, and inventories. The weather impacts Natural Gas prices because more Gas is used during cold winters and hot summers for heating and cooling. Competition from other energy sources impacts prices as consumers may switch to cheaper sources. Geopolitical events are factors as exemplified by the war in Ukraine. Government policies relating to extraction, transportation, and environmental issues also impact prices.
What are the main macroeconomic releases that impact on Natural Gas Prices?
The main economic release influencing Natural Gas prices is the weekly inventory bulletin from the Energy Information Administration (EIA), a US government agency that produces US gas market data. The EIA Gas bulletin usually comes out on Thursday at 14:30 GMT, a day after the EIA publishes its weekly Oil bulletin. Economic data from large consumers of Natural Gas can impact supply and demand, the largest of which include China, Germany and Japan. Natural Gas is primarily priced and traded in US Dollars, thus economic releases impacting the US Dollar are also factors.
How does the US Dollar influence Natural Gas prices?
The US Dollar is the world’s reserve currency and most commodities, including Natural Gas are priced and traded on international markets in US Dollars. As such, the value of the US Dollar is a factor in the price of Natural Gas, because if the Dollar strengthens it means less Dollars are required to buy the same volume of Gas (the price falls), and vice versa if USD strengthens.
Recommended Articles


