


Gold’s rally pauses amid rising US Treasury yields, FOMC Minutes anticipation
- Gold price threatens to end its streak of gains amid rising US Treasury yields.
- Market turns cautious ahead of FOMC Minutes and due to recent hawkish Fed indications.
- Adjustments in Fed rate forecasts following inflation reports and bond auctions affect Gold's appeal.
Gold price retreats on Wednesday after registering four days of straight gains as US Treasury bond yields rise in the vicinity of the release of the Minutes from the Federal Reserve’s (Fed) monetary policy meeting in January. Global equities portray a risk-off environment, while US Treasury bond yields resume to the upside amid speculation that the Minutes could reinforce the “hawkish hold” delivered by Fed Chairman Jerome Powell and his colleagues. At the time of writing, the XAU/USD exchanges hands at $2,022.51, down 0.07%.
Traders are eyeing the release of the Federal Open Market Committee (FOMC) Minutes. Fed officials crossed the newswires, expressing that the US central bank would begin to ease monetary policy toward the second half of 2024. However, on the consumer and producer side, January’s inflation data could cause policymakers to refrain from slashing rates as prices escalated above the 3% threshold.
That triggered a repricing on Fed rate cut expectations as shown by the Chicago Board of Trade (CBOT) data, with traders expecting the Federal Funds Rate (FFR) would be at 4.55% by the end of 2024.
Recently, a US 20-year bond auction triggered a jump in US Treasury yields, with the 10-year note yield up five basis points to 4.327%, a headwind for Gold prices.
Daily digest market movers: Gold retraces as traders expect less dovish Fed
- The CME FedWatch Tool sees traders expect the first 25 bps rate cut by the Fed in June 2024.
- Investors are pricing in 95 basis points of easing throughout 2024.
- The US Dollar Index, tracking the performance of the US Dollar against a basket of six major currencies, is currently trading within a narrow range around 104.10, up 0.03%.
- The latest inflation reports from the US triggered a change of language from Fed officials, who struck a “cautious” tone. Atlanta Fed President Raphael Bostic suggested the Fed is in no rush to ease policy.
- Richmond Fed President Thomas Barkin said the latest inflation reports were “less good,” adding that the US has “a ways to go” to achieve a soft landing.
- San Francisco Fed President Mary Daly stated, “We will need to resist the temptation to act quickly when patience is needed and be prepared to respond agilely as the economy evolves.”
- This week the US economic schedule will feature the release of the latest Federal Reserve Open Market Committee (FOMC) Minutes alongside Fed officials' speeches beginning on Wednesday.
- Traders will get further cues from US S&P Global PMIs, Initial Jobless Claims data and the Chicago Fed National Activity Index, usually a prelude to the Institute for Supply Management's (ISM) Manufacturing PMI.
Technical analysis: Gold stays above 100-day SMA, eyes key resistance near 50-day SMA
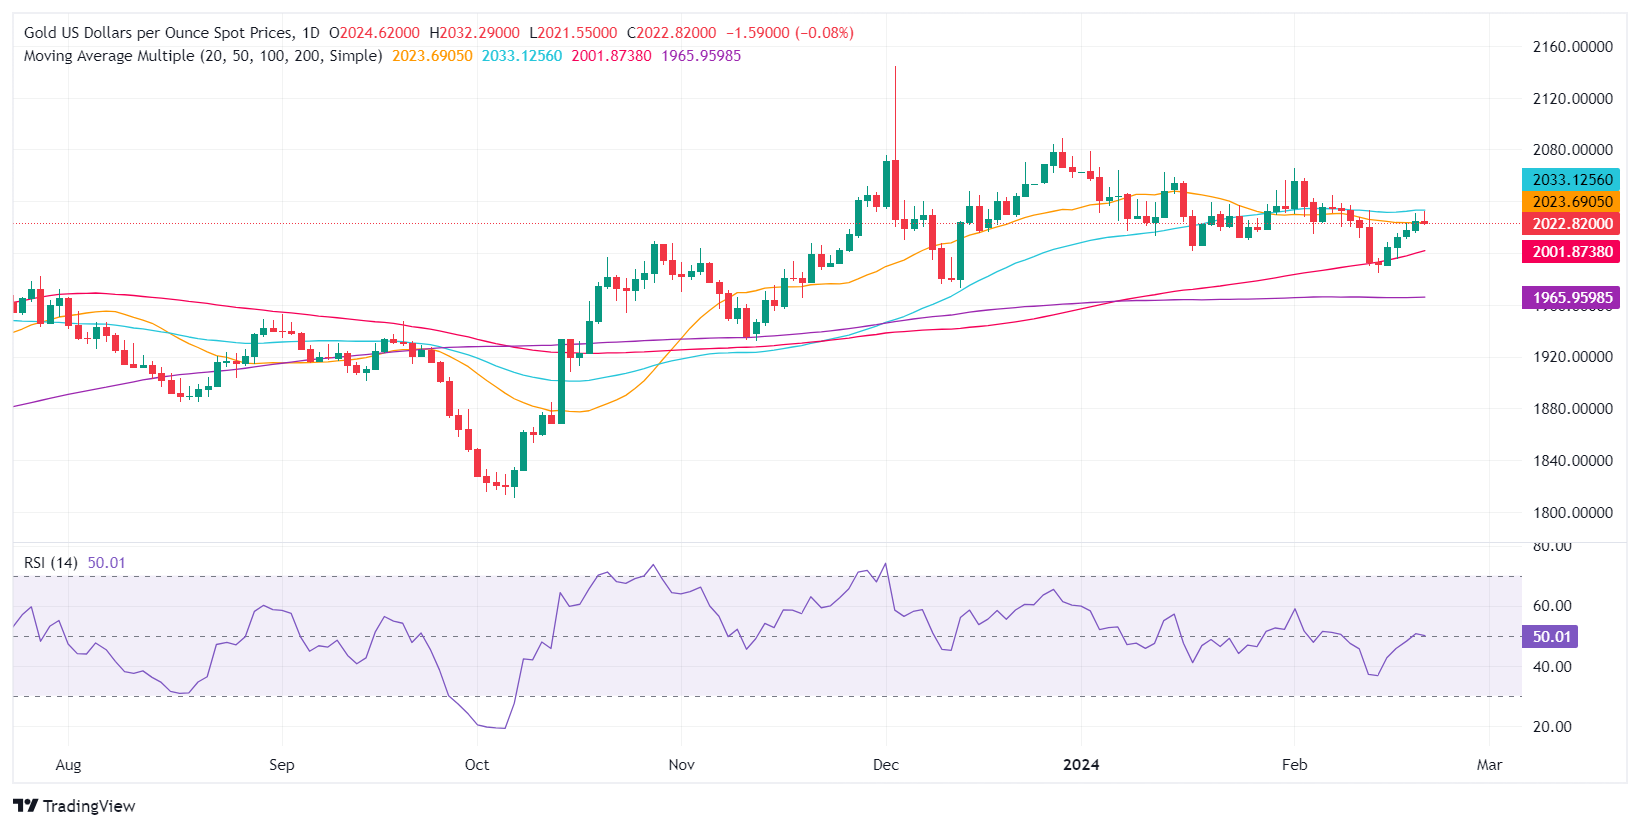
Gold is trading range-bound though tilted to the downside as the yellow metal has achieved a successive series of lower highs and lows. Stir resistance at the 50-day Simple Moving Average (SMA) at $2,033.54 might cap XAU/USD’s upside, but if cleared, that would pave the way to test the $2,050.00 figure. Upside risks lie at $2,065.60, the February 1 high.
On the flip side, if sellers step in and push prices below the $2,000 figure, that will expose the 100-day SMA at $2,002.05. The next stop would be the December 13 low at $1,973.13, followed by the 200-day SMA at $1,965.86.
Gold FAQs
Why do people invest in Gold?
Gold has played a key role in human’s history as it has been widely used as a store of value and medium of exchange. Currently, apart from its shine and usage for jewelry, the precious metal is widely seen as a safe-haven asset, meaning that it is considered a good investment during turbulent times. Gold is also widely seen as a hedge against inflation and against depreciating currencies as it doesn’t rely on any specific issuer or government.
Who buys the most Gold?
Central banks are the biggest Gold holders. In their aim to support their currencies in turbulent times, central banks tend to diversify their reserves and buy Gold to improve the perceived strength of the economy and the currency. High Gold reserves can be a source of trust for a country’s solvency. Central banks added 1,136 tonnes of Gold worth around $70 billion to their reserves in 2022, according to data from the World Gold Council. This is the highest yearly purchase since records began. Central banks from emerging economies such as China, India and Turkey are quickly increasing their Gold reserves.
How is Gold correlated with other assets?
Gold has an inverse correlation with the US Dollar and US Treasuries, which are both major reserve and safe-haven assets. When the Dollar depreciates, Gold tends to rise, enabling investors and central banks to diversify their assets in turbulent times. Gold is also inversely correlated with risk assets. A rally in the stock market tends to weaken Gold price, while sell-offs in riskier markets tend to favor the precious metal.
What does the price of Gold depend on?
The price can move due to a wide range of factors. Geopolitical instability or fears of a deep recession can quickly make Gold price escalate due to its safe-haven status. As a yield-less asset, Gold tends to rise with lower interest rates, while higher cost of money usually weighs down on the yellow metal. Still, most moves depend on how the US Dollar (USD) behaves as the asset is priced in dollars (XAU/USD). A strong Dollar tends to keep the price of Gold controlled, whereas a weaker Dollar is likely to push Gold prices up.
Recommended Articles


