


Gold hits all-time high as US-China trade war escalates
- Gold hits an all-time high of $2,845, gaining over 1% as trade war fears intensify safe-haven demand.
- Chinese retaliatory tariffs on US goods and export controls amplify market uncertainties.
- Upcoming Fed speeches may influence gold's trajectory, with potential hawkish shifts tempering gains.
Gold reached a record high of $2,845 late Tuesday during the North American session as the US Dollar tumbled, weighed down by falling US Treasury bond yields. The “trade war” between the United States (US) and China sparked a flight to the yellow metal's safe-haven status. The XAU/USD trades at $2,843, up more than 1%.
Geopolitical issues are driving bullion prices. Although US President Donald Trump delayed tariffs on Mexico and Canada, duties of 10% on Chinese goods kicked in, sparking retaliatory actions by China.
China applied tariffs on specific products, such as coal, Liquefied Natural Gas (LNG), Crude Oil, farm equipment and electric trucks imported from the US. Additionally, it has decided to impose controls on exports of some metals, which are critical for electronics.
The escalation of the US-China trade war weighed on the Greenback, which, according to the US Dollar Index (DXY), fell 0.43%, below the 108.00 figure.
Therefore, the non-yielding metal is set to extend its rally, initially towards $2,850, ahead of the $2,900 figure.
However, Federal Reserve (Fed) speakers could cap Gold’s advance if they become slightly hawkish. San Francisco Fed President Mary Daly said the Fed’s job is not done on inflation, adding that the US economy is in a good place and the Central Bank is in a strong position to wait and see and assess tariffs' impact.
Daily digest market movers: Bullion prices underpinned by falling US yields
- Gold price soars underpinned by falling US yields. US real yields, as measured by the 10-year Treasury Inflation-Protected Securities (TIPS), tumble almost six basis points (bps) down from 2.13% to 2.072%
- The US 10-year Treasury bond yield falls four bps to 4.51%.
- US Jobs Openings and Labor Turnover Survey (JOLTS) data showed that job openings are decreasing, indicating a strong labor market. Job openings plunged to 7.6 million in December, revealing that the Department of Labor had decreased from November 8.156 million and was below forecasts of 8 million.
- US Factory Orders fell -0.9% in December, below forecasts of a -0.7% contraction.
- Money market fed funds rate futures are pricing in 48 basis points (bps) of easing by the Federal Reserve in 2025.
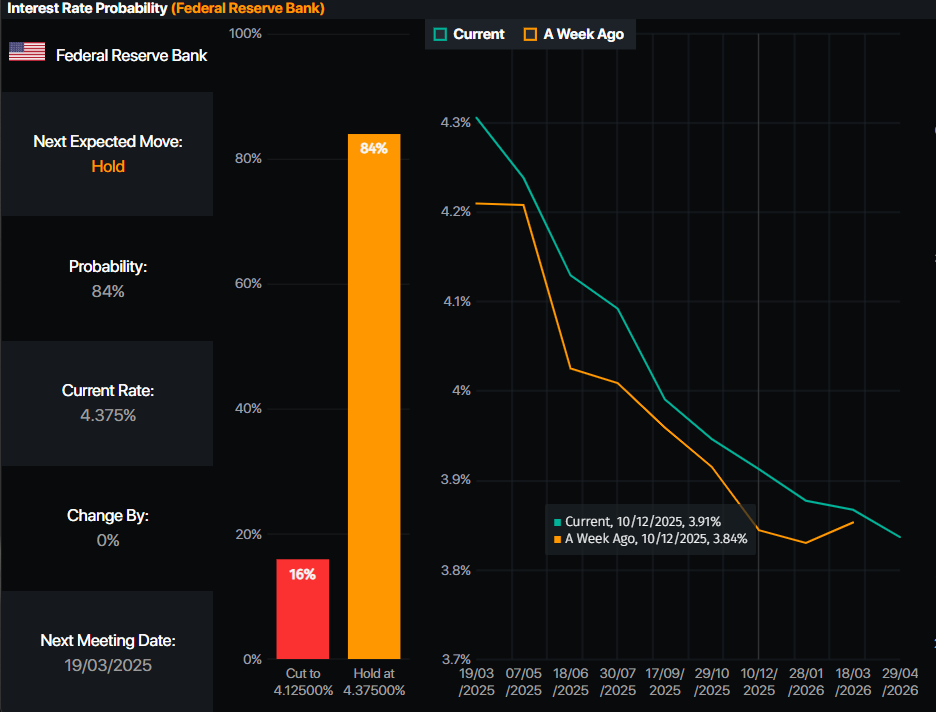
Source: Prime Market Terminal
XAU/USD technical outlook: Gold prices set to hit record highs
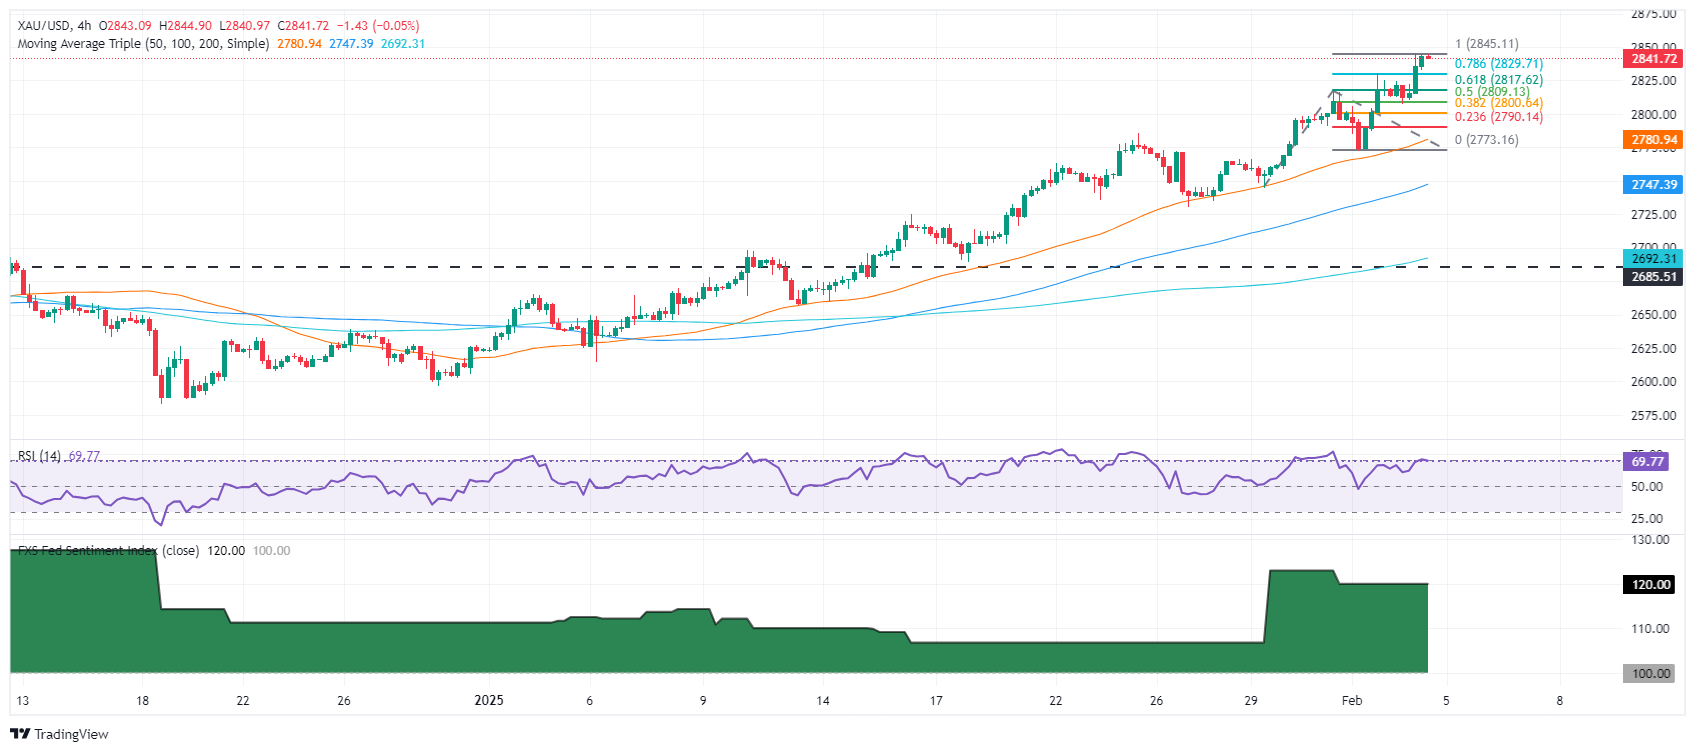
Gold’s uptrend remains intact as bullish momentum grows, as depicted by the Relative Strength Index (RSI). The RSI gives overbought signals, but due to the trend's strength, the most extreme level moves up from 70 to 80. Therefore, as the RSI is at 74, bulls could remain hopeful that higher prices lie ahead.
The next resistance would be $2,850 ahead of the 161.8% Fibonacci (Fib) extension at $2,889, ahead of $2,900 as seen on the 4-hour chart.
Conversely, if sellers clear the 50-period Simple Moving Average (SMA) at $2,780, this will be followed by the January 27 swing low of $2,730. The next stop below there would be $2,700.
Gold FAQs
Gold has played a key role in human’s history as it has been widely used as a store of value and medium of exchange. Currently, apart from its shine and usage for jewelry, the precious metal is widely seen as a safe-haven asset, meaning that it is considered a good investment during turbulent times. Gold is also widely seen as a hedge against inflation and against depreciating currencies as it doesn’t rely on any specific issuer or government.
Central banks are the biggest Gold holders. In their aim to support their currencies in turbulent times, central banks tend to diversify their reserves and buy Gold to improve the perceived strength of the economy and the currency. High Gold reserves can be a source of trust for a country’s solvency. Central banks added 1,136 tonnes of Gold worth around $70 billion to their reserves in 2022, according to data from the World Gold Council. This is the highest yearly purchase since records began. Central banks from emerging economies such as China, India and Turkey are quickly increasing their Gold reserves.
Gold has an inverse correlation with the US Dollar and US Treasuries, which are both major reserve and safe-haven assets. When the Dollar depreciates, Gold tends to rise, enabling investors and central banks to diversify their assets in turbulent times. Gold is also inversely correlated with risk assets. A rally in the stock market tends to weaken Gold price, while sell-offs in riskier markets tend to favor the precious metal.
The price can move due to a wide range of factors. Geopolitical instability or fears of a deep recession can quickly make Gold price escalate due to its safe-haven status. As a yield-less asset, Gold tends to rise with lower interest rates, while higher cost of money usually weighs down on the yellow metal. Still, most moves depend on how the US Dollar (USD) behaves as the asset is priced in dollars (XAU/USD). A strong Dollar tends to keep the price of Gold controlled, whereas a weaker Dollar is likely to push Gold prices up.
Recommended Articles


