

Crude Oil rebounds on Thursday, WTI climbs back into technical congestion near $77.50
- Crude Oil markets recovered after Wednesday’s decline as barrel bids rebound.
- WTI shrugs off warnings that global oil demand is set to peak according to the EIA.
- Crude Oil demand estimates have deviated wildly.
West Texas Intermediate (WTI) Crude Oil rebounded on Thursday, catching an upshot into $77.50 per barrel and slamming back into a technical congestion zone on the charts as energy market bid Crude Oil back up after a midweek pullback. Crude Oil supply lines saw an unexpected uptick in barrel counts this week, warning barrel traders that global supply continues to climb at a much faster pace than energy markets initially expected.
According to the International Energy Agency (IEA), global Crude Oil demand is going to settle into a much lower range than previously expected, with the IEA lowering its 2024 growth forecast. The IEA now expects global oil demand to grow by just 1.22 million barrels per day this year, down from the previous month’s estimate and coming in well below the forecast 2.25 million bpd growth forecast by the Organization for the Petroleum Exporting Countries (OPEC).
The IEA also expanded its projections for 2024’s production growth, forecasting global Crude Oil production to grow by 1.7 million bpd compared to the previous forecast of 1.5 million bpd. The IEA now expects global Crude Oil production will expand to a record 103.8 million barrels per day, fueled by production growth from non-OPEC entities, primarily the US.
Despite OPEC’s insinuation that they will be able to cut production enough to keep global crude markets constrained, the IEA expects demand for OPEC+ Crude Oil to continue to come in below current production targets.
WTI technical outlook
Thursday’s rebound in the WTI sees US Crude Oil climbing back into the 200-day Simple Moving Average (SMA) near $77.40 as WTI grinds its way back towards the $78.00 handle.
WTI is set to close once more in the green, offsetting Wednesday’s declines and putting US Crude Oil on pace to close higher for eight of the last nine consecutive trading days.
WTI hourly chart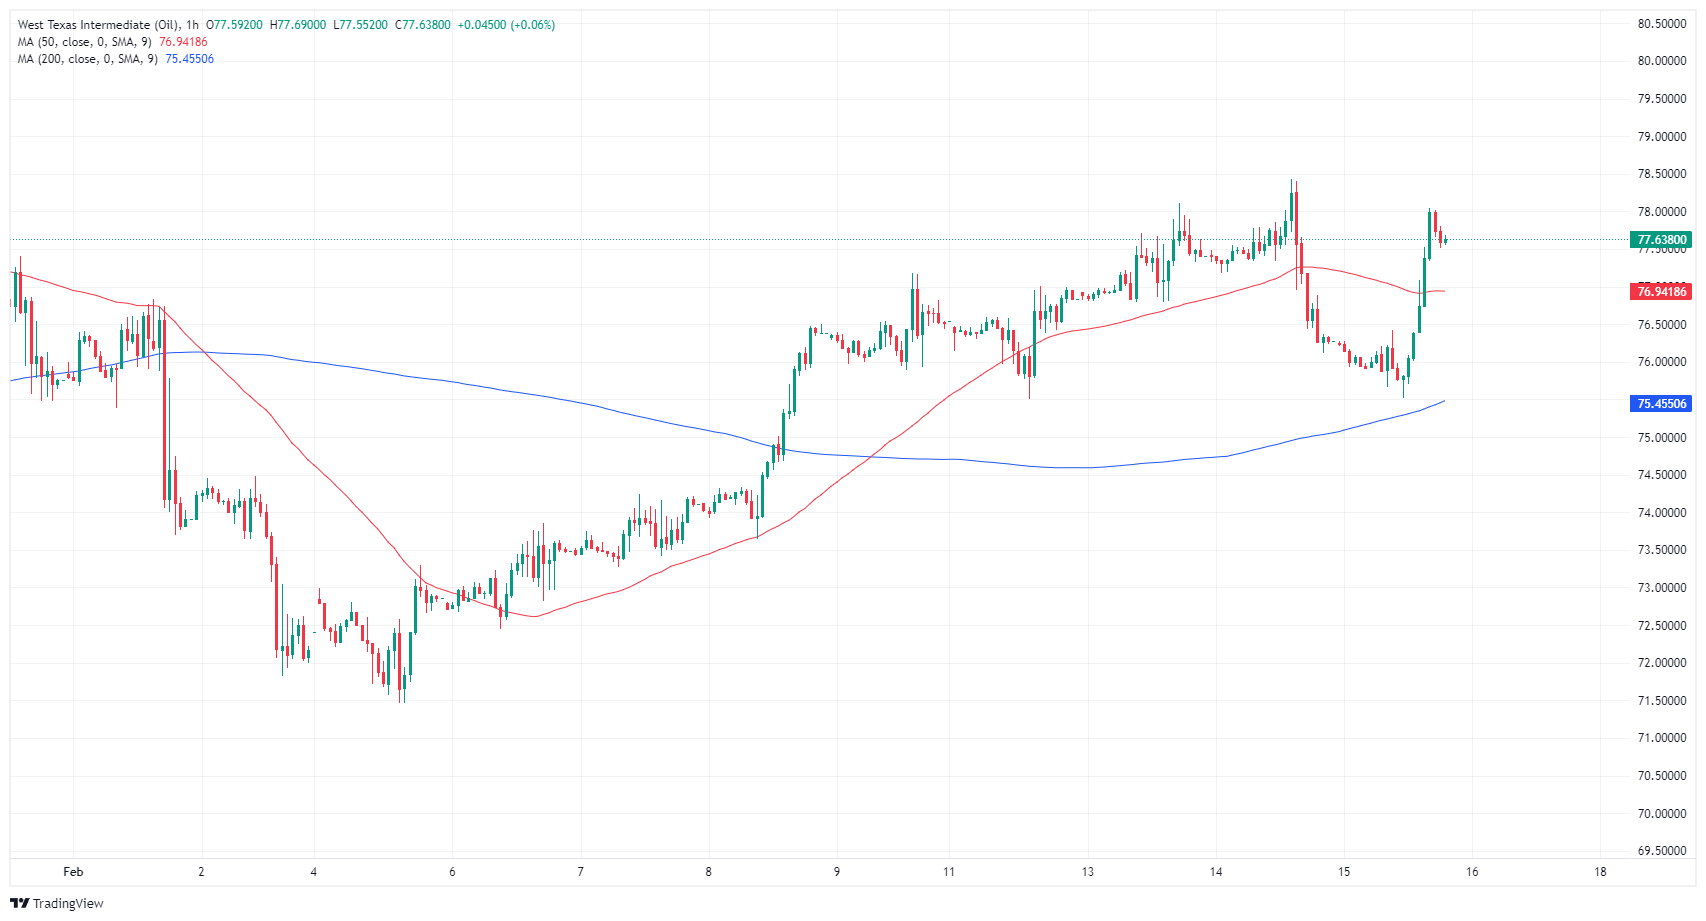
WTI daily chart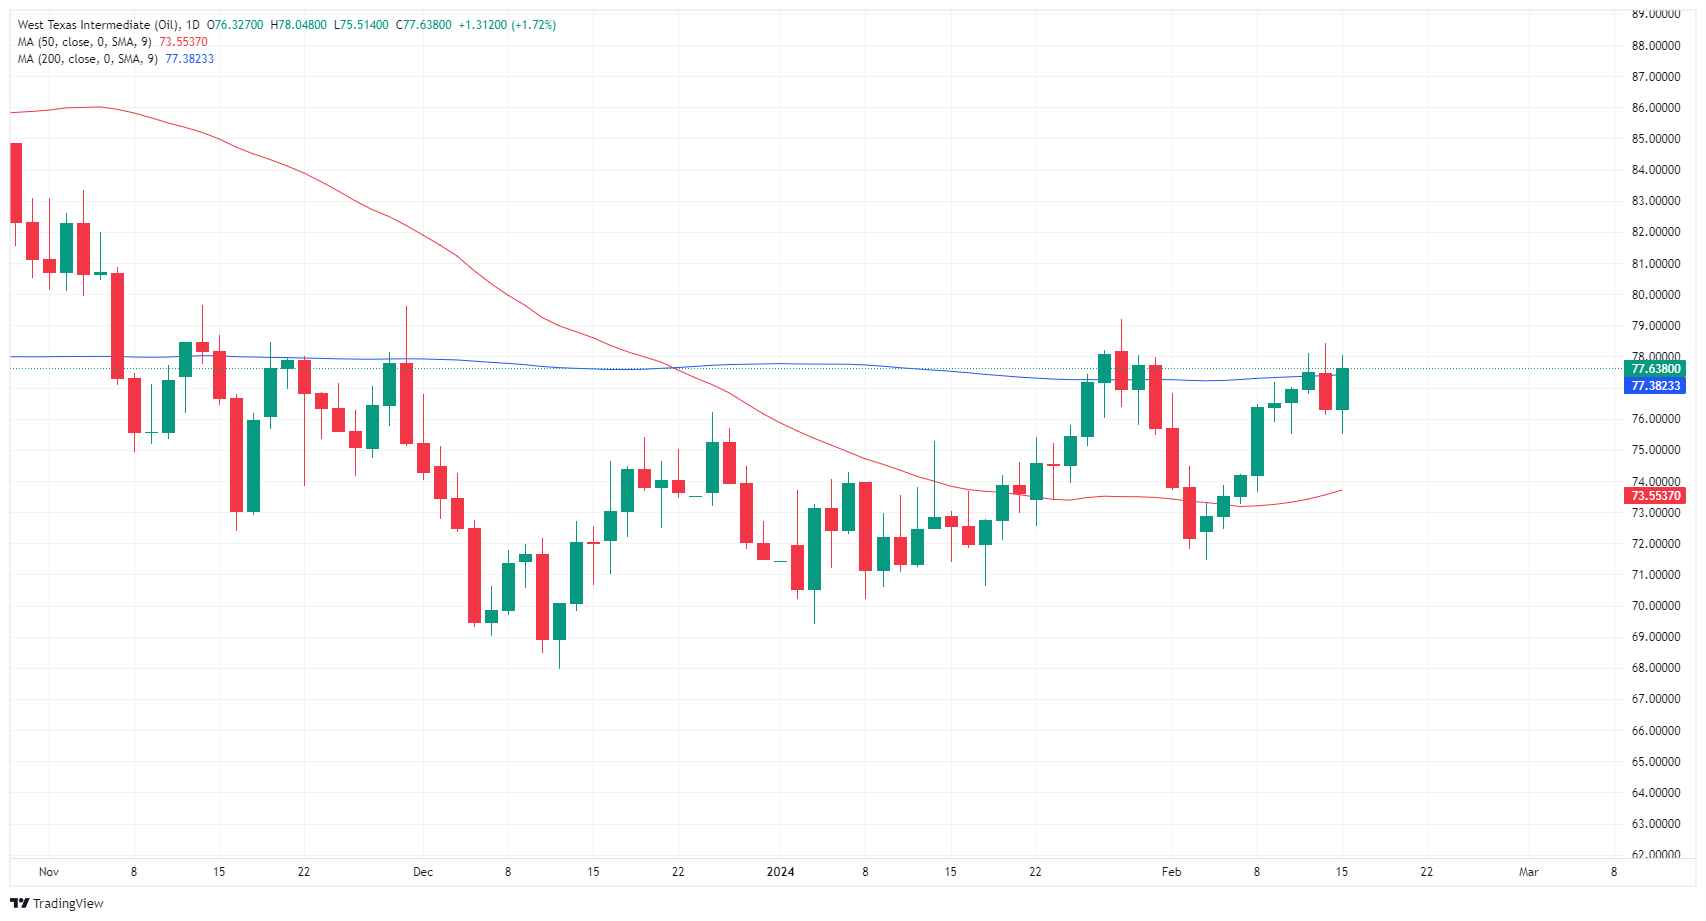
Recommended Articles


