


Gold rally hits curb and faces selling pressure for the first time this week
- Gold faces a first halt for this week in its rally.
- Bond yields are off their lows and starting to grind higher.
- Gold attempted to break above $2,760 on Wednesday and was rejected.
Gold’s price (XAU/USD), $2,747 at the time of writing, is seeing investors start to book some gains after a fierce three-day rally that brought over 2.0% gains. Traders are reducing their exposure to Bullion, with the US economic calendar getting ready for more data releases on Friday. Meanwhile, markets are cautious about what US President Donald Trump will say during his speech at the Davos World Economic Forum (WEF).
The data vacuum suffered lately has been ideal for Gold to rally without any big concern. That sentiment could start to change with the release of the Kansas Fed Manufacturing Activity Survey for January, ahead of the S&P Global Purchase Managers Index (PMIs) numbers on Friday.
Daily digest market movers: US data comes in
- Barrick Gold is exploring the sale of its 50% stake in Chile's Zaldivar Copper mine, according to Bloomberg sources, as the mining giant aims to streamline its portfolio and focus on larger-scale operations, Bloomberg reports.
- At 16:00 GMT, the Kansas Fed Manufacturing Activity Index for January is set to be released. No forecast is available, with the previous number in contraction at -5.
- President Donald Trump is set to speak remotely in Davos.
- US yields are off their lows for this week, with the US 10-year benchmark rate currently trading at 4.619%, off its poor performance seen earlier this week at 4.528%. It still has a long way to go back to the more-than-one-year high from last week at 4.807%.
Technical Analysis: Data to mess with the rally
Gold price stalls its rally on Thursday, and the US economic calendar has something to do with it. It has been a very rare few days, with the US economic calendar having been so empty since US President Donald Trump’s inauguration on Monday. The vacuum in economic data was ideal for traders to enjoy this rally. Though its importance is starting to pick up on Thursday, a correction could hit the precious metal.
Profit-taking could broaden and push Gold’s price back to $2,721, a sort of double top in November and December broken on Tuesday. Just below that, $2,709 (October 23, 2024, low) comes in focus as a second nearby support. In case both abovementioned levels snap, look for a dive back to $2,680 with a full-swing sell-off.
Conversely, Gold is now on its way to the all-time high of $2,790, which is still over 1.4% away from current levels. Once above that, a fresh all-time high will present itself. Meanwhile, some analysts and strategists have penciled in calls for $3,000, but $2,800 looks to be a good starting point as the next resistance on the upside.
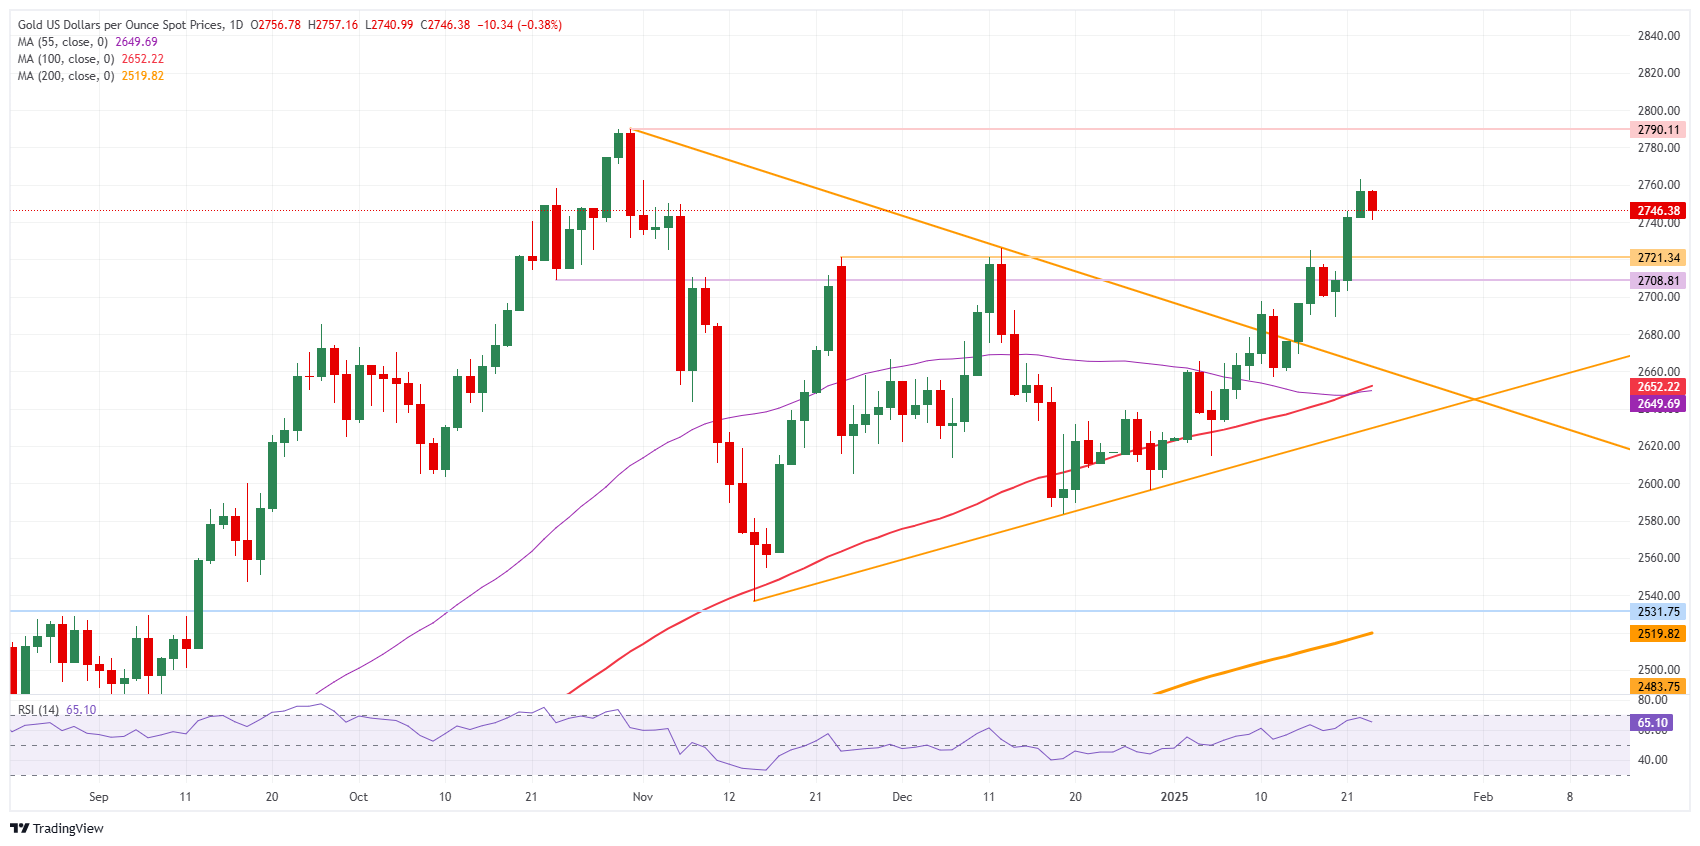
XAU/USD: Daily Chart
Gold FAQs
Gold has played a key role in human’s history as it has been widely used as a store of value and medium of exchange. Currently, apart from its shine and usage for jewelry, the precious metal is widely seen as a safe-haven asset, meaning that it is considered a good investment during turbulent times. Gold is also widely seen as a hedge against inflation and against depreciating currencies as it doesn’t rely on any specific issuer or government.
Central banks are the biggest Gold holders. In their aim to support their currencies in turbulent times, central banks tend to diversify their reserves and buy Gold to improve the perceived strength of the economy and the currency. High Gold reserves can be a source of trust for a country’s solvency. Central banks added 1,136 tonnes of Gold worth around $70 billion to their reserves in 2022, according to data from the World Gold Council. This is the highest yearly purchase since records began. Central banks from emerging economies such as China, India and Turkey are quickly increasing their Gold reserves.
Gold has an inverse correlation with the US Dollar and US Treasuries, which are both major reserve and safe-haven assets. When the Dollar depreciates, Gold tends to rise, enabling investors and central banks to diversify their assets in turbulent times. Gold is also inversely correlated with risk assets. A rally in the stock market tends to weaken Gold price, while sell-offs in riskier markets tend to favor the precious metal.
The price can move due to a wide range of factors. Geopolitical instability or fears of a deep recession can quickly make Gold price escalate due to its safe-haven status. As a yield-less asset, Gold tends to rise with lower interest rates, while higher cost of money usually weighs down on the yellow metal. Still, most moves depend on how the US Dollar (USD) behaves as the asset is priced in dollars (XAU/USD). A strong Dollar tends to keep the price of Gold controlled, whereas a weaker Dollar is likely to push Gold prices up.
Recommended Articles


