


Gold bulls make handbrake turn after reaching milestone high
- Gold edges lower after topping at a new record high of $2,790 on Thursday.
- The yellow metal sees downside pressure from rising US Treasury bond yields following stronger US employment data.
- Hopes of a Middle East ceasefire and the probability of a Trump victory are also weighing on Gold.
Gold (XAU/USD) pulls up and reverses from its new record high of $2,790 on Thursday. The precious metal is pulling back partly due to rising US Treasury bond yields, which reflect elevated interest rate expectations. These, in turn, reduce the attractiveness of non-interest-paying assets such as Gold.
Strong US ADP employment data on Wednesday helped provide an antidote to the weak US JOLTS Job Openings data released earlier in the week because it suggested the US labor market was not in as bad shape as feared. This is reducing bets the Federal Reserve (Fed) will need to slash interest rates to boost employment. The market-based probabilities, using the price of interest-rate swaps as a guide, forecasts an almost 100% chance of a 25 basis point (bps) or 0.25% cut by the Fed in November but a 70% probability in December.
Bond yields might be further rising because of the increasing odds of the Republican nominee Donald Trump winning the race to the White House. Trump’s preference for lower taxes, higher government borrowing and tariffs on foreign imports would probably be inflationary for the economy and lead the Fed to keep interest rates higher for longer.
This, and the emergence of a glimmer of hope on the horizon for a ceasefire in the Middle East – thereby lowering safe-haven demand for the yellow metal – is creating a headwind for Gold price in its onward march higher.
Gold dips as bearish factors coalesce
Gold price is backing off from the record highs it scaled on Wednesday as the chances of a Trump presidency steadily increase.
Polling website FiveThirtyEight’s prediction model gives Trump a 52% chance of winning versus Vice President Kamala Harris’ 48%. Betting website OddsChecker offers fractional odds of 11/18 (or 62.1%) for a Trump win against 28/17 (or 37.8%) for a Kamala Harris victory. The latest opinion polls, however, still place Harris marginally in the lead with 48.1% versus 46.7% for Trump.
In addition, Gold may be falling on reduced safe-haven flows amid hopes of a ceasefire in the Middle East. The US has sent a new envoy to broker a peace deal between Israel Hamas and Hezbollah. Early signs suggest Israel is open to negotiation after successfully pushing back Hezbollah from southern Lebanon, decapitating its hierarchy and severely reducing Hamas’ capabilities in Gaza, according to Bloomberg News. The threat of Iran opening a direct front against Israel, however, remains a potential spoiler.
That said, the war in Ukraine continues to fuel geopolitical risks after the escalation of North Korean troops entering the war on the side of Russia.
Gold could also continue to see gains as the US Dollar leaks lower, despite rising bond yields (normally bullish for the Greenback) because Gold is mostly priced and traded in USD. The US Dollar Index (DXY) is down over a tenth of a percent on Thursday – down almost a third of a percent overall this week so far – trading just below 104.00.
Technical Analysis: Gold pulls back after breaking to new highs
Gold has broken out of the mini range it was stuck in between $2,708 and $2,758 and risen up to a new all-time high of $2,790 on Wednesday.
Overall, the yellow metal is in a steady uptrend on all time frames (short, medium and long), which, given the technical principle that “the trend is your friend,” tilts the odds in favor of more upside.
XAU/USD Daily Chart
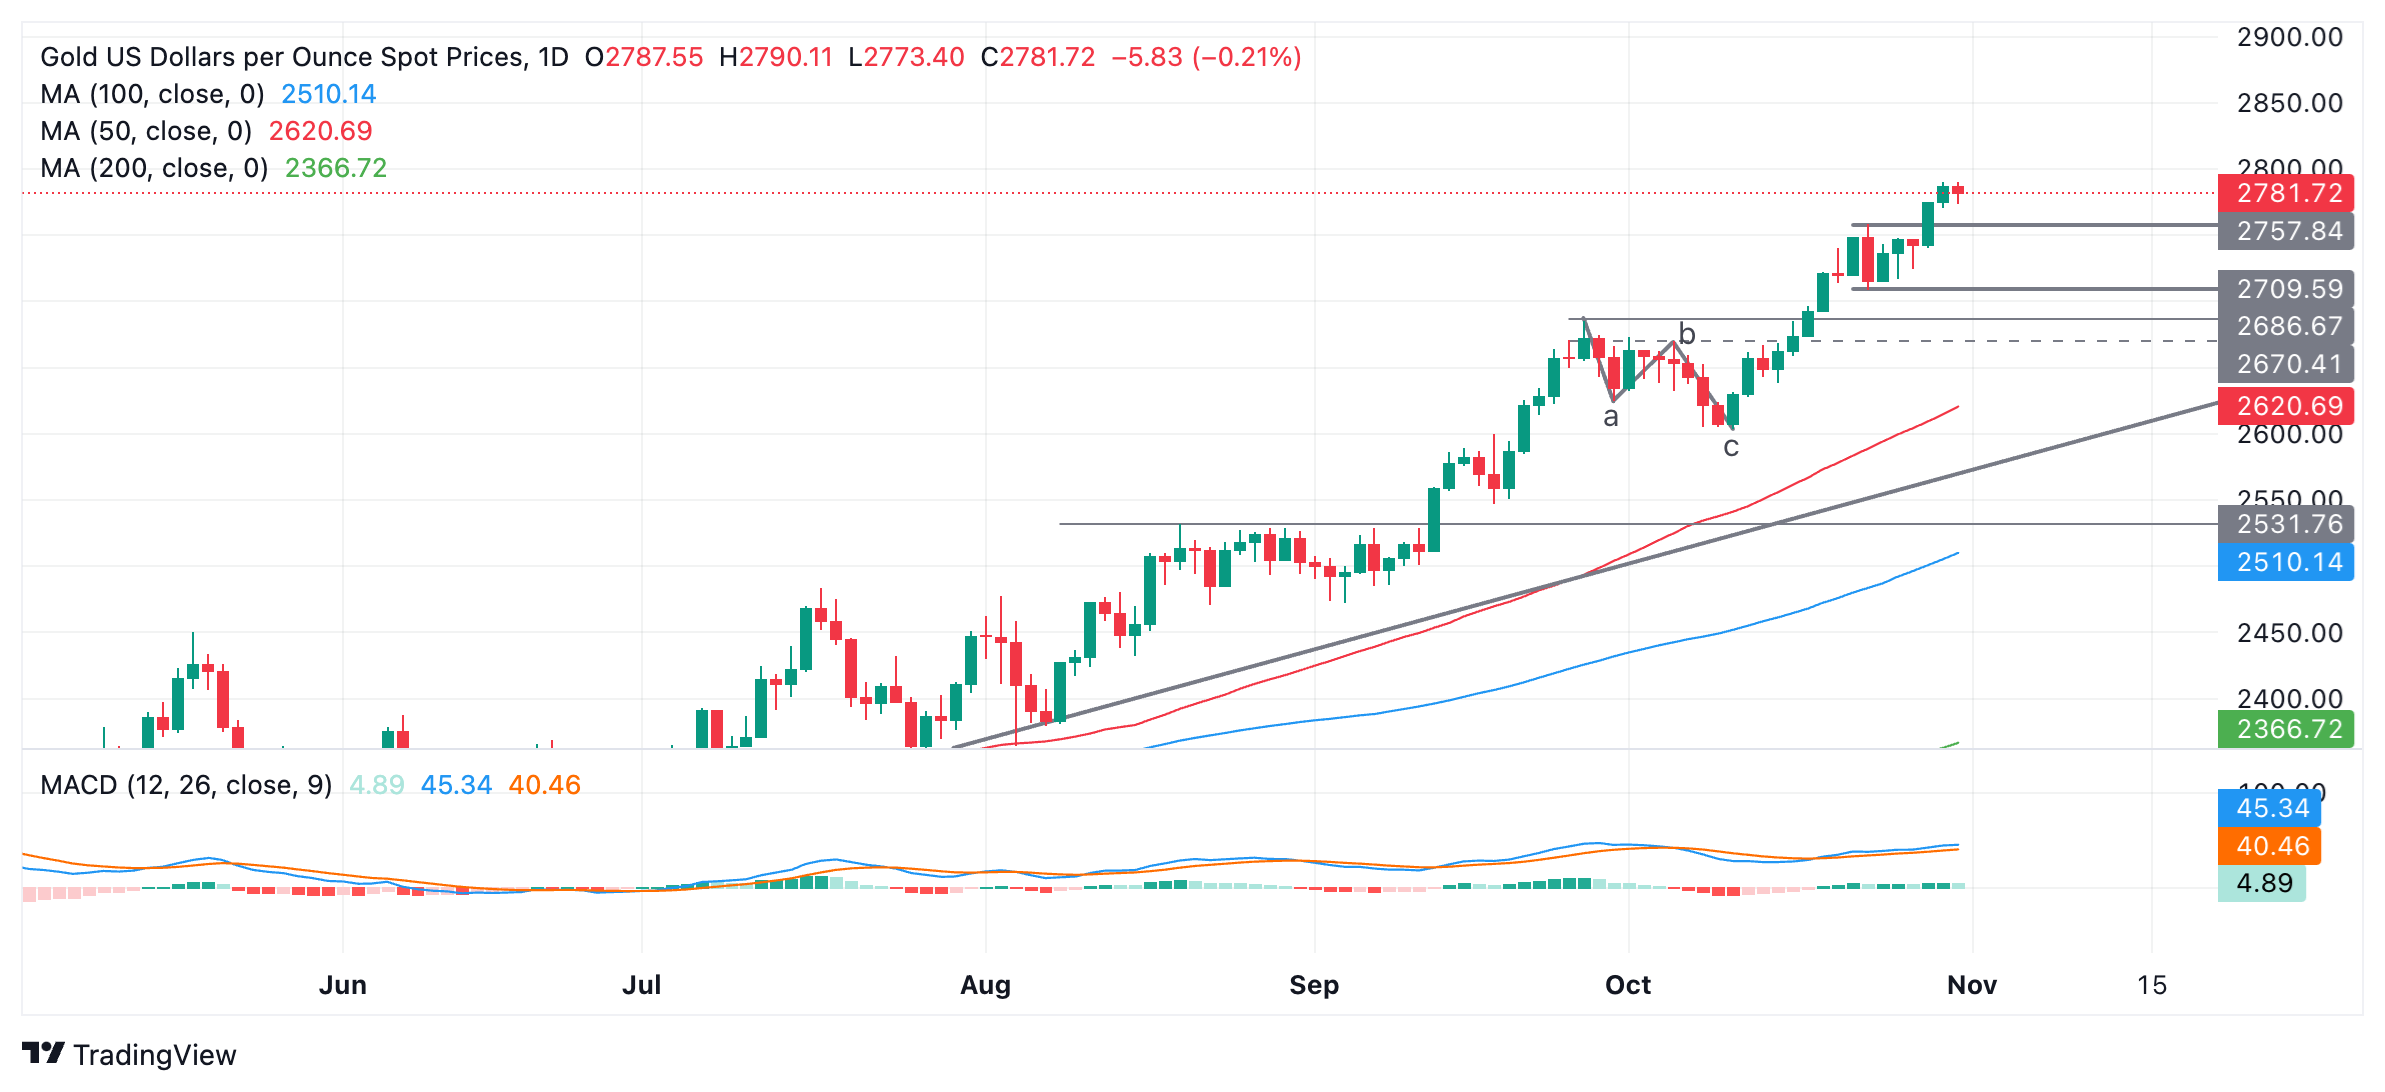
The break above the top of the range helps confirm a continuation up to the next target level, probably at the big-figure $3,000 level (round number and psychological level).
A deeper pullback would find support initially from the top of the old range at $2,758, then $2,750. The overall uptrend, however, would be likely to resume afterward.
A break above $3,000 would activate the next upside target at $3,050.
Gold FAQs
Gold has played a key role in human’s history as it has been widely used as a store of value and medium of exchange. Currently, apart from its shine and usage for jewelry, the precious metal is widely seen as a safe-haven asset, meaning that it is considered a good investment during turbulent times. Gold is also widely seen as a hedge against inflation and against depreciating currencies as it doesn’t rely on any specific issuer or government.
Central banks are the biggest Gold holders. In their aim to support their currencies in turbulent times, central banks tend to diversify their reserves and buy Gold to improve the perceived strength of the economy and the currency. High Gold reserves can be a source of trust for a country’s solvency. Central banks added 1,136 tonnes of Gold worth around $70 billion to their reserves in 2022, according to data from the World Gold Council. This is the highest yearly purchase since records began. Central banks from emerging economies such as China, India and Turkey are quickly increasing their Gold reserves.
Gold has an inverse correlation with the US Dollar and US Treasuries, which are both major reserve and safe-haven assets. When the Dollar depreciates, Gold tends to rise, enabling investors and central banks to diversify their assets in turbulent times. Gold is also inversely correlated with risk assets. A rally in the stock market tends to weaken Gold price, while sell-offs in riskier markets tend to favor the precious metal.
The price can move due to a wide range of factors. Geopolitical instability or fears of a deep recession can quickly make Gold price escalate due to its safe-haven status. As a yield-less asset, Gold tends to rise with lower interest rates, while higher cost of money usually weighs down on the yellow metal. Still, most moves depend on how the US Dollar (USD) behaves as the asset is priced in dollars (XAU/USD). A strong Dollar tends to keep the price of Gold controlled, whereas a weaker Dollar is likely to push Gold prices up.
Recommended Articles


