Gold holds gains on China saber-rattling, stimulus expectations

Source Fxstreet
  • Gold rises on haven demand after Chinese military drills in the strait of Taiwan create an international incident. 
  • China’s fiscal stimulus also supports Gold as the country is the largest market for the yellow metal. 
  • Technically, XAU/USD reaches a key resistance level at the top of its multi-week range.

Gold (XAU/USD) recovers to trade back in the $2,660s on Monday amid rising safe-haven demand after saber-rattling by the Chinese People's Liberation Army (PLA) in the strait of Taiwan. This prompted a spokesperson from the US Department of State to say on Monday, that they were “seriously concerned” with the PLA’s activities in around Taiwan.

Gold rises on China factor

Gold may also be gaining due to a more positive outlook for the Chinese economy as the country is the largest market for the precious metal. On Saturday, Chinese Finance Minister Lan Fo’an announced a much-anticipated fiscal stimulus programme. Although no figures were given, he said Beijing would help regional governments tackle their debt problems with a large-scale local government debt swap. 

Lan further suggested the government’s stimulus package could mark a multi-year turning point in China's “fiscal policy framework”.

More central bank rate cuts in the pipeline

A further driver for Gold is the continued downward projected path of interest rates globally. The European Central Bank (ECB) will conclude its October meeting on Thursday and most analysts expect the bank to announce another 25 basis point (bps) (0.25%) rate cut – their second cut in a row. Such a move would signal a significant “gear change up” in terms of the pace and timing of the ECB’s easing cycle.  

In the US, meanwhile, investors expect a 25 bps rate cut from the Federal Reserve (Fed) in November after US Producer Price Index (PPI) inflation data on Friday  showed headline PPI was unchanged on a monthly basis in September – missing expectations of a 0.1% increase and the prior month’s 0.2% reading. Core PPI inflation, which excludes volatile food and energy prices, slowed to 0.2% from 0.3% in August. 

Annual readings, however, resulted mixed, as PPI decelerated while core PPI rose by 2.8%, above the prior month’s 2.6%. Although mixed annual performance, the monthly readings weighed, as did the preliminary US Michigan Consumer Sentiment Index for October, which fell below September’s reading and analysts’ estimates. 

The CME FedWatch Tool is showing the markets are now pricing in around a 90% chance of a 25 bps Fed rate cut – up from 83% before the PPI data. 

Technical Analysis: Gold on the rise

Gold appears to have completed a correction at the October 10 lows and is rising again. 

It has reached a resistance level at around $2,670 from a row of previous highs including the October 1 and 4 highs (dashed line). A close above would probably lead to a continuation up to the $2,685 all-time high.  

XAU/USD 4-hour Chart

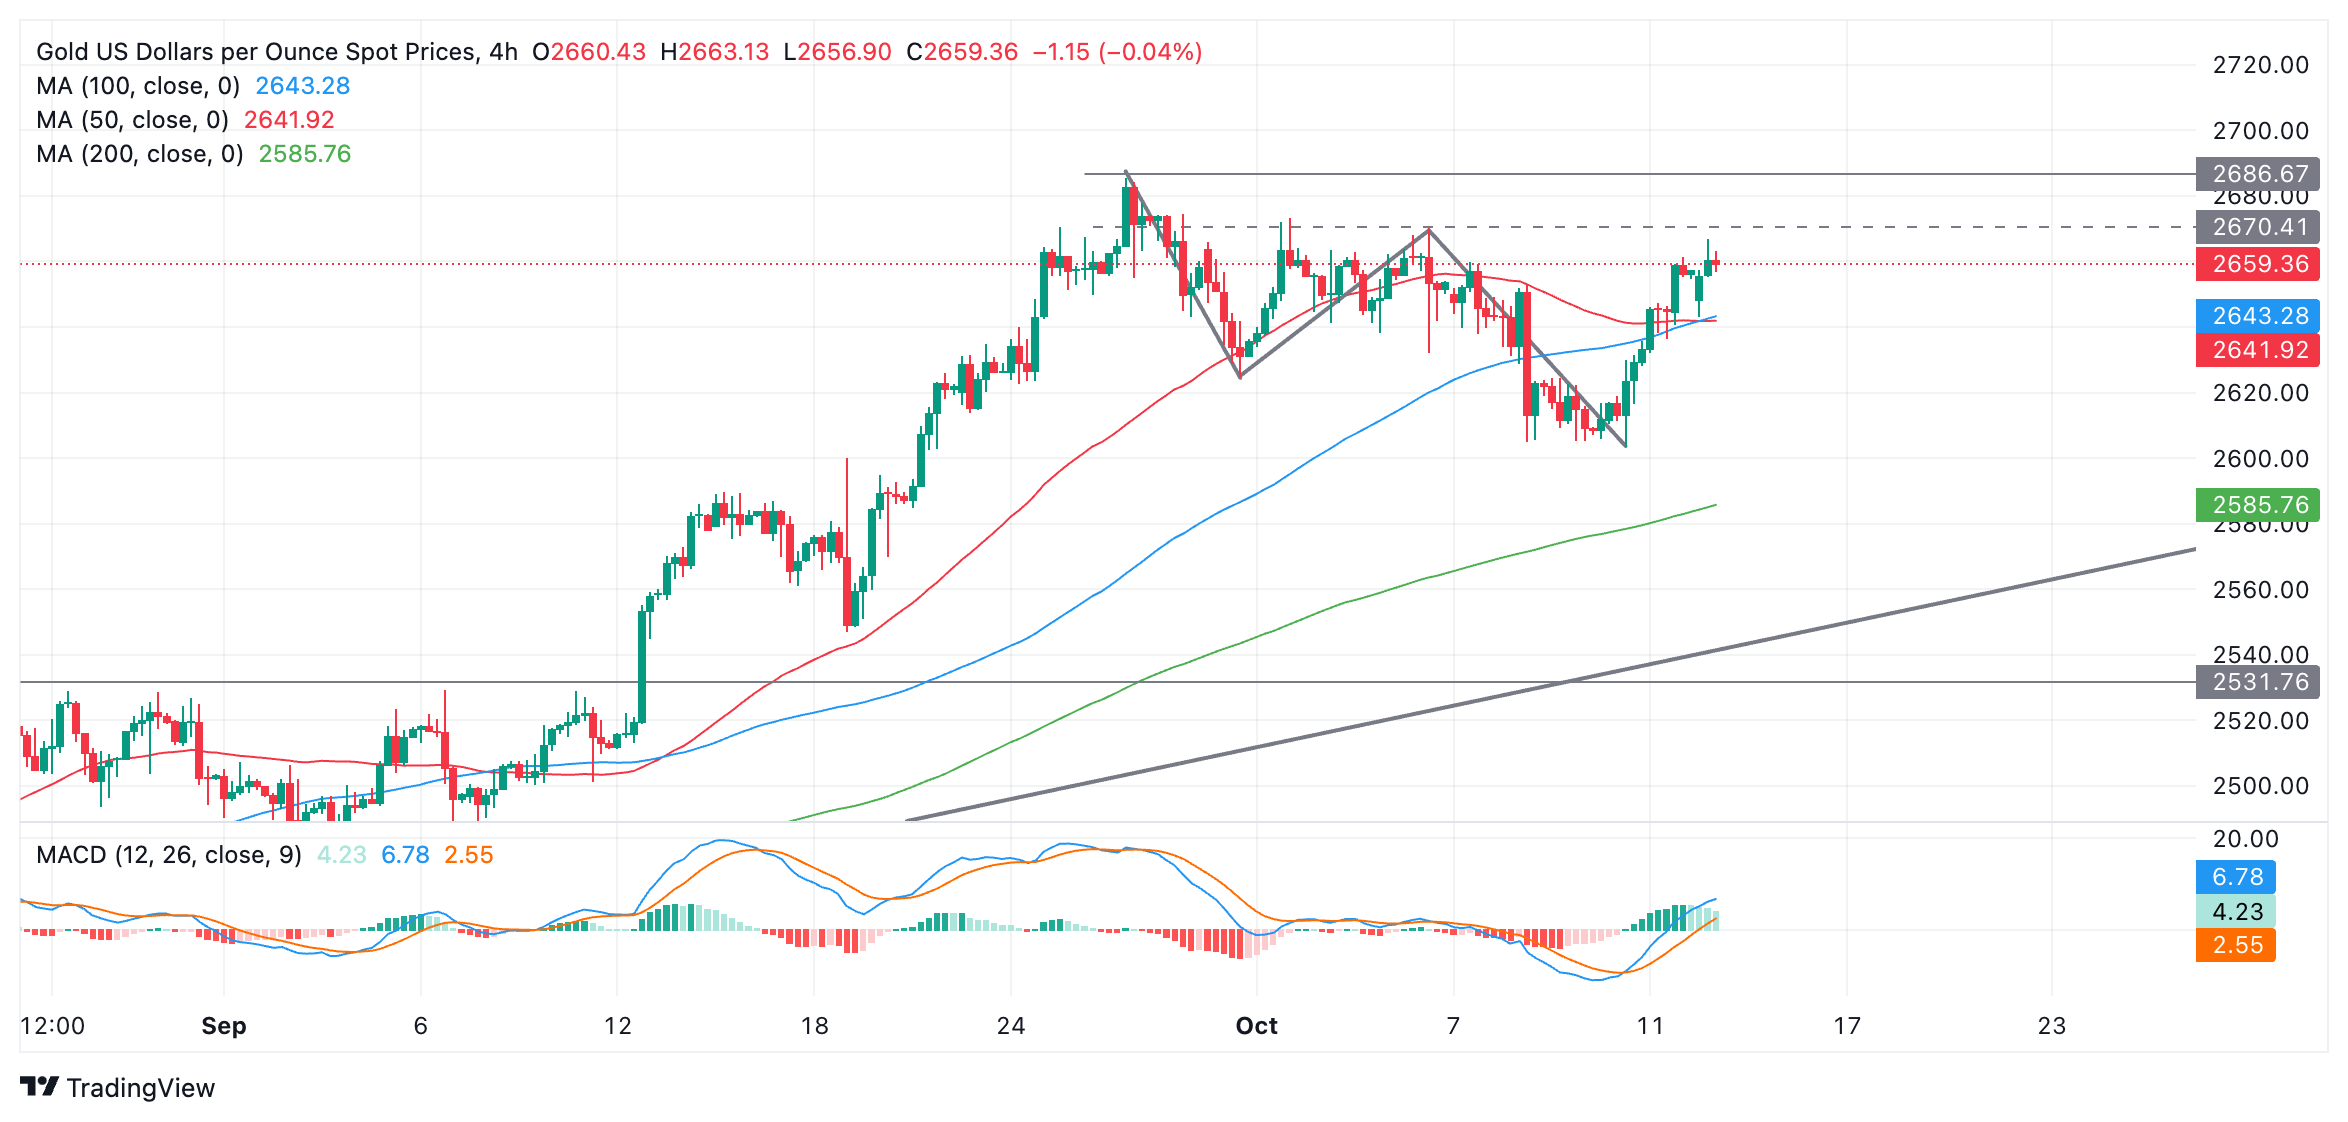
The Moving Average Convergence Divergence (MACD) has risen above the zero line and is in positive territory, which is a mildly bullish indication. 

There is also a chance the pair could bounce off resistance and start pulling back down into its familiar range between $2,620 and $2,670. This would extend the range-bound move seen since late September. 

Gold’s medium and long-term trends are also bullish. If one of these longer-term cycles resumes, it could, in theory, push the asset to even higher highs.

Economic Indicator

ECB Main Refinancing Operations Rate

One of the three key interest rates set by the European Central Bank (ECB), the main refinancing operations rate is the interest rate the ECB charges to banks for one-week long loans. It is announced by the European Central Bank at its eight scheduled annual meetings. If the ECB expects inflation to rise, it will increase its interest rates to bring it back down to its 2% target. This tends to be bullish for the Euro (EUR), since it attracts more foreign capital inflows. Likewise, if the ECB sees inflation falling it may cut the main refinancing operations rate to encourage banks to borrow and lend more, in the hope of driving economic growth. This tends to weaken the Euro as it reduces its attractiveness as a place for investors to park capital.

Read more.

Next release: Thu Oct 17, 2024 12:15

Frequency: Irregular

Consensus: 3.4%

Previous: 3.65%

Source: European Central Bank


Disclaimer: For information purposes only. Past performance is not indicative of future results.
placeholder
Ethereum Price Slips Lower — $3,000 Looms as the Key BattlegroundEthereum is attempting to recover from a $3,026 low but remains below $3,200 and the 100-hour SMA, with a bearish trend line near $3,175 capping rebounds as bulls need a clean break above $3,200 to target $3,250–$3,400, while a drop below $3,050 risks a retest of $3,000 and $2,940.
Author  Mitrade
Dec 15, Mon
Ethereum is attempting to recover from a $3,026 low but remains below $3,200 and the 100-hour SMA, with a bearish trend line near $3,175 capping rebounds as bulls need a clean break above $3,200 to target $3,250–$3,400, while a drop below $3,050 risks a retest of $3,000 and $2,940.
placeholder
Bitcoin Slides 5% as Sellers Lean In — Can BTC Reclaim $88,000?Bitcoin has dropped back below $88,000 after rolling over from $90,500, with price still trading under the 100-hour Simple Moving Average. The sell-off found a floor at $85,151, and BTC is now consolidating near that base, but rebounds are facing pressure from a bearish trend line around $89,000. Bulls need to retake $88,000–$89,000 to ease downside risk; failure to do so keeps $85,500–$85,000 and then $83,500 in play, with $80,000 as the deeper “line in the sand.” Bitcoin (BTC) is back in damage-control mode after a sharp pullback wiped out recent gains. The price failed to reclaim the $90,000–$90,500 band, rolled over, and slid through $88,500 before briefly dipping under $87,000. Buyers did show up around $85,000, but the rebound so far looks more like stabilization than a clear trend reversal. Bitcoin dips hard, finds a bid near $85,000(h3) BTC’s latest move lower began when it couldn’t build follow-through above $90,000 and $90,500. Once that upside stalled, sellers took control and pushed price down through $88,500. The slide accelerated enough to spike below $87,000, but the market didn’t free-fall. Bulls defended the $85,000 zone, printing a low at $85,151. Since then, Bitcoin has been consolidating below the 23.6% Fibonacci retracement of the drop from the $93,560 swing high to the $85,151 low — a clue that the bounce is still shallow and that sellers haven’t fully backed off yet. Structurally, BTC is still on the back foot: It’s trading below $88,000, and It remains below the 100-hour Simple Moving Average, keeping short-term trend pressure pointed downward. Resistance is layered, and $89,000 is the problem area(h3) If bulls try to turn this into a recovery, they’ll have to climb through multiple ceilings in quick succession. First, BTC faces resistance around $87,150, followed by a more meaningful barrier near $87,500. From there, the market’s attention snaps back to $88,000 — the level BTC just lost and now needs to reclaim. A close back above $88,000 would improve the tone, but it doesn’t solve the bigger issue: there’s a bearish trend line on the hourly BTC/USD chart (Kraken feed) with resistance near $89,000, which also lines up with the next technical hurdle. If BTC can push through $89,000 and hold, the rebound could extend toward $90,000, with follow-through targets at $91,000 and $91,500. But until price clears that $88,000–$89,000 zone, rallies are at risk of being sold rather than chased. If BTC fails to reclaim resistance, the downside path is clear(h3) The near-term bear case is simple: if Bitcoin can’t climb back above the $87,000 area and keep traction, sellers may attempt another leg lower. Support levels line up like this: Immediate support: $85,500 First major support: $85,000 Next support: $83,500 Then $82,500 in the near term Below that, the major “don’t break this” level is still $80,000. If BTC slips under $80,000, the risk of acceleration to the downside increases significantly — not because it’s magic, but because it’s the kind of psychological and structural level that tends to trigger forced de-risking. Indicators: momentum still leans bearish(h3) The intraday indicators aren’t offering much comfort yet: Hourly MACD is losing pace in the bearish zone. Hourly RSI remains below 50, suggesting sellers still have the upper hand on short timeframes. So while the $85,000 defense held for now, the market hasn’t flipped bullish — it’s just stopped bleeding.
Author  Mitrade
Dec 16, Tue
Bitcoin has dropped back below $88,000 after rolling over from $90,500, with price still trading under the 100-hour Simple Moving Average. The sell-off found a floor at $85,151, and BTC is now consolidating near that base, but rebounds are facing pressure from a bearish trend line around $89,000. Bulls need to retake $88,000–$89,000 to ease downside risk; failure to do so keeps $85,500–$85,000 and then $83,500 in play, with $80,000 as the deeper “line in the sand.” Bitcoin (BTC) is back in damage-control mode after a sharp pullback wiped out recent gains. The price failed to reclaim the $90,000–$90,500 band, rolled over, and slid through $88,500 before briefly dipping under $87,000. Buyers did show up around $85,000, but the rebound so far looks more like stabilization than a clear trend reversal. Bitcoin dips hard, finds a bid near $85,000(h3) BTC’s latest move lower began when it couldn’t build follow-through above $90,000 and $90,500. Once that upside stalled, sellers took control and pushed price down through $88,500. The slide accelerated enough to spike below $87,000, but the market didn’t free-fall. Bulls defended the $85,000 zone, printing a low at $85,151. Since then, Bitcoin has been consolidating below the 23.6% Fibonacci retracement of the drop from the $93,560 swing high to the $85,151 low — a clue that the bounce is still shallow and that sellers haven’t fully backed off yet. Structurally, BTC is still on the back foot: It’s trading below $88,000, and It remains below the 100-hour Simple Moving Average, keeping short-term trend pressure pointed downward. Resistance is layered, and $89,000 is the problem area(h3) If bulls try to turn this into a recovery, they’ll have to climb through multiple ceilings in quick succession. First, BTC faces resistance around $87,150, followed by a more meaningful barrier near $87,500. From there, the market’s attention snaps back to $88,000 — the level BTC just lost and now needs to reclaim. A close back above $88,000 would improve the tone, but it doesn’t solve the bigger issue: there’s a bearish trend line on the hourly BTC/USD chart (Kraken feed) with resistance near $89,000, which also lines up with the next technical hurdle. If BTC can push through $89,000 and hold, the rebound could extend toward $90,000, with follow-through targets at $91,000 and $91,500. But until price clears that $88,000–$89,000 zone, rallies are at risk of being sold rather than chased. If BTC fails to reclaim resistance, the downside path is clear(h3) The near-term bear case is simple: if Bitcoin can’t climb back above the $87,000 area and keep traction, sellers may attempt another leg lower. Support levels line up like this: Immediate support: $85,500 First major support: $85,000 Next support: $83,500 Then $82,500 in the near term Below that, the major “don’t break this” level is still $80,000. If BTC slips under $80,000, the risk of acceleration to the downside increases significantly — not because it’s magic, but because it’s the kind of psychological and structural level that tends to trigger forced de-risking. Indicators: momentum still leans bearish(h3) The intraday indicators aren’t offering much comfort yet: Hourly MACD is losing pace in the bearish zone. Hourly RSI remains below 50, suggesting sellers still have the upper hand on short timeframes. So while the $85,000 defense held for now, the market hasn’t flipped bullish — it’s just stopped bleeding.
placeholder
December Santa Claus Rally: New highs in sight for US and European stocks?Historical data show a rising trend of US and European stocks in December. If the momentum is strong, fund managers may rush in with a buying frenzy.
Author  Mitrade
Yesterday 02: 50
Historical data show a rising trend of US and European stocks in December. If the momentum is strong, fund managers may rush in with a buying frenzy.
placeholder
XRP’s Price Action Flashes a Warning Even as ETF Flows Stay PositiveXRP’s structure remains weak despite 18 straight positive closes in spot XRP ETFs, with analysts warning that $1.98 and other nearby resistance zones could cap rebounds unless the YO region is reclaimed, while deeper downside scenarios keep $1.53 on watch as a potential (not guaranteed) accumulation area.
Author  Mitrade
Yesterday 06: 37
XRP’s structure remains weak despite 18 straight positive closes in spot XRP ETFs, with analysts warning that $1.98 and other nearby resistance zones could cap rebounds unless the YO region is reclaimed, while deeper downside scenarios keep $1.53 on watch as a potential (not guaranteed) accumulation area.
placeholder
Gold declines on profit-taking, USD strength ahead of US CPI releaseGold price (XAU/USD) edges lower below $4,350 during the Asian trading hours on Thursday. The precious metal retreats from seven-week highs amid some profit-taking and a rebound in the US Dollar (USD).
Author  FXStreet
4 hours ago
Gold price (XAU/USD) edges lower below $4,350 during the Asian trading hours on Thursday. The precious metal retreats from seven-week highs amid some profit-taking and a rebound in the US Dollar (USD).
goTop
quote