

Crude Oil holds onto gains as Middle-East tensions outweigh US inventory build
- Crude Oil trade over 1% higher on Thursday as traders look at the escalating conflict between Israel and Iran.
- Traders sent Oil prices higher after Iran sent ballistic missiles into Israel as retaliation for the Lebanon ground incursion.
- The US Dollar Index is heading into its fourth day of consecutive gains.
Crude Oil jumps another 1% on Thursday as tensions in the Middle East continue to run high and despite the surprise buildup in US inventories. Traders try to assess what the next step could be in the standoff between Israel and Iran, either further escalation or easing in tensions. Meanwhile, the unexpected buildup in US Crude stockpiles on Wednesday was completely ignored by markets.
The US Dollar Index (DXY), which tracks the performance of the Greenback against six other currencies, is set for a fourth straight day of gains and is testing the September high at 101.90. Another big batch of data will be released on Thursday, with special importance to the Institute for Supply Management (ISM) numbers for the Services sector. The weekly Jobless Claims will also be closely watched in the light of the Nonfarm Payrolls number on Friday.
At the time of writing, Crude Oil (WTI) trades at $70.86 and Brent Crude at $74.71.
Oil news and market movers: OPEC tries to save the situation
- OPEC has said via Twitter that a Wall Street Journal (WSJ) published on October 2 – which mentioned that Saudi Arabia expected Oil prices could fall to $50 per barrel if OPEC members fail to uphold their production cuts – was “inaccurate and misleading”.
- Russia’s own data show its crude production in September fell just below its monthly target under the OPEC+ deal, according to people familiar with figures from the country’s Energy Ministry. Russia allegedly produced 8.97 million barrels a day last month, Reuters reports.
- The US Energy Information Administration (EIA) reported a surprise build of 3.889 million barrels on Wednesday against an expected drawdown of 1.25 million barrels.
Oil Technical Analysis: You can’t buy the dip
Crude Oil prices are hitting a small curb at $71.46, a level that was also tested and rejected. on September 24 and 25. In case the situation does not further escalate in the Middle East, a quick unwind could happen on the back of this risk premium trade, with a slide back to $67.11 possible.
At current levels, $71.46 remains in focus after a brief false break last week. If a supportive catalyst remains present, a return to $75.27 (the January 12 high) could play out. Along the way towards that level, the 55-day Simple Moving Average (SMA) at $72.80 could ease the rally a bit. Once above $75.27, the first resistance to follow is $75.80, which aligns with the 100-day SMA.
On the downside, $67.11, a triple bottom in the summer of 2023, could still hold as support. If that is not the case, further down the next level is $64.38, the low from March and May 2023. Even $61.65 could come into play should a ceasefire emerge or if Israel signals it is done with its special operation into Lebanon.
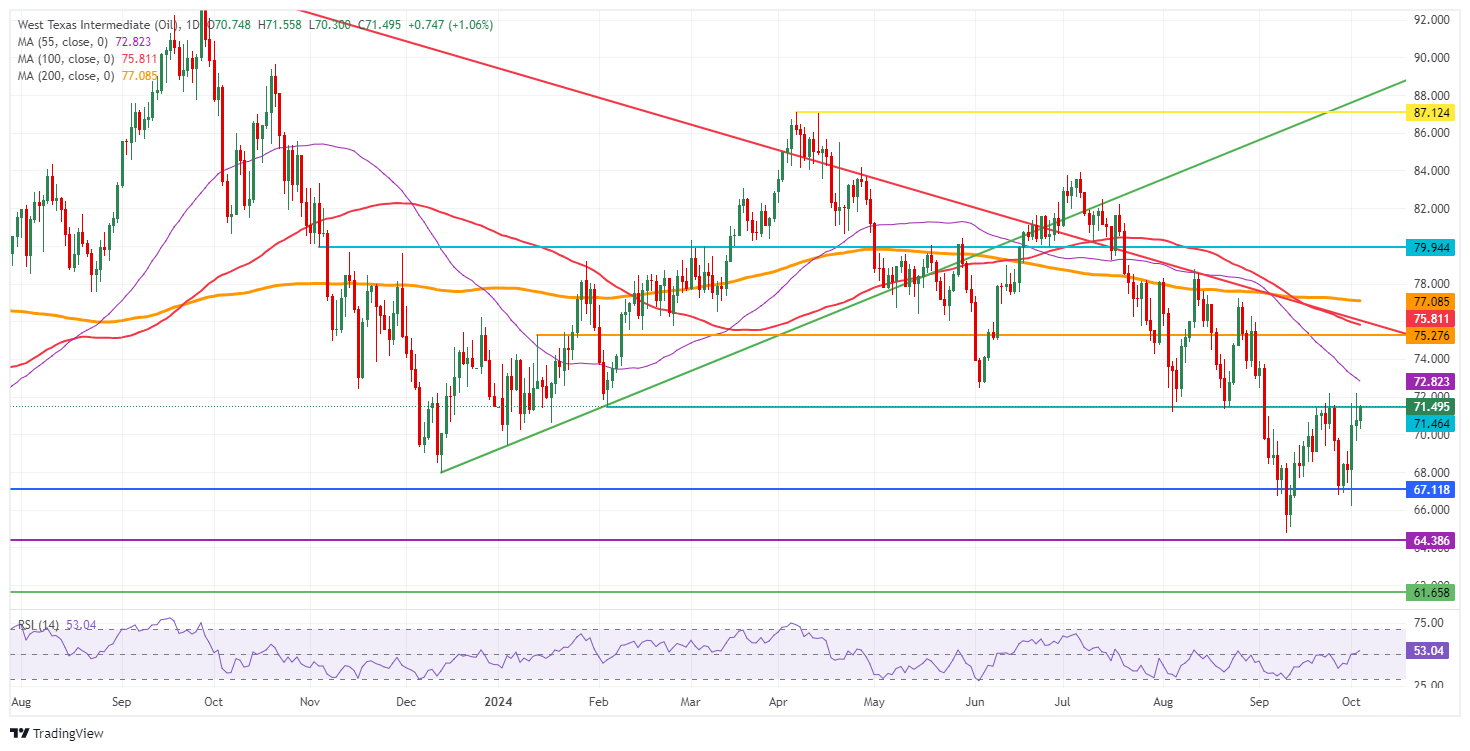
US WTI Crude Oil: Daily Chart
WTI Oil FAQs
WTI Oil is a type of Crude Oil sold on international markets. The WTI stands for West Texas Intermediate, one of three major types including Brent and Dubai Crude. WTI is also referred to as “light” and “sweet” because of its relatively low gravity and sulfur content respectively. It is considered a high quality Oil that is easily refined. It is sourced in the United States and distributed via the Cushing hub, which is considered “The Pipeline Crossroads of the World”. It is a benchmark for the Oil market and WTI price is frequently quoted in the media.
Like all assets, supply and demand are the key drivers of WTI Oil price. As such, global growth can be a driver of increased demand and vice versa for weak global growth. Political instability, wars, and sanctions can disrupt supply and impact prices. The decisions of OPEC, a group of major Oil-producing countries, is another key driver of price. The value of the US Dollar influences the price of WTI Crude Oil, since Oil is predominantly traded in US Dollars, thus a weaker US Dollar can make Oil more affordable and vice versa.
The weekly Oil inventory reports published by the American Petroleum Institute (API) and the Energy Information Agency (EIA) impact the price of WTI Oil. Changes in inventories reflect fluctuating supply and demand. If the data shows a drop in inventories it can indicate increased demand, pushing up Oil price. Higher inventories can reflect increased supply, pushing down prices. API’s report is published every Tuesday and EIA’s the day after. Their results are usually similar, falling within 1% of each other 75% of the time. The EIA data is considered more reliable, since it is a government agency.
OPEC (Organization of the Petroleum Exporting Countries) is a group of 12 Oil-producing nations who collectively decide production quotas for member countries at twice-yearly meetings. Their decisions often impact WTI Oil prices. When OPEC decides to lower quotas, it can tighten supply, pushing up Oil prices. When OPEC increases production, it has the opposite effect. OPEC+ refers to an expanded group that includes ten extra non-OPEC members, the most notable of which is Russia.
Recommended Articles


