

Oil defies bearish OPEC outlook and focuses on $80
- Oil price extends gains after some small profit taking during the Asian trading hours.
- Traders sent crude prices up near 3% on Monday even as the OPEC report cut the demand outlook.
- The US Dollar Index trades at the pivotal 103.18 level after being glued to it since last week.
Oil continues is winning streak for a fifth consecutive trading session after prices jumped substantially on Monday despite the bearish demand outlook from OPEC. The International Energy Agency (IEA) is following that narrative, pointing to the risk of a substantial surplus while OPEC is set to let loose of its production cuts. Still, geopolitical tensions over an immediate attack from Iran to Israel keep prices supported, and traders seem to be betting on OPEC deepening their production cuts to further support the black gold.
The US Dollar Index (DXY), which tracks the performance of the US Dollar against six major currencies, is getting torn between two major forces this Tuesday on the quote board. On the one hand, the much battered carry trades from last week are making a comeback against the US Dollar. On the other side, the Greenback itself is outpacing the Japanese Yen (JPY). This results in a near standstill in the DXY US Dollar Index chart ahead of Tuesday’s US Producer Price Index (PPI) numbers and Wednesday’s Consumer Price Index (CPI) release.
At the time of writing, Crude Oil (WTI) trades at $78.25 and Brent Crude at $81.40.
Oil news and market movers: OPEC, IEA agree on bearish outlook
- The monthly IEA report shows that OPEC output rose by 250,000 barrels per day against previous month. Saudi Arabia and Iraq were the main drivers for the additional output.
- Even if OPEC cancels its plans to hike production back to normal, inventories will accumulate next year by 920,000 barrels a day amid booming supplies from the US, Guyana and Brazil, according to the IEA.
- Reuters reports ahead of the numbers from the American Petroleum Institute (API) that the US reserves should be depleted with summer demand having peaked by now.
- The weekly Crude Oil Stock print will be released by the American Petroleum Institute at 20:30 GMT. The previous number showed a marginal build of only 180,000 barrels.
Oil Technical Analysis: Risk of rejection
Oil price is shooting for the stars since Monday. The fact that both OPEC and the IEA are seeing substantial supply surplus at hand has traders doubling down on changes from OPEC, away from its commitment to reduce production limitations. Instead, more output might be needed, with risk of a split division within OPEC again.
On the upside, two other major moving averages are very close, with the 55-day Simple Moving Average (SMA) at $78.56 and the 100-day SMA at $79.83. If that 100-day SMA gets cleared, the $80 area opens up with an ultimate profit target level at around $87.12.
On the downside, the 200-day SMA came in for support on some profit taking in Asia at $77.69. Should price action slide back below it, a quick dip to $75.27 could be in the cards in a washout of this rally. A full unwind back to the start of the rally near $72.00 is possible in case of some bearish headlines or catalyst.
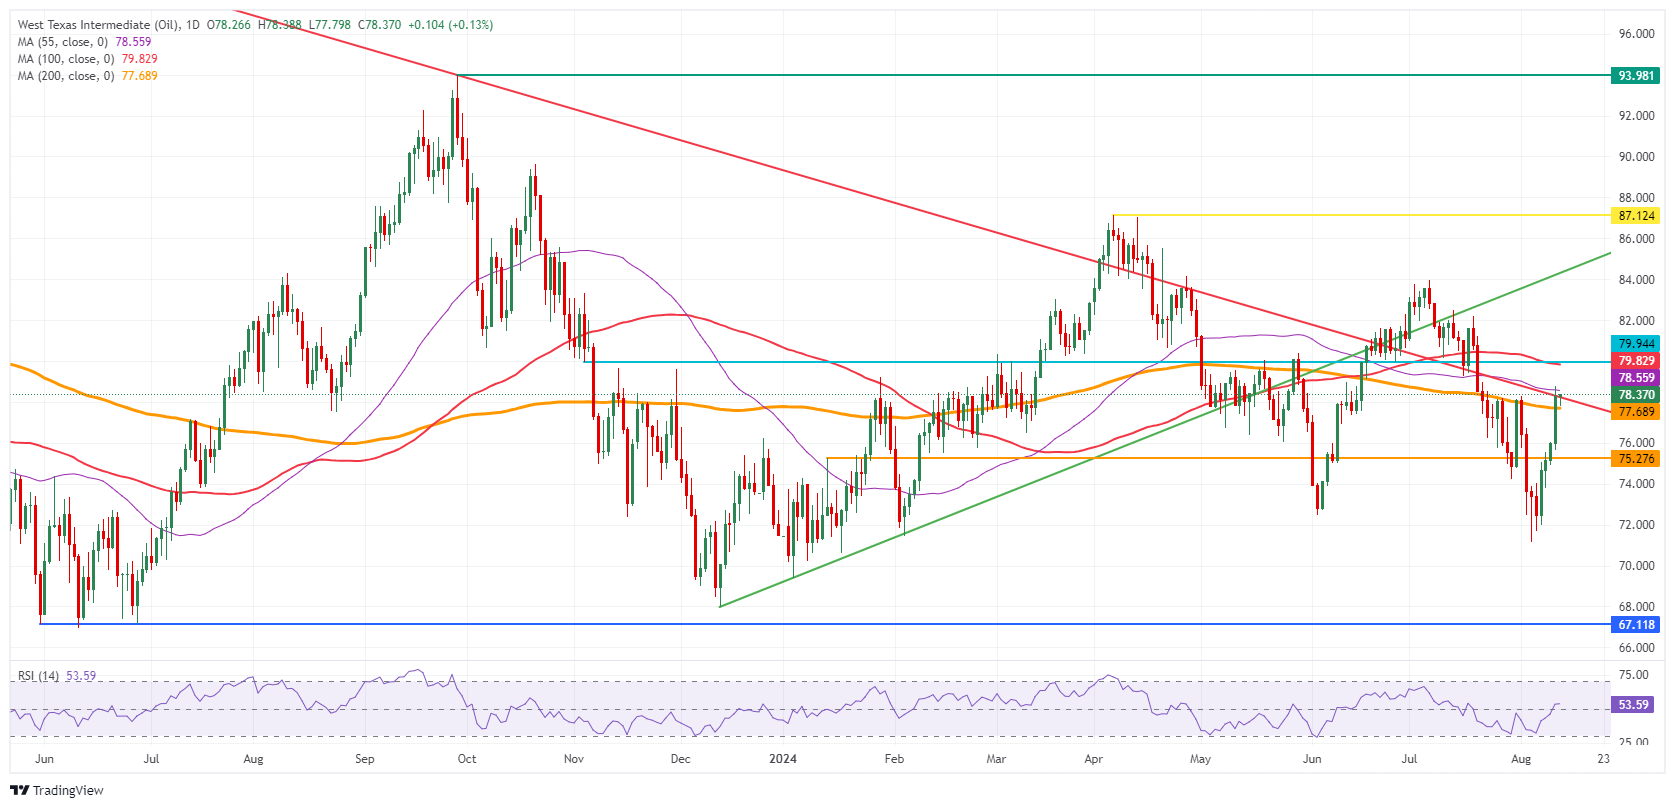
US WTI Crude Oil: Daily Chart
WTI Oil FAQs
WTI Oil is a type of Crude Oil sold on international markets. The WTI stands for West Texas Intermediate, one of three major types including Brent and Dubai Crude. WTI is also referred to as “light” and “sweet” because of its relatively low gravity and sulfur content respectively. It is considered a high quality Oil that is easily refined. It is sourced in the United States and distributed via the Cushing hub, which is considered “The Pipeline Crossroads of the World”. It is a benchmark for the Oil market and WTI price is frequently quoted in the media.
Like all assets, supply and demand are the key drivers of WTI Oil price. As such, global growth can be a driver of increased demand and vice versa for weak global growth. Political instability, wars, and sanctions can disrupt supply and impact prices. The decisions of OPEC, a group of major Oil-producing countries, is another key driver of price. The value of the US Dollar influences the price of WTI Crude Oil, since Oil is predominantly traded in US Dollars, thus a weaker US Dollar can make Oil more affordable and vice versa.
The weekly Oil inventory reports published by the American Petroleum Institute (API) and the Energy Information Agency (EIA) impact the price of WTI Oil. Changes in inventories reflect fluctuating supply and demand. If the data shows a drop in inventories it can indicate increased demand, pushing up Oil price. Higher inventories can reflect increased supply, pushing down prices. API’s report is published every Tuesday and EIA’s the day after. Their results are usually similar, falling within 1% of each other 75% of the time. The EIA data is considered more reliable, since it is a government agency.
OPEC (Organization of the Petroleum Exporting Countries) is a group of 13 Oil-producing nations who collectively decide production quotas for member countries at twice-yearly meetings. Their decisions often impact WTI Oil prices. When OPEC decides to lower quotas, it can tighten supply, pushing up Oil prices. When OPEC increases production, it has the opposite effect. OPEC+ refers to an expanded group that includes ten extra non-OPEC members, the most notable of which is Russia.
Recommended Articles


