

Oil torn between inflation slowdown and Houston reopening
- Oil prices edge higher for the third straight day on Friday.
- Traders see both bearish and bullish elements in the mix, which could see Oil prices close off this week flat.
- The US Dollar Index trades above 104.00 after its steep decline on Thursday.
Oil prices are being torn in half, with several bearish and bullish elements in the balance. Although Oil started the week on the back foot, it is possibly on track to minimize the incurred losses for this week and might even be flat overall by Friday’s close. The question will be how much front running will take place this summer ahead of the initial interest rate cut by the US Federal Reserve (Fed) expected in September and assumptions that demand will boom on the back of that.
Meanwhile, the US Dollar Index (DXY), which tracks the performance of the US Dollar against six major currencies, is building on its road to recovery after the meltdown it went through on Thursday after US Consumer Price Index (CPI) data for June showed a pickup in disinflation. Markets scrambled to lock in an interest rate cut for September, which means the value of the US Dollar had to be adjusted because of the rate differential with other currencies getting narrower. On Friday, traders will be looking if the producer side of the economic system is seeing disinflation picking up as well with June’s Producer Price Index (PPI) release.
At the time of writing, Crude Oil (WTI) trades at $82.34 and Brent Crude at $85.54
Oil news and market movers: China imports steady
- Bloomberg reports that China’s Oil imports remained steady throughout June despite local lacklustre demand. That was different for Liquified Natural Gas (LNG), where imports declined substantially for the same period.
- The Port of Houston is fully reopened, with vessel traffic back to normal on Thursday, Reuters reports. The Port was shut down after Hurricane Beryl passed through the region at the beginning of the week.
- Oil futures have seen a pickup in demand since Thursday, with traders positioning for a surge in demand near September, when the Fed is expected to cut interest rates. Currently postponed construction projects should be set to restart again, according to Reuters.
- The Wall Street Journal reports that the International Energy Administration revised down its recent 2025 forecast. Supply is set to swell with OPEC unwinding its production cuts, while demand is set to decline from 1 million to 980,000 barrels per day. This would leave the Oil markets with a surplus supply .
Oil Technical Analysis: The comeback kid
Oil prices are in the green for a third day in a row, and should the recovery pick up a little bit on Friday, the performance could close off flat and avoid a weekly loss. For next week, if Crude can pull off a daily close above the green ascending trend line in the chart below, that would be a bullish signal for traders. Expect to see more investors pile into Crude futures once Fed officials confirm timing for September looks fine for an initial interest rate cut.
On the upside, the July high near $84.00 is the first near-resistance level to look for. Once beyond that, a new high for June and July will be printed as Crude prices stretch higher. The Relative Strength Index (RSI) is already at 58 and will overheat quite quickly, with $87.12, the 2024 high, still within reach.
On the downside, the big belt of Simple Moving Averages (SMA) should work now as support and no longer allow any moves below it. That means the 100-day SMA at $80.32, the 55-day SMA at $79.26, and the 200-day SMA at $78.46 should avoid any dips below $78.00. Should those levels not hold, another drop back to $75 could occur.
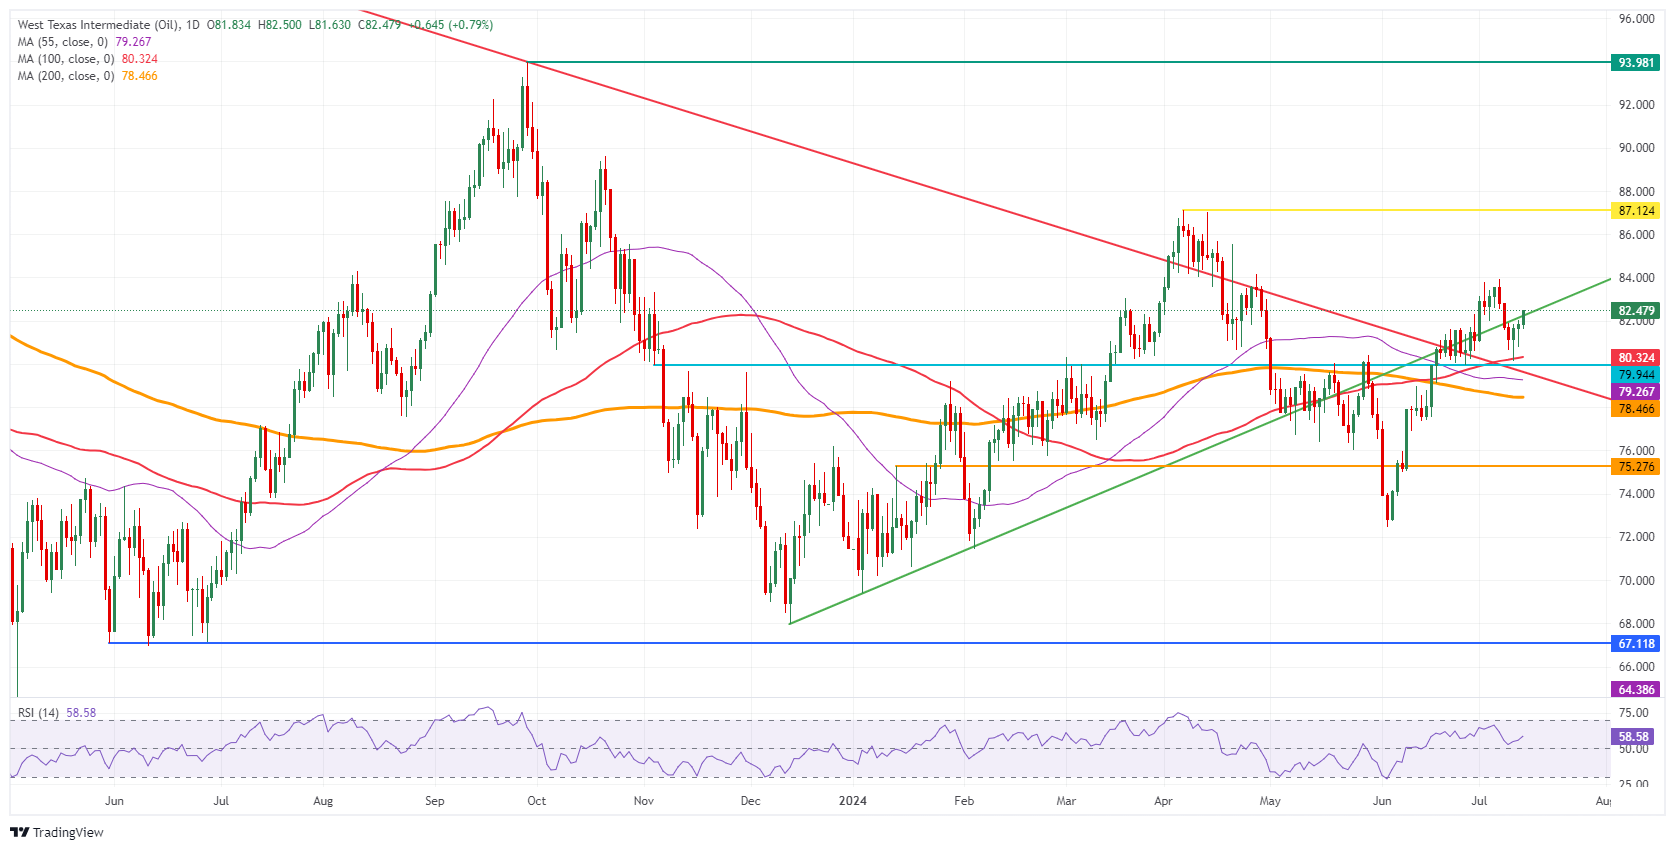
US WTI Crude Oil: Daily Chart
Brent Crude Oil FAQs
Brent Crude Oil is a type of Crude Oil found in the North Sea that is used as a benchmark for international Oil prices. It is considered ‘light’ and ‘sweet’ because of its high gravity and low sulfur content, making it easier to refine into gasoline and other high-value products. Brent Crude Oil serves as a reference price for approximately two-thirds of the world's internationally traded Oil supplies. Its popularity rests on its availability and stability: the North Sea region has well-established infrastructure for Oil production and transportation, ensuring a reliable and consistent supply.
Like all assets supply and demand are the key drivers of Brent Crude Oil price. As such, global growth can be a driver of increased demand and vice versa for weak global growth. Political instability, wars, and sanctions can disrupt supply and impact prices. The decisions of OPEC, a group of major Oil-producing countries, is another key driver of price. The value of the US Dollar influences the price of Brent Crude Oil, since Oil is predominantly traded in US Dollars, thus a weaker US Dollar can make Oil more affordable and vice versa.
The weekly Oil inventory reports published by the American Petroleum Institute (API) and the Energy Information Agency (EIA) impact the price of Brent Crude Oil. Changes in inventories reflect fluctuating supply and demand. If the data shows a drop in inventories it can indicate increased demand, pushing up Oil price. Higher inventories can reflect increased supply, pushing down prices. API’s report is published every Tuesday and EIA’s the day after. Their results are usually similar, falling within 1% of each other 75% of the time. The EIA data is considered more reliable, since it is a government agency.
OPEC (Organization of the Petroleum Exporting Countries) is a group of 13 Oil producing nations who collectively decide production quotas for member countries at twice-yearly meetings. Their decisions often impact Brent Crude Oil prices. When OPEC decides to lower quotas, it can tighten supply, pushing up Oil prices. When OPEC increases production, it has the opposite effect. OPEC refers to an expanded group that includes ten extra non-OPEC members, the most notable of which is Russia.
Recommended Articles


