

Crude Oil rally stumbles after Fed leans away from rate cuts, WTI falls back below $78
- Crude Oil markets rose on Wednesday before trimming gains post-Fed.
- WTI peaked near $79.00 per barrel before falling back into the day’s range.
- Odds of two rate cuts in 2024 are evaporating, crimping risk appetite.
West Texas Intermediate (WTI) US Crude Oil rose through Wednesday’s early trading, hitting a fresh June high near $79.00 per barrel before slumping back below $78.00 after the Energy Information Administration (EIA) reported another buildup in US Crude Oil supplies coupled with another Federal Reserve (Fed) rate hold.
Fed Chairman Jerome Powell hit markets with a cautious tone on rate cut expectations, noting that inflation progress still has a lot of progress to make before the Fed will be confident enough to cut rate. The Federal Open Market Committee (FOMC) has trimmed expectations of rate cuts, with the FOMC’s Summary of Economic Projections (SEP) or “dot plot” expecting only a single quarter-point cut in 2024 according to the median projection.
Broader market sentiment tilted firmly into the bullish early Wednesday after US Consumer Price Index (CPI) inflation cooled faster than expected in May, with headline CPI inflation easing to 0.0% MoM compared to the forecast tick down to 0.1% from the previous 0.3%, and YoY Core CPI inflation also eased to 3.4% versus the forecast 3.5% and last of 3.6%. Market hopes for a September rate cut of at least 25 basis points peaked over 70% in the early US trading session before Fed caution swamped out sentiment.
The Energy Information Administration (EIA) reported another unexpected buildup in US Crude Oil Stocks Change for the week ended June 7, adding 3.73 million barrels to the previous week’s 1.233 million, washing out the forecast contraction of -1.55 million.
WTI technical outlook
WTI peaked just shy of $79.00 per barrel on Wednesday before facing a technical rejection from a descending trendline drawn from 2024’s peak bids at $87.12, and near-term strength goes to the bears. However, technical support comes from the 200-hour Exponential Moving Average (EMA) rising into $76.60 and could limit downside momentum.
Wednesday’s bullish peak ran aground of heavy resistance from the 200-day EMA at $78.83, and US Crude Oil’s recovery from near-term lows near $72.45 could face another turn lower.
WTI hourly chart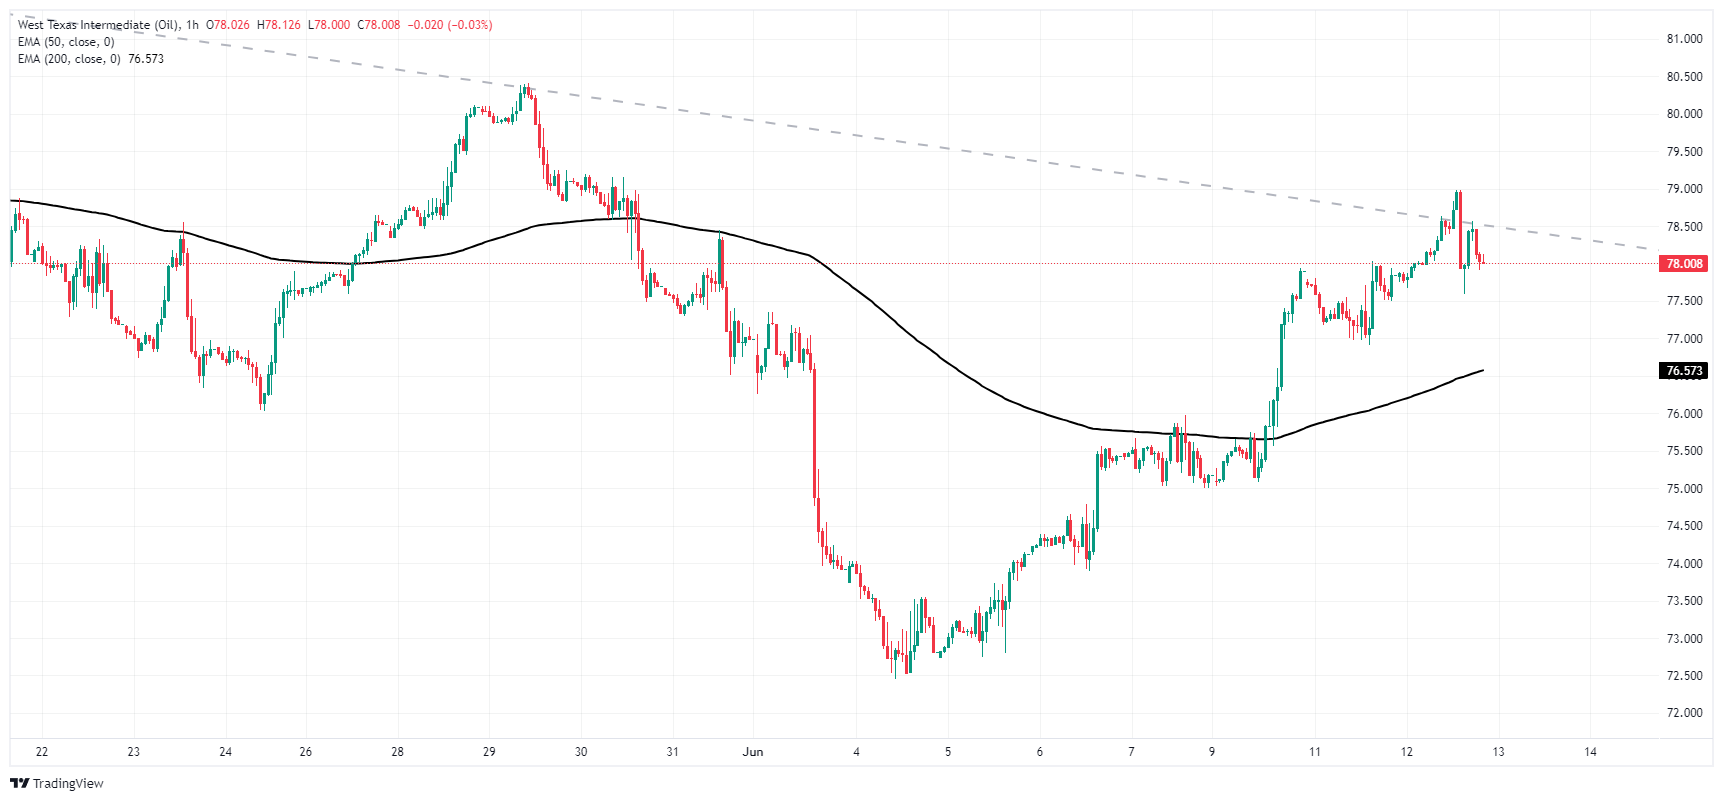
WTI daily chart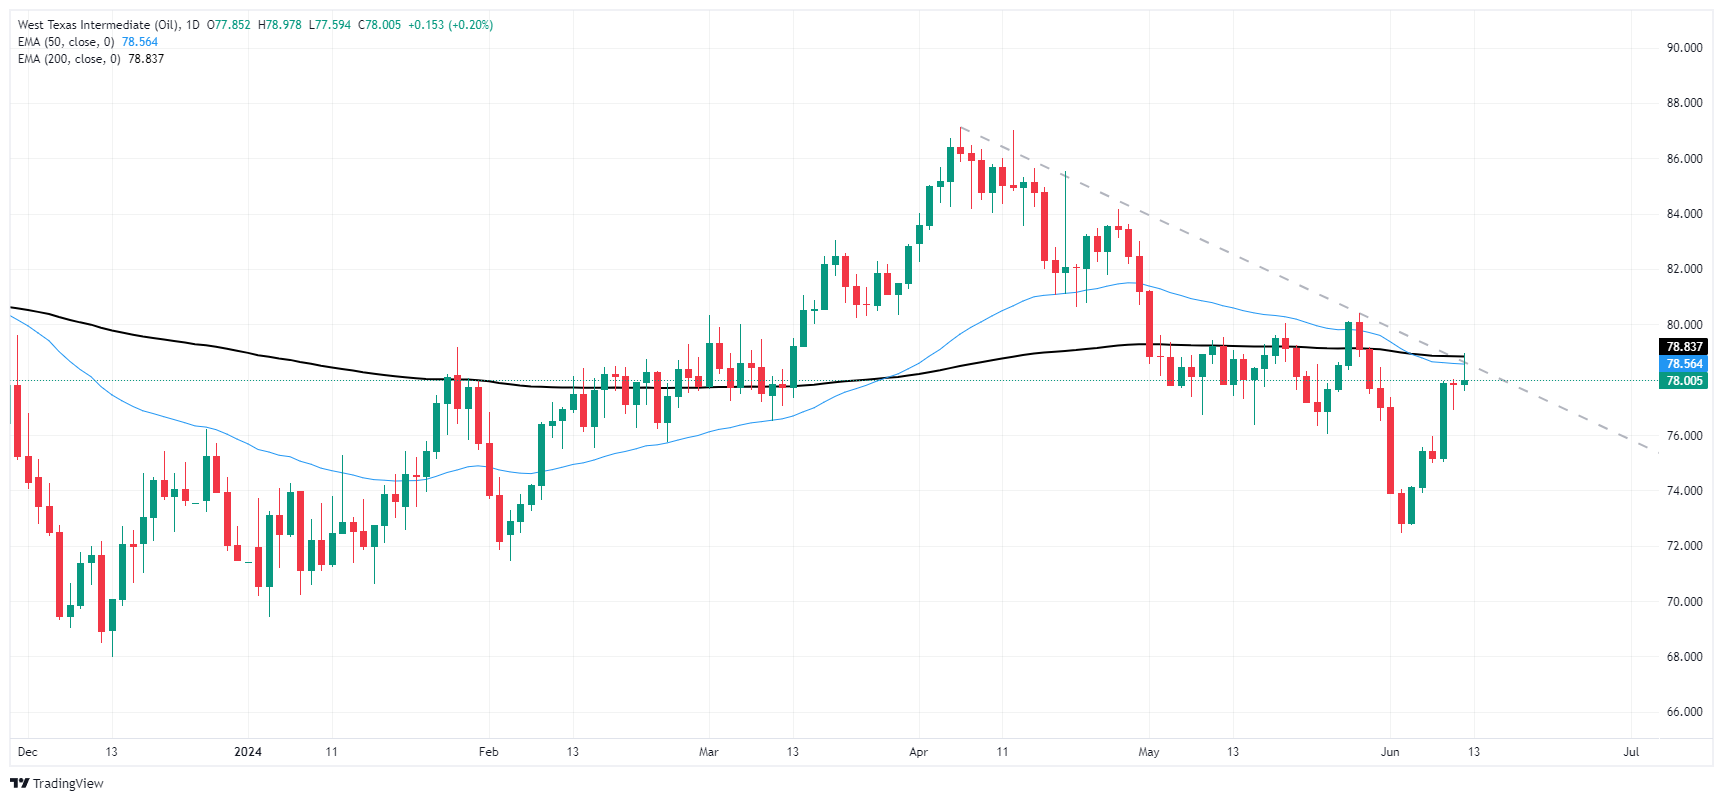
Recommended Articles


