

Gold pulls back after reaching oversold extremes
- Gold is pulling back after last week’s steep sell-off.
- Traders are keen to wait for US inflation data later this week to reassess fundamentals.
- Gold is probably forming a consolidation or continuation pattern within a downtrend that is likely to go lower.
Gold (XAU/USD) is trading in the $2,340s, making a modest pullback from oversold levels on Monday. Markets are quiet ahead of potentially market-moving US inflation data later in the week. Public holidays in the UK and the US further reduce volumes.
Gold pulls back after steep sell-off
Gold price dropped from a peak of $2,450 to a low of $2,325 last week, on the back of changing expectations for the future path of US interest rates.
Better-than-expected US economic data last week led to a revision of market expectations for when the US Federal Reserve (Fed) is foreseen lowering interest rates. Whilst last week interest-rate future’s markets gave a probability of 65% that the Fed will lower its fed funds rate by 0.25% at its September meeting, today they are only giving it odds of 49%, according to the CME Fedwatch tool.
The maintenance of interest rates at high levels is negative for non-yielding Gold because it increases the opportunity cost of holding the precious metal.
Technical Analysis: Gold consolidates in new downtrend
Gold price is consolidating after a steep decline. Last week’s sell-off took it below a major trendline and has ushered in a new more bearish technical environment.
Gold is probably in a short-term downtrend now, favoring short positions over longs.
XAU/USD 4-hour Chart
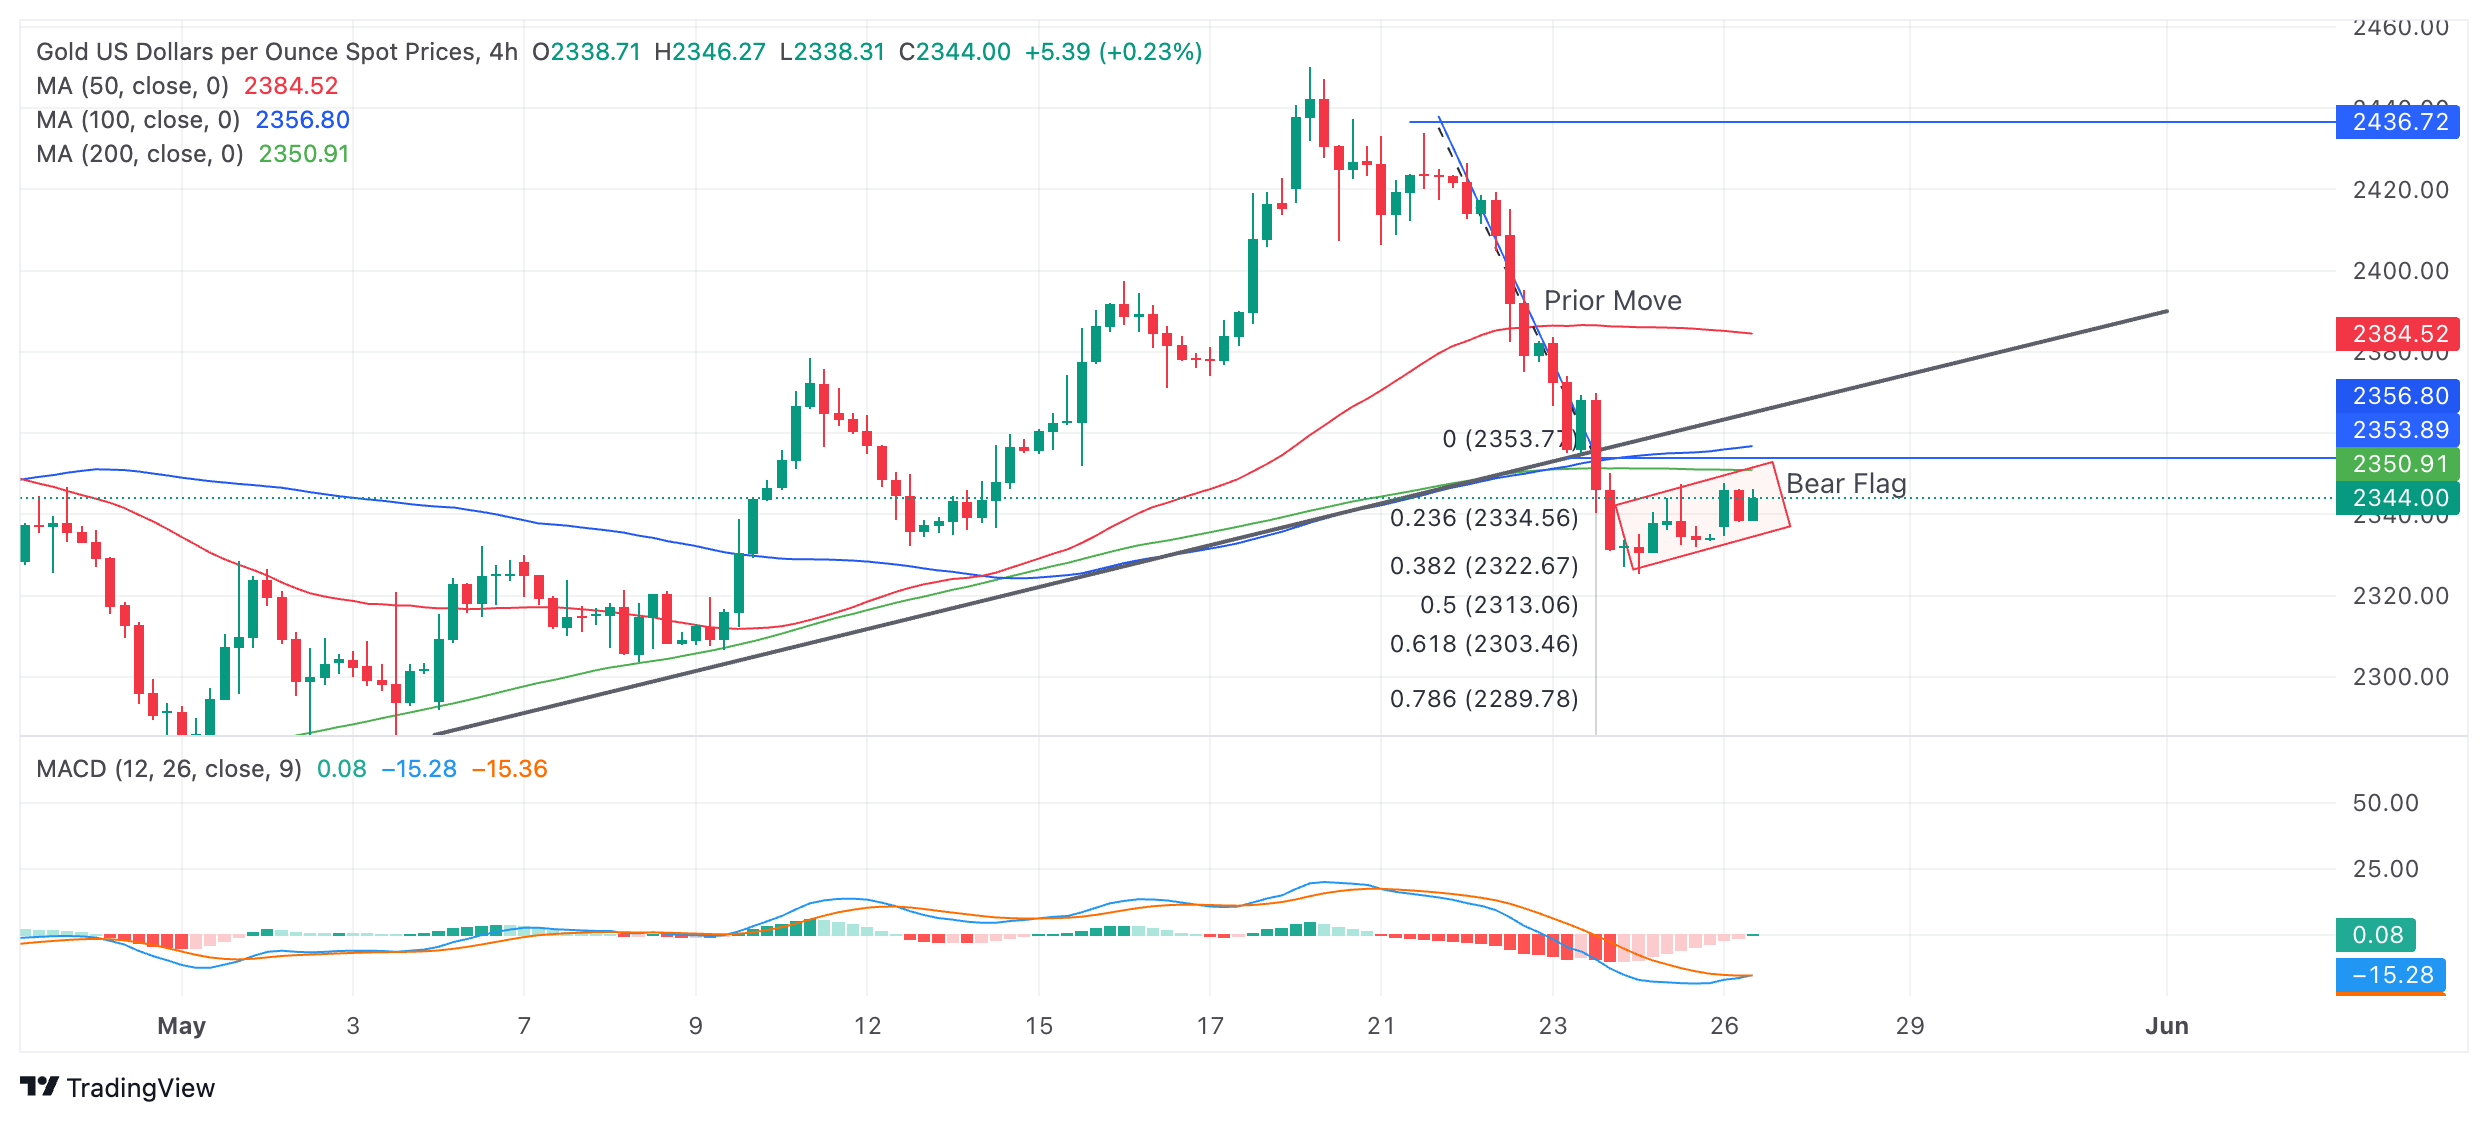
The precious metal is seen pulling back (red rectangle) on the 4-hour chart used to assess the short-term trend. The pullback is relatively shallow, however, and looks vulnerable to break down. The pullback might even be an evolving Bear Flag continuation price pattern. If so, it would suggest substantial downside – to at least $2,300 – in the event of a break below the $3,325 May 24 lows.
Last week’s decisive break of the major trendline indicates a likely follow-through lower. The conservative target for the follow-through is $2,303 (the Fibonacci 0.618 extrapolation of the down move prior to the break – from $2,435 to $2,355).
A more bearish move could see Gold fall all the way down to $2,272 (the 100% extrapolation of the move prior to the break). The latter level is also the support from the May 3 lower high. A break below the $2,325 lows would provide confirmation of more downside to these targets.
The Moving Average Convergence Divergence (MACD) indicator is attempting to cross above its signal line. If it is successful, it will give a buy signal and perhaps indicate the possibility the pullback is developing into a stronger upside correction
The precious metal’s medium and long-term trends are still bullish, further suggesting the risk of a recovery remains high, yet price action is not supporting a resumption hypothesis.
A decisive break back above the trendline at $2,360 would, however, provide evidence of a recovery and reversal of the short-term downtrend.
A decisive break would be one accompanied by a long green bullish candle or three green candles in a row.
Gold FAQs
Gold has played a key role in human’s history as it has been widely used as a store of value and medium of exchange. Currently, apart from its shine and usage for jewelry, the precious metal is widely seen as a safe-haven asset, meaning that it is considered a good investment during turbulent times. Gold is also widely seen as a hedge against inflation and against depreciating currencies as it doesn’t rely on any specific issuer or government.
Central banks are the biggest Gold holders. In their aim to support their currencies in turbulent times, central banks tend to diversify their reserves and buy Gold to improve the perceived strength of the economy and the currency. High Gold reserves can be a source of trust for a country’s solvency. Central banks added 1,136 tonnes of Gold worth around $70 billion to their reserves in 2022, according to data from the World Gold Council. This is the highest yearly purchase since records began. Central banks from emerging economies such as China, India and Turkey are quickly increasing their Gold reserves.
Gold has an inverse correlation with the US Dollar and US Treasuries, which are both major reserve and safe-haven assets. When the Dollar depreciates, Gold tends to rise, enabling investors and central banks to diversify their assets in turbulent times. Gold is also inversely correlated with risk assets. A rally in the stock market tends to weaken Gold price, while sell-offs in riskier markets tend to favor the precious metal.
The price can move due to a wide range of factors. Geopolitical instability or fears of a deep recession can quickly make Gold price escalate due to its safe-haven status. As a yield-less asset, Gold tends to rise with lower interest rates, while higher cost of money usually weighs down on the yellow metal. Still, most moves depend on how the US Dollar (USD) behaves as the asset is priced in dollars (XAU/USD). A strong Dollar tends to keep the price of Gold controlled, whereas a weaker Dollar is likely to push Gold prices up.
Recommended Articles


