

Gold puts in a floor on mounting geopolitical concerns

Source Fxstreet
  • Gold has cushioned its decline as investors seek it out for its safe-haven qualities on Friday. 
  • Mounting geopolitical risks from multiple hotspots – China, Gaza and Ukraine – are sending investors fleeing for safety. 
  • Stronger-than-expected US data on Thursday sent Gold into a downward spiral as higher interest rates become normalized. 

Gold (XAU/USD) puts in a temporary floor under the recent sell-off on Friday, trading a quarter of a percent higher at around the $2,330s, as a combination of market and geopolitical concerns lead investors to seek solace in its safe-haven qualities. 

Gold retrenches on geopolitical concerns

The news that China has started a second day of war games around Taiwan, as well as the decision by Ireland, Norway and Spain to recognise the independent state of Palestine, have ratcheted up geopolitical tensions and impacted markets, helping drive demand for Gold. 

Asian stocks are broadly lower on Friday, with the Hang Seng down 1.71%, the Shanghai Composite down 0.90%, and the Nikkie closing 1.36% lower. Investor concerns about high interest rates were a further factor weighing on sentiment.  

Gold price weakened after US data 

A slew of unexpectedly strong US economic data took its toll on the price of Gold on Thursday. 

The higher-than-expected US Purchasing Manager Index (PMI) preliminary data for May, especially in the Services sector – which has been singled out as a major contributor to high inflation – has dialed back bets that the Federal Reserve (Fed) will implement early interest-rate cuts. This is negative for non-yielding Gold as it increases the opportunity cost of holding the precious metal. 

India imports fall

The relatively high price of Gold may also be acting as a counterweight to demand in India, according to Reuters, who notes a fall in imports to the country as “high prices encourage retail customers to exchange old jewelry for new products”, reports FXStreet Editor Lallalit Srijandorn.  

Technical Analysis: Gold breaks below major trendline

Gold price (XAU/USD) has decisively broken below a major trendline for the uptrend since February, ushering in a new more bearish technical atmosphere. 

The steep decline from the all-time highs registered on Monday now suggests Gold is probably in a short-term downtrend, favoring short positions over longs. 

XAU/USD 4-hour Chart
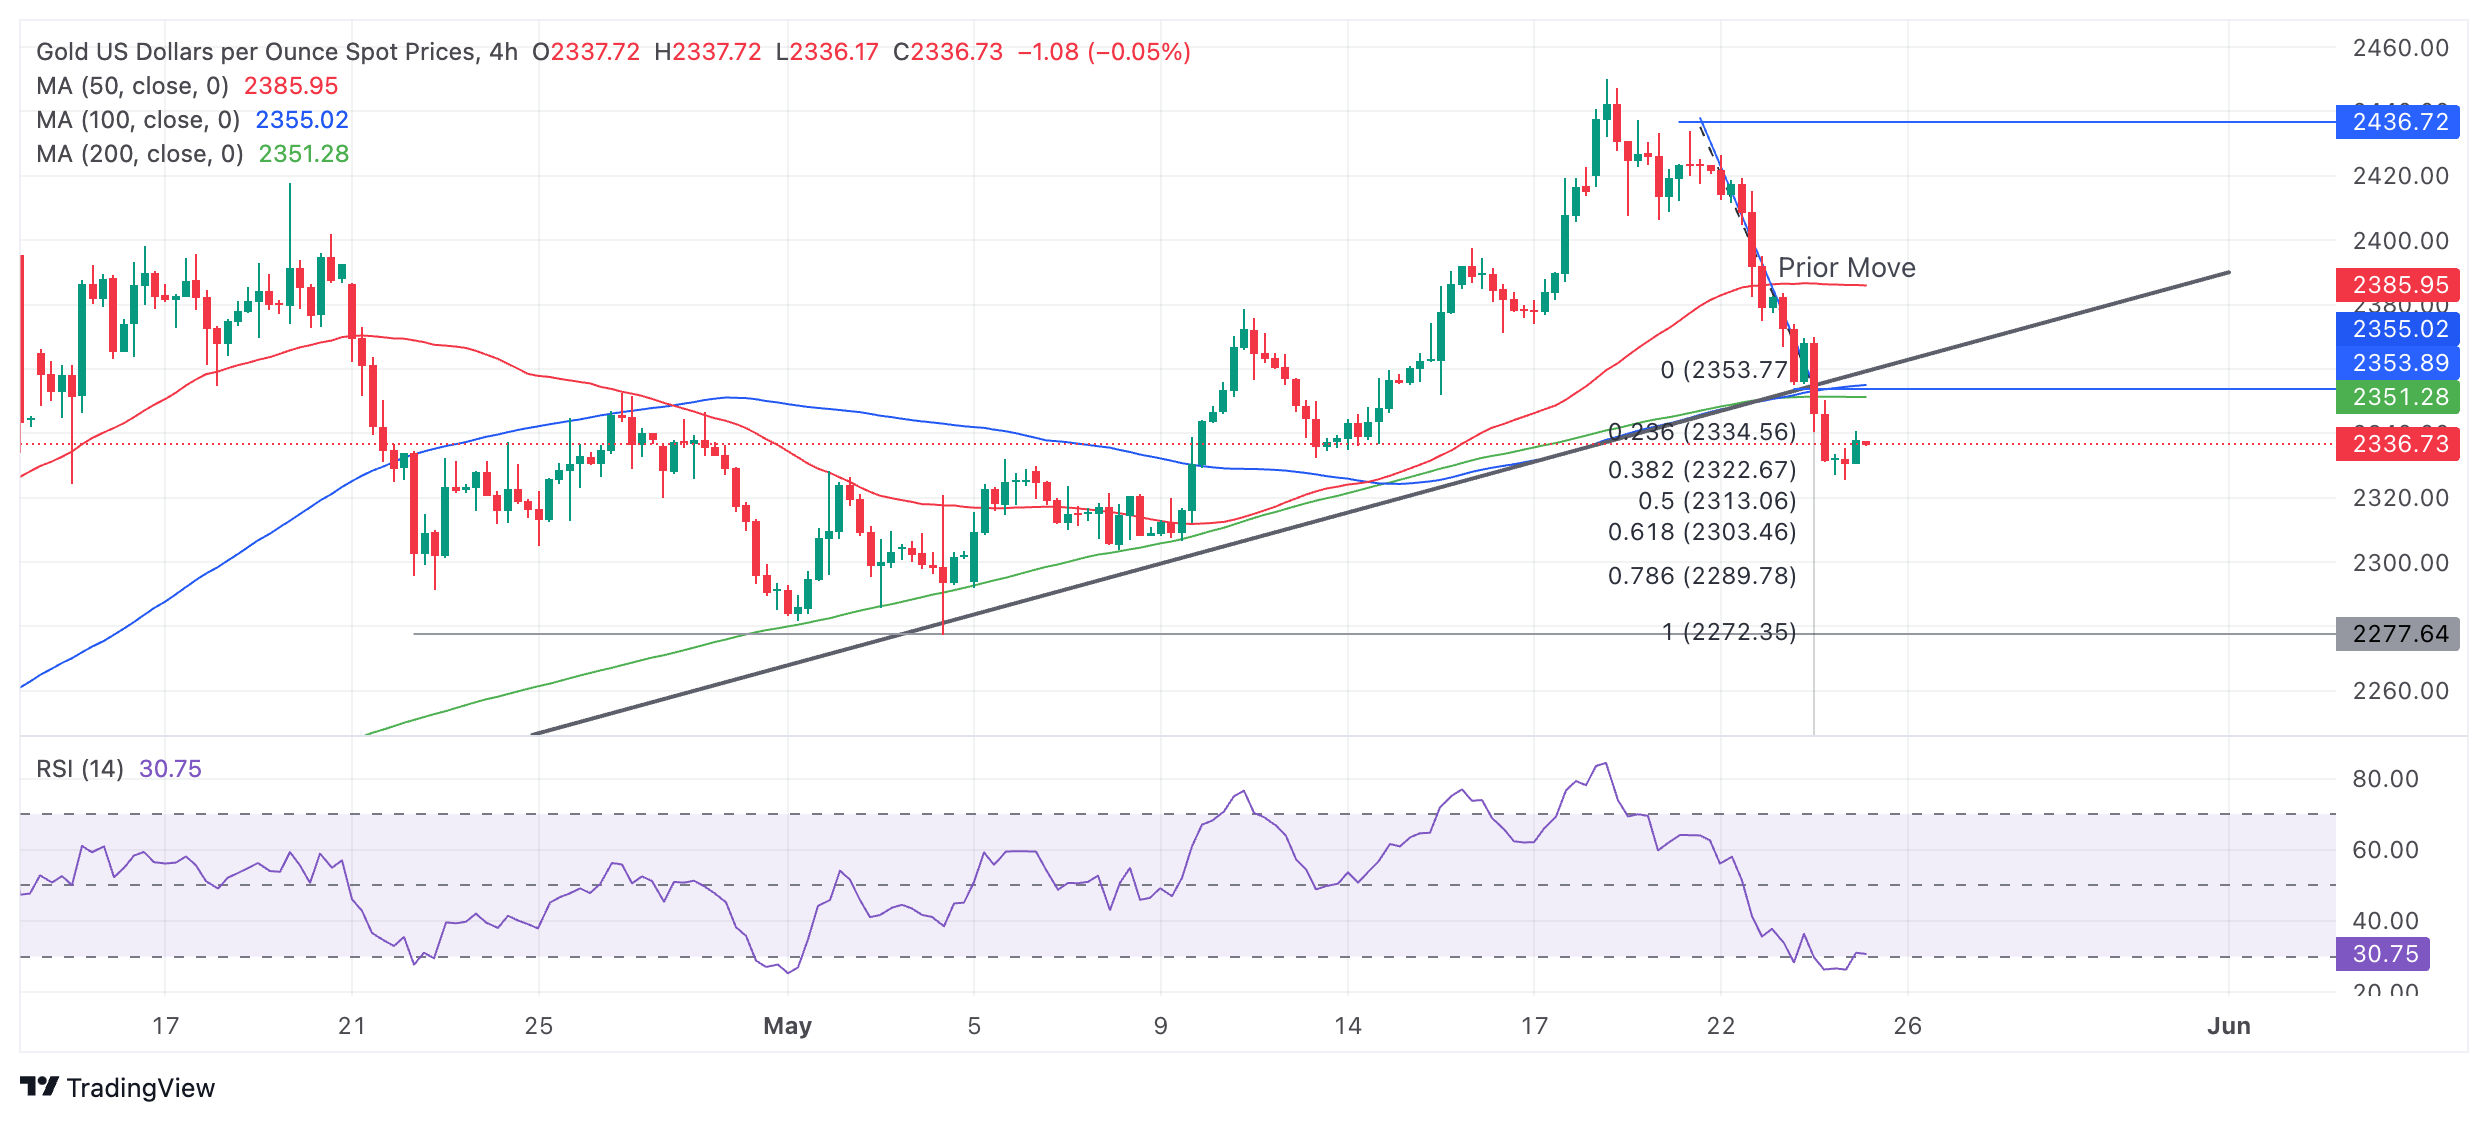
The penetration of the major trendline signals Gold will probably now fall to a conservative target at $2,303 (Fibonacci 0.618 extrapolation of the prior down move from $2,435 to $2,355) or all the way down to $2,272 (100% of the prior down move). The latter level is also the support from the May 3 lower high. A break below the $2,325 lows would provide confirmation of more downside to these targets. 

The Relative Strength Index (RSI) became oversold and then reentered neutral territory on the previous bar, suggesting an increased chance of a pull back. It is also possible Gold could correct higher and return to the trendline in a throwback move before rolling over and going lower. 

The precious metal’s medium and long-term trends are still bullish, suggesting the risk of a recovery remains high, yet price action does not suggest this is currently the case.

A decisive break back above the trendline at $2,360 would provide evidence of a recovery and reversal of the short-term downtrend. 

A decisive break would be one accompanied by a long green bullish candle or three green candles in a row. 


Disclaimer: For information purposes only. Past performance is not indicative of future results.
placeholder
US September CPI preview: inflation set to hit 3.7% — will the Fed hike in December?US September CPI lands Wednesday with headline inflation seen at 3.7% y/y and core at 0.2% m/m. December hike odds sit near 70% — here are the scenarios, the calendar and the key levels.
Author  Irene Q.
Oct 10, Sat
US September CPI lands Wednesday with headline inflation seen at 3.7% y/y and core at 0.2% m/m. December hike odds sit near 70% — here are the scenarios, the calendar and the key levels.
placeholder
Yen inches toward 159 as Tokyo reopens — where is the line in the sand before 160?USD/JPY traded around 158.5 on Tuesday after Monday's 158.60 close — the highest since September 24 — as Tokyo reopened and the market re-focused on two dates dominating the yen calendar: the G20 finance ministers' meeting in Bangkok on October 15 and the Bank of Japan's October 30 decision. Here are the three forces leaning on the yen, the positioning picture, and the scenarios into Wednesday's US CPI.
Author  Irene Q.
Oct 13, Tue
USD/JPY traded around 158.5 on Tuesday after Monday's 158.60 close — the highest since September 24 — as Tokyo reopened and the market re-focused on two dates dominating the yen calendar: the G20 finance ministers' meeting in Bangkok on October 15 and the Bank of Japan's October 30 decision. Here are the three forces leaning on the yen, the positioning picture, and the scenarios into Wednesday's US CPI.
placeholder
Strong profits, falling shares: bank earnings day one meets a memory-chip rout — with CPI and ASML aheadGoldman Sachs blew past estimates (EPS $17.01 vs $13.09 expected, profit +33%) while JPMorgan missed ($5.75 vs $5.93) and Wells Fargo fell 3% — yet the S&P 500 finished flat at 7,805.45, pinned below its record close as a memory-chip rout (SOX −2.67%, Micron under $1,000) kept the pressure on. Tonight brings the week's decider: US September CPI at 8:30 ET, then Bank of America, Morgan Stanley, BlackRock and ASML before the open. Here are the levels, both cases, and the watch list.
Author  Irene Q.
Yesterday 06: 06
Goldman Sachs blew past estimates (EPS $17.01 vs $13.09 expected, profit +33%) while JPMorgan missed ($5.75 vs $5.93) and Wells Fargo fell 3% — yet the S&P 500 finished flat at 7,805.45, pinned below its record close as a memory-chip rout (SOX −2.67%, Micron under $1,000) kept the pressure on. Tonight brings the week's decider: US September CPI at 8:30 ET, then Bank of America, Morgan Stanley, BlackRock and ASML before the open. Here are the levels, both cases, and the watch list.
placeholder
Bitcoin's V-shaped rebound: from $80,953 back above $83,000 — spot buyers step in as the Fed softens, but ETF outflows lingerBitcoin slid to $80,953 on October 13 — then snapped back above $83,000, reclaiming the 81,847–82,305 'golden zone' on spot-led buying as Williams and Waller cooled the Fed's hawkish tone and the dollar pulled back from its 18-month high. But October ETF outflows near $386 million and a fear-and-greed reading of 56 say the repair is unfinished. Here are the levels, the transmission chain and both cases ahead of tonight's US CPI.
Author  Suzie
Yesterday 06: 36
Bitcoin slid to $80,953 on October 13 — then snapped back above $83,000, reclaiming the 81,847–82,305 'golden zone' on spot-led buying as Williams and Waller cooled the Fed's hawkish tone and the dollar pulled back from its 18-month high. But October ETF outflows near $386 million and a fear-and-greed reading of 56 say the repair is unfinished. Here are the levels, the transmission chain and both cases ahead of tonight's US CPI.
placeholder
Gold Price Analysis Today | Forex Gold Analysis | XAU/USD Analysis - October 14, 2026Get the latest gold price analysis, forex gold insights, and XAU/USD analysis for October 14, 2026. Read on for the details.
Author  Mitrade
Yesterday 07: 11
Get the latest gold price analysis, forex gold insights, and XAU/USD analysis for October 14, 2026. Read on for the details.
Related Instrument
goTop
quote