Silver Price Forecast: XAG/USD finds support near $30.20 as investors digest hawkish FOMC minutes

Source Fxstreet
  • Silver price finds cushion near $30.20 as investors had already priced in hawkish interest rate guidance in FOMC minutes.
  • US weekly jobless claims were lower at 215K from the estimates of 220K in the week ending May 17.
  • The US Dollar and bond yields remain under pressure on firm Fed rate-cut prospects.

Silver price (XAU/USD) stabilizes near $30.20 after a vertical downfall in Thursday’s New York session. The sharp downside in the white metal was driven by hawkish Federal Open market Committee (FOMC) minutes of the May policy meeting, which indicated that officials also discussed over hiking interest rates again as progress in the disinflation process stalled in the first quarter of the year.

However, the impact of the hawkish FOMC communication is supposed to be temporary on bullions as views of policymakers were based on stubborn higher inflation data of the first quarter of this year. The consumer price inflation data for April was declined as expected and indicated that price pressures are on course to return to the desired rate of 2%.

10-year US Treasury yields drop to 4.42% as soft inflation data is an unfavorable scenario for interest rates remaining higher for a longer period. A decline in yields on interest-bearing assets diminishes the opportunity cost of holding an investment in non-yielding assets such as Silver.

The US Dollar Index (DXY) is down by 0.2%, trades near 104.70 as investors remain firm that the Federal Reserve (Fed) will start reducing interest rates from the September meeting.

The USD Index struggles to stabilize despite the United States (US) Department of Labor has posted lower Initial Jobless Claims than estimates for the week ending May 17. Number of individuals claiming jobless benefits for the first time were lower at 215K from the estimates of 220K.

Silver technical analysis

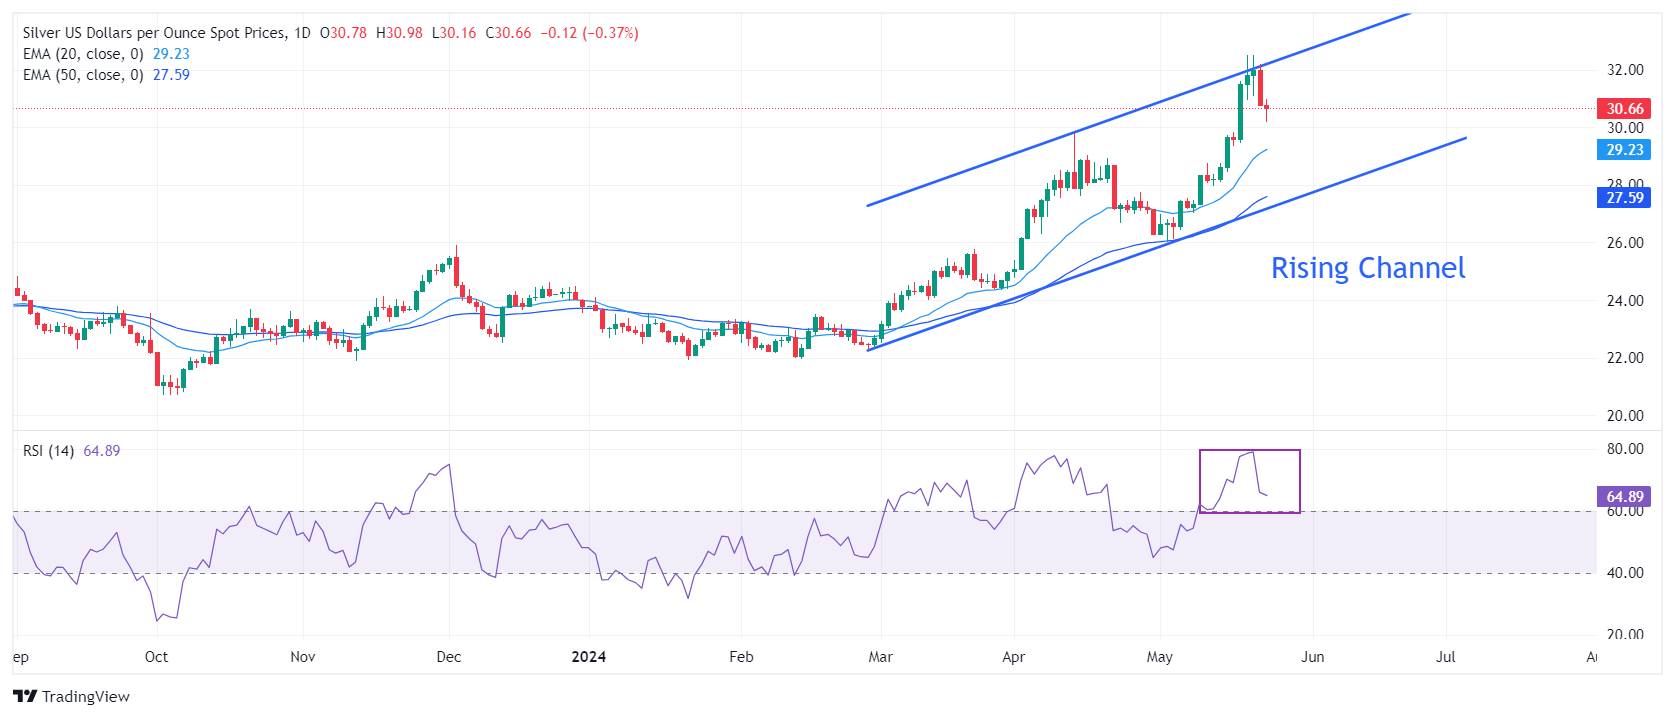
Silver price trades in a Rising Channel chart pattern formed on a daily timeframe in which each pullback move is considered as a buying opportunity by the market participants. Upward-sloping 20 and 50-day Exponential Moving Averages (EMAs) suggest that the near-term trend is bullish.

The 14-period Relative Strength Index (RSI) oscillates in the bullish range of 60.00-80.00, indicating that momentum has leaned on the upside.

Silver daily chart

XAG/USD

Overview
Today last price 30.6
Today Daily Change -0.18
Today Daily Change % -0.58
Today daily open 30.78
 
Trends
Daily SMA20 28.43
Daily SMA50 27.28
Daily SMA100 25.13
Daily SMA200 24.21
 
Levels
Previous Daily High 32.2
Previous Daily Low 30.76
Previous Weekly High 31.6
Previous Weekly Low 27.97
Previous Monthly High 29.8
Previous Monthly Low 24.75
Daily Fibonacci 38.2% 31.31
Daily Fibonacci 61.8% 31.65
Daily Pivot Point S1 30.29
Daily Pivot Point S2 29.8
Daily Pivot Point S3 28.84
Daily Pivot Point R1 31.73
Daily Pivot Point R2 32.69
Daily Pivot Point R3 33.18


Disclaimer: For information purposes only. Past performance is not indicative of future results.
placeholder
ECB Policy Outlook for 2026: What It Could Mean for the Euro’s Next MoveWith the ECB likely holding rates steady at 2.15% and the Fed potentially extending cuts into 2026, EUR/USD may test 1.20 if Eurozone growth proves resilient, but weaker growth and an ECB pivot could pull the pair back toward 1.13 and potentially 1.10.
Author  Mitrade
6 hours ago
With the ECB likely holding rates steady at 2.15% and the Fed potentially extending cuts into 2026, EUR/USD may test 1.20 if Eurozone growth proves resilient, but weaker growth and an ECB pivot could pull the pair back toward 1.13 and potentially 1.10.
placeholder
Dogecoin Is Repeating Its 2020 Accumulation Cycle, Analyst SaysCrypto analyst Cryptollica (@Cryptollica on X) is arguing that Dogecoin’s weekly chart is doing that familiar thing again: carving out a rounded base, bleeding off volatility, resetting momentum
Author  NewsBTC
6 hours ago
Crypto analyst Cryptollica (@Cryptollica on X) is arguing that Dogecoin’s weekly chart is doing that familiar thing again: carving out a rounded base, bleeding off volatility, resetting momentum
placeholder
TradingKey 2025 Markets Recap & Outlook | Gold Records Its Best Performance in Half a Century, Wall Street Predicts $5,000 Breach in 2026TradingKey - Amid increasing global economic uncertainty, gold is experiencing its best year since 1979, recording its largest gain in 46 years.As of December 26, the price of gold futures (New York g
Author  TradingKey
6 hours ago
TradingKey - Amid increasing global economic uncertainty, gold is experiencing its best year since 1979, recording its largest gain in 46 years.As of December 26, the price of gold futures (New York g
placeholder
Top 10 crypto predictions for 2026: Institutional demand and big banks could lift BitcoinCrypto’s 2026 outlook hinges on whether institutional demand returns—via ETFs, banks and digital-asset treasury buyers—with BTC facing a wide range between support near $80,600 and a potential $140,259 upside target, while stablecoins, AI tokens, Solana growth and regulation remain key themes.
Author  Mitrade
6 hours ago
Crypto’s 2026 outlook hinges on whether institutional demand returns—via ETFs, banks and digital-asset treasury buyers—with BTC facing a wide range between support near $80,600 and a potential $140,259 upside target, while stablecoins, AI tokens, Solana growth and regulation remain key themes.
placeholder
TradingKey 2025 Markets Recap & Outlook | Global Central Banks 2025 Recap and 2026 Outlook: Navigating Post-Easing Recovery and Diverging PathsIn 2025, major central banks globally generally maintained an accommodative stance, but the pace of policy adjustment slowed significantly. As inflation gradually came under control and e
Author  TradingKey
Yesterday 10: 31
In 2025, major central banks globally generally maintained an accommodative stance, but the pace of policy adjustment slowed significantly. As inflation gradually came under control and e
goTop
quote