Gold price edges lower for second day on bleak interest-rate outlook

Source Fxstreet
  • Gold price retreats for the second consecutive day on the back of elevated interest-rate expectations. 
  • Fed policymakers are expressing a reluctance to lower interest rates until more progress has been made on beating inflation. 
  • Their views are echoed in other parts of the globe further weighing on the Gold price which is sensitive to interest rates. 

Gold price (XAU/USD) trades lower by about a quarter of a percent in the $2,410s on Wednesday as a shift in the outlook for interest rates – both in the US and globally – weighs on the precious metal. 

Recent comments from US Federal Reserve (Fed) policymakers repeated the mantra that insufficient progress had been made in bringing inflation down to the Fed’s 2.0% target to warrant a lowering of interest rates. 

Their views weighed on the Gold price which, as a non-yielding asset, tends to perform poorly when interest rates are high due to the increased opportunity cost of holding Gold.

Gold price pulls back ahead of Fed Minutes  

Gold price might be further impacted when the Fed releases the Minutes of its latest policy meeting on Wednesday at 18:00 GMT. 

If the meeting minutes reflect a shift to a more hawkish stance amongst policymakers, Gold is expected to continue retreating. 

The recent Reserve Bank of Australia (RBA) meeting Minutes revealed that officials at the RBA had discussed the possibility of raising rates – a notable shift in stance from previous meetings. 

Technical Analysis: Gold price edges lower towards trendline support

Gold price (XAU/USD) edges down towards support from the green trendline, which reflects the short-term uptrend that began at the beginning of May.

The pair formed a Shooting Star Japanese candlestick pattern (shaded rectangle on the chart) on Monday, followed by a bearish close the following day, providing additional confirmation. The pattern is indicative of short-term weakness.  

XAU/USD Daily Chart


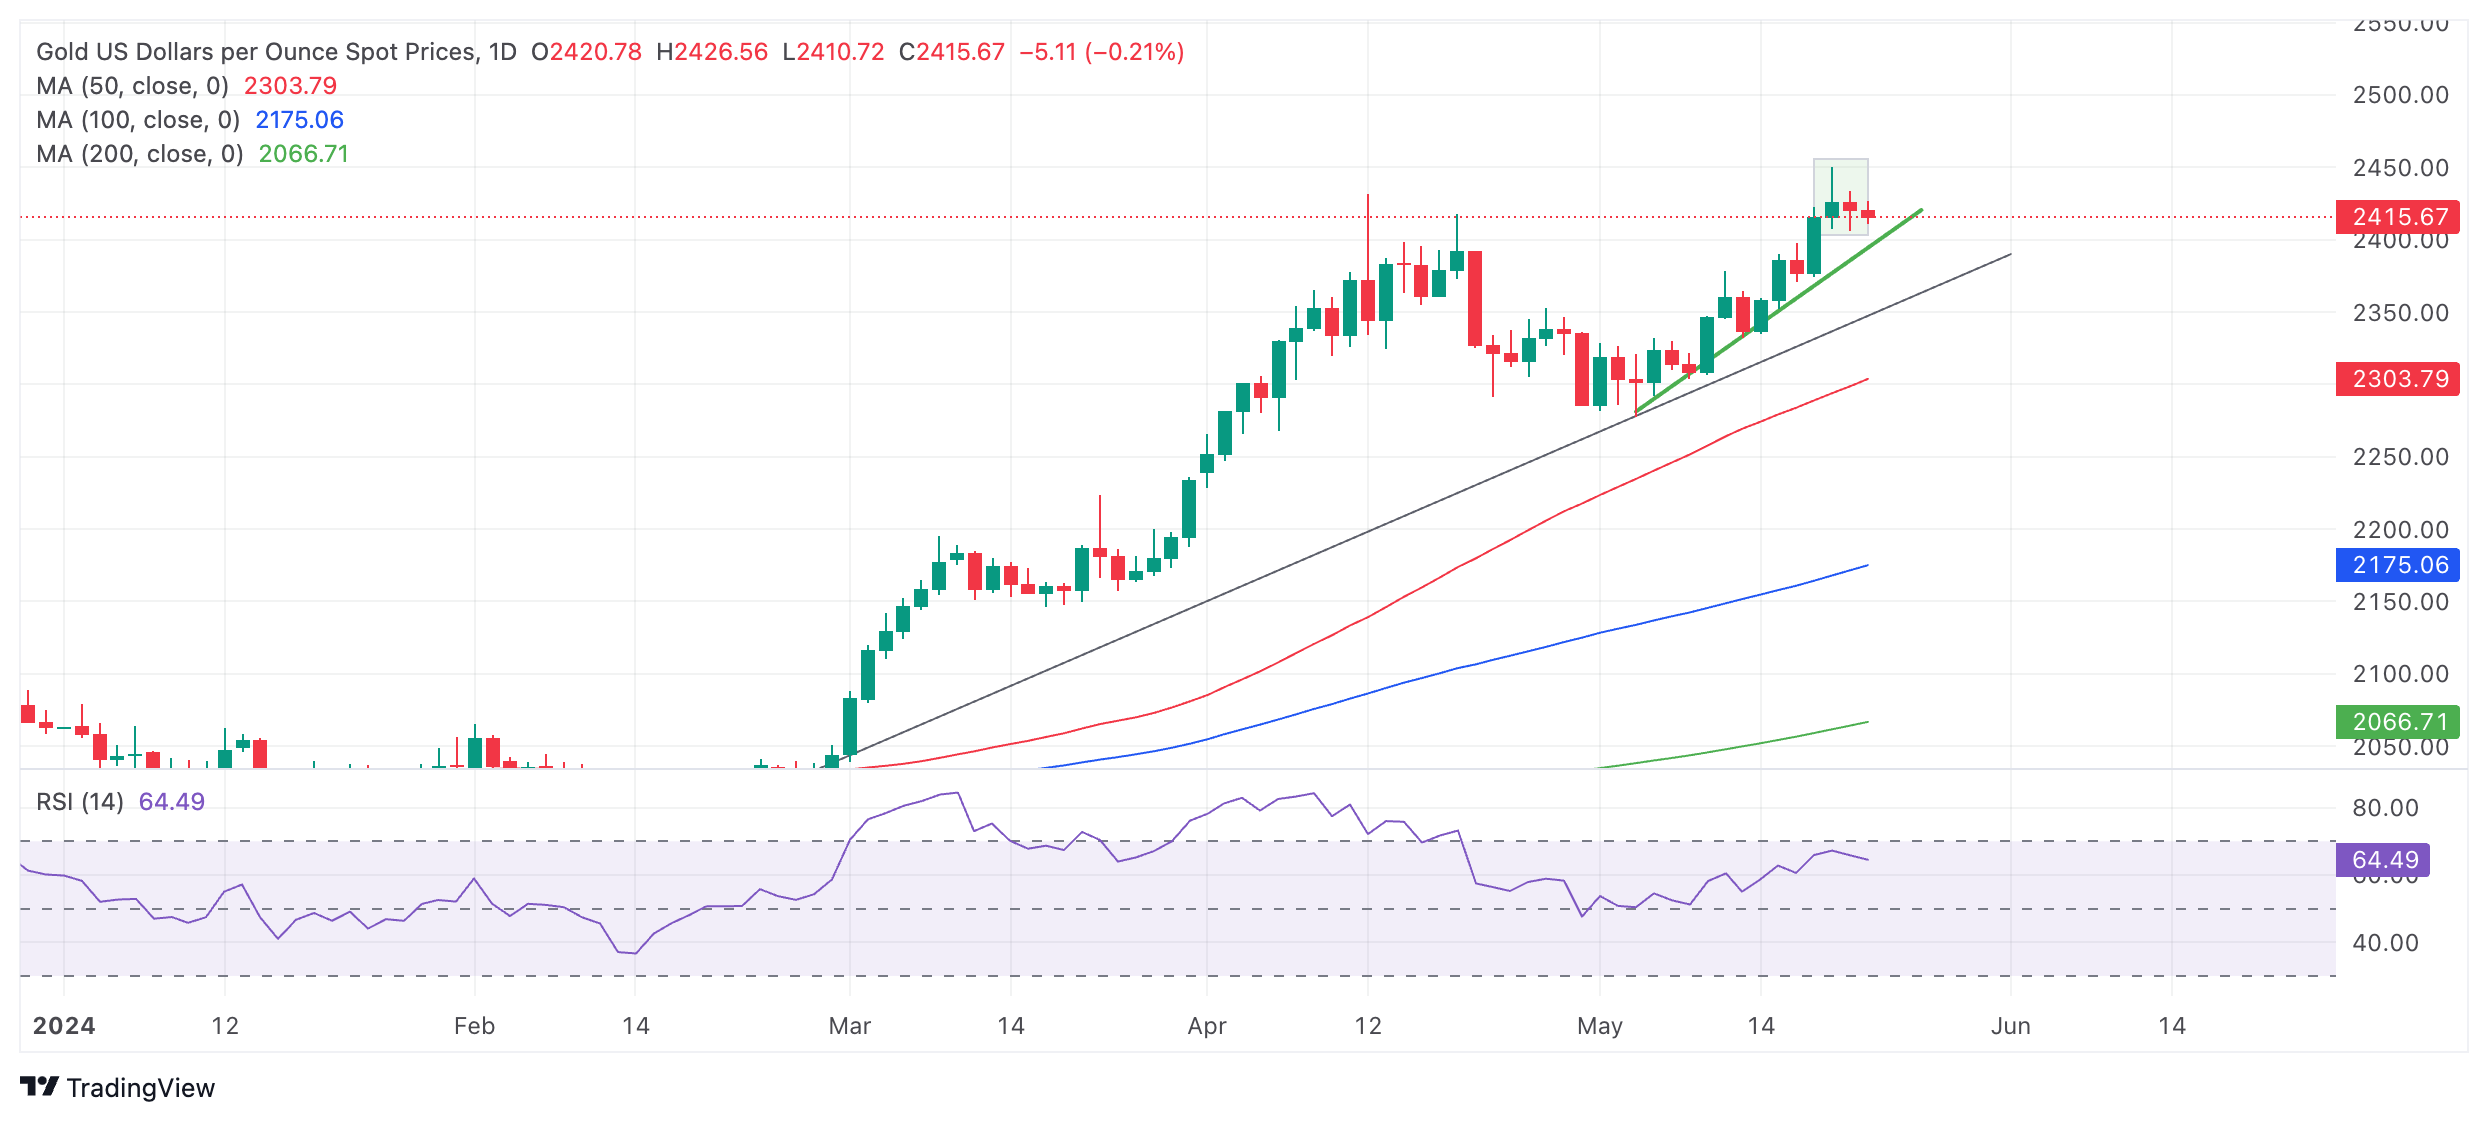
If the pullback continues, Gold will probably fall to initial support at the green trendline at about $2,405. Further weakness could take it down to the dark grey upward-sloping trendline in the $2,360s. 

However, the precious metal’s short, medium and long-term trends are bullish, and given the old adage that “the trend is your friend”, the odds favor an eventual recovery after the correction. 

A break above the new $2,450 all-time high would likely continue the rally to the next target at the psychologically significant $2,500 level. 

Economic Indicator

FOMC Minutes

FOMC stands for The Federal Open Market Committee that organizes 8 meetings in a year and reviews economic and financial conditions, determines the appropriate stance of monetary policy and assesses the risks to its long-run goals of price stability and sustainable economic growth. FOMC Minutes are released by the Board of Governors of the Federal Reserve and are a clear guide to the future US interest rate policy.

Read more.

Next release: Wed May 22, 2024 18:00

Frequency: Irregular

Consensus: -

Previous: -

Source: Federal Reserve

Minutes of the Federal Open Market Committee (FOMC) is usually published three weeks after the day of the policy decision. Investors look for clues regarding the policy outlook in this publication alongside the vote split. A bullish tone is likely to provide a boost to the greenback while a dovish stance is seen as USD-negative. It needs to be noted that the market reaction to FOMC Minutes could be delayed as news outlets don’t have access to the publication before the release, unlike the FOMC’s Policy Statement.


Disclaimer: For information purposes only. Past performance is not indicative of future results.
placeholder
2025 Black Friday is coming! Which stocks may see volatility?Coming on the day right after Thanksgiving in the United States, Back Friday marks the start of the holiday shopping season. Sales data from this shopping frenzy day reflects investor confidence and consumer trends. The National Retail Federation (NRF) predicts that holiday season (Nov and Dec) retail sales in 2025 will likely exceed $1 trillion for the very first time, which represents a year-over-year increase of 3.7 to 4.2 percent. Historic data from the past decade show that the retail sector has generally outperformed the S&P 500 during the weeks before and after Black Friday. The following retailing companies are expected to be big winners:
Author  Insights
Nov 24, Mon
Coming on the day right after Thanksgiving in the United States, Back Friday marks the start of the holiday shopping season. Sales data from this shopping frenzy day reflects investor confidence and consumer trends. The National Retail Federation (NRF) predicts that holiday season (Nov and Dec) retail sales in 2025 will likely exceed $1 trillion for the very first time, which represents a year-over-year increase of 3.7 to 4.2 percent. Historic data from the past decade show that the retail sector has generally outperformed the S&P 500 during the weeks before and after Black Friday. The following retailing companies are expected to be big winners:
placeholder
Bitcoin Bleeds to $86K, But This Key Indicator Screams "The Top Isn't In"Bitcoin’s adjusted Spent Output Profit Ratio (aSOPR) has spent nearly two years coiling below the extremes seen at past bull-market peaks, even as BTC trades around $86,300 and down 9% on the week — a setup that leaves open the possibility that this cycle’s true top may still lie ahead.
Author  Mitrade
Nov 25, Tue
Bitcoin’s adjusted Spent Output Profit Ratio (aSOPR) has spent nearly two years coiling below the extremes seen at past bull-market peaks, even as BTC trades around $86,300 and down 9% on the week — a setup that leaves open the possibility that this cycle’s true top may still lie ahead.
placeholder
Bitcoin Price Rebound Gains Traction with $90K Break in SightBitcoin is trading above $87,000 and its 100-hour SMA after rebounding from $83,500, with a bearish trend line at $88,200 and resistance at $89,000–$90,000 now in focus as BTC either breaks higher toward $91,750–$94,000 or slips back toward $86,700, $85,000 and lower supports.
Author  Mitrade
Yesterday 02: 58
Bitcoin is trading above $87,000 and its 100-hour SMA after rebounding from $83,500, with a bearish trend line at $88,200 and resistance at $89,000–$90,000 now in focus as BTC either breaks higher toward $91,750–$94,000 or slips back toward $86,700, $85,000 and lower supports.
placeholder
Bitcoin Targets $89K Breakout as S&P 500 Nears ATH on Fed Rate Cut HopesBitcoin price action shows signs of a potential short squeeze as it hovers near $88,000, with analysts watching liquidity dynamics that could push it toward $89,000 or retrace to $85,000.
Author  Mitrade
3 hours ago
Bitcoin price action shows signs of a potential short squeeze as it hovers near $88,000, with analysts watching liquidity dynamics that could push it toward $89,000 or retrace to $85,000.
placeholder
Ethereum Reclaims $3K Handle—Is a Breakout Imminent?Ethereum has jumped back above $3,000 and reclaimed key Fib levels, with a bullish trend line at $2,880 and strong MACD/RSI readings putting a breakout above $3,120–$3,165 — and a possible run toward $3,320–$3,350 — on the table, as long as support around $2,980–$2,920 holds.
Author  Mitrade
3 hours ago
Ethereum has jumped back above $3,000 and reclaimed key Fib levels, with a bullish trend line at $2,880 and strong MACD/RSI readings putting a breakout above $3,120–$3,165 — and a possible run toward $3,320–$3,350 — on the table, as long as support around $2,980–$2,920 holds.
goTop
quote