

Crude Oil roils on Monday, WTI finds then loses $80
- WTI briefly rose to $80.00 per barrel before falling back.
- US Crude Oil found its highest bids since the start of the month.
- Risk appetite struggles to push broad asset categories firmly higher.
West Texas Intermediate (WTI) US Crude Oil rose briefly above $80.00 per barrel on Monday as risk appetite remains close to the surface, but topside momentum remains thin. WTI fell back into range near $78.80 as appearances from Federal Reserve (Fed) officials crimp risk appetite, limiting buying pressure to kick off the new trading week.
Read more: Fed officials lean into cautious stance as inflation concerns weigh on central planners
Upside pressure is cooking in the background of global Crude Oil markets after a helicopter carrying Iranian President Ebrahim Raisi and Iranian Foreign Minister Hossein Amir-Abdollahian crashed over the weekend. As Iran prepares to rush to the polls to elect a new president, energy investors will be keeping one eye on developments. A federal election in Iran is expected within the next 50 days.
A broadly-expected increase in Crude Oil markets from refineries has failed to materialize, meaning supply chains are at risk of getting overrun by production that continues to outpace overall demand. A lopsided number of refineries went offline for spring maintenance in 2024, and energy traders had been banking on an uptick in Crude Oil demand after those facilities came back online. Price-pressured and cost-hobbled consumers have been cutting back spending on liquid fuels, leaving production chains fuller than investors had anticipated.
Barrel counts from the American Petroleum Institute (API) and Energy Information Administration (EIA) eased more than expected last week, helping to bolster barrel bids in the short-term. Crude Oil traders will be keeping an eye out for this week’s Crude Oil stocks updates to gauge just how far a supply overhang could be looming.
WTI technical outlook
US Crude Oil is hobbled by technical consolidation between $80.00 and $79.00 as energy traders get hung up on a support/resistance band around $79.50. Price have recovered from multi-month lows near $76.40, but topside momentum remains limited.
WTI hourly chart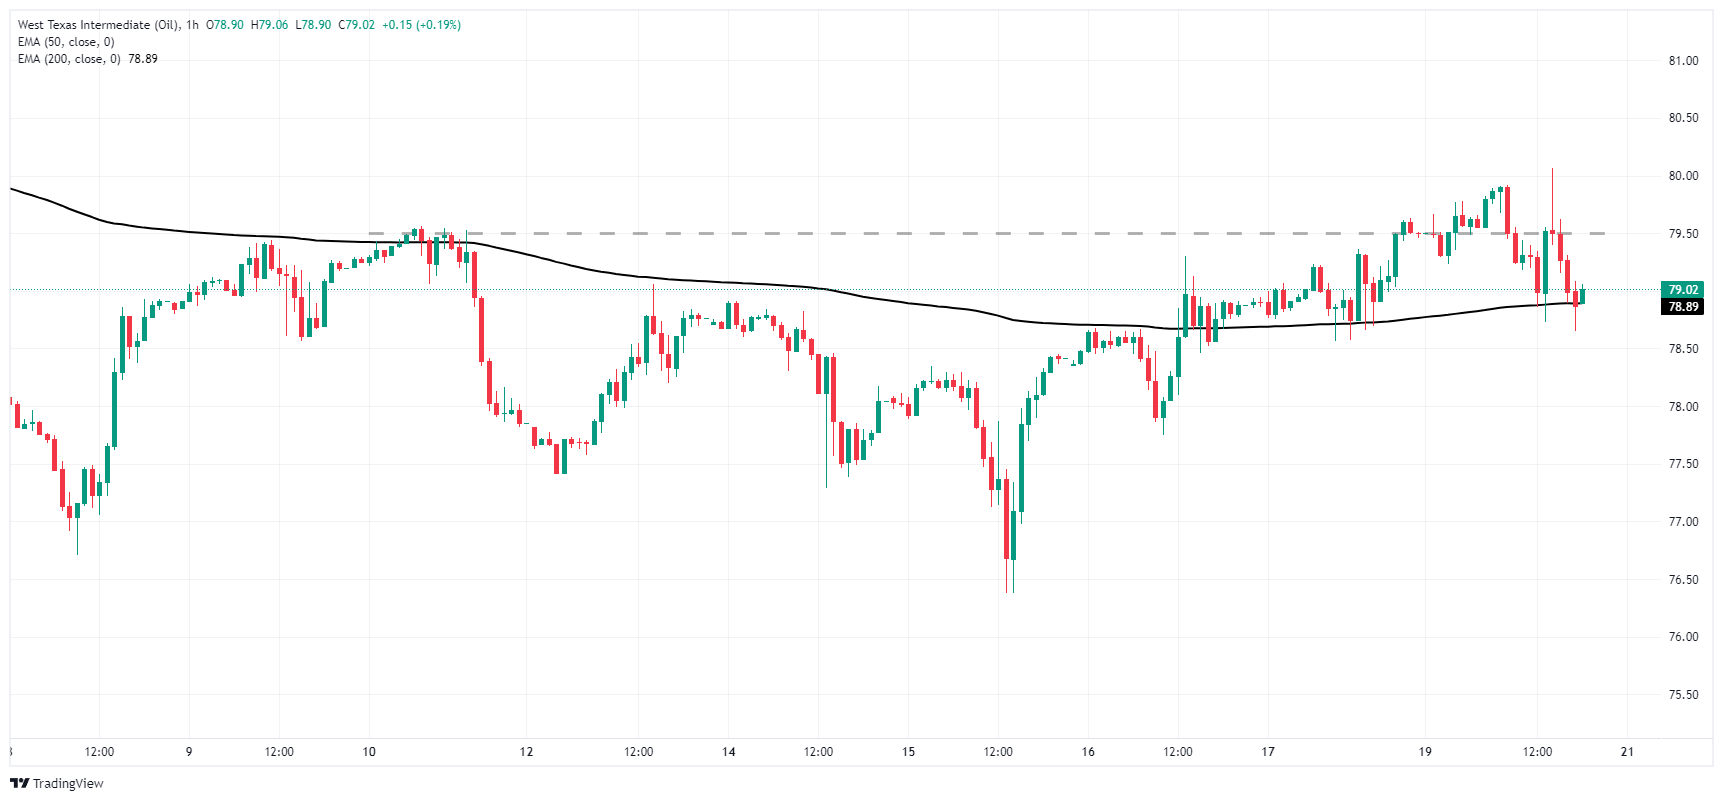
WTI daily chart

Recommended Articles


