Natural Gas Price Analysis: Correction unfolding within an uptrend

Source Fxstreet
  • Natural Gas is correcting within a short-term uptrend. 
  • The RSI is giving a sell-signal further increasing the chances of a pullback evolving.
  • The trend is expected to continue after the correction has finished. 

Natural Gas price is in a short-term uptrend evidenced by the rising sequence of peaks and troughs on the 4-hour chart, and the fact it is trading above all its key Moving Averages. 

Given the old adage that “the trend is your friend,” the commodity is likely to continue rallying over the short-term horizon (up to 6 weeks) unless and until the evidence suggests otherwise. 

Natural Gas 4-hour Chart 

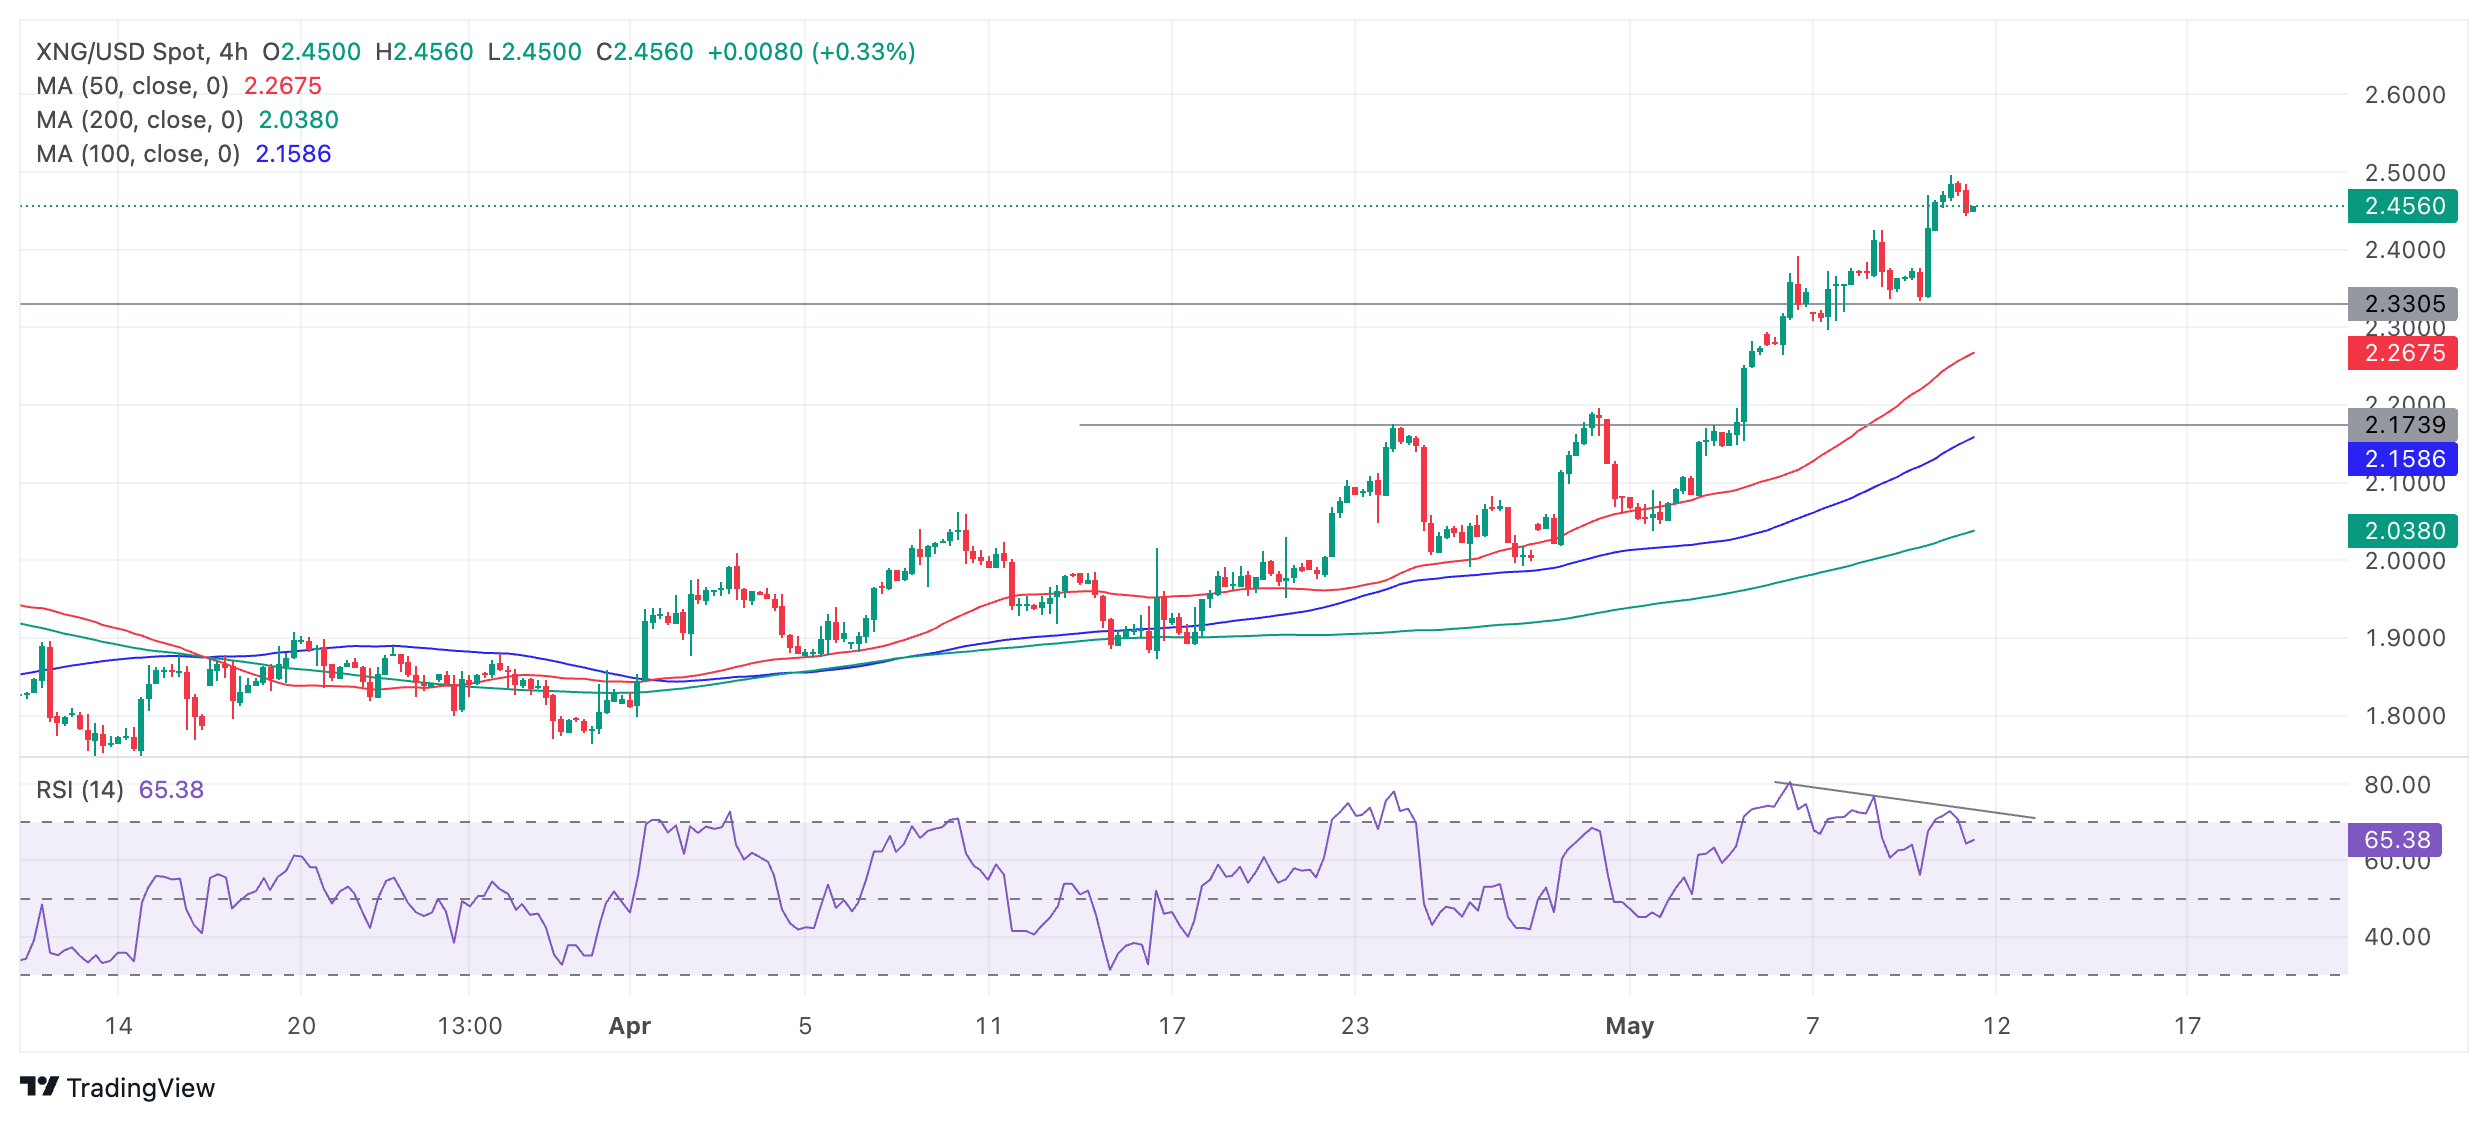
The Relative Strength Index (RSI) momentum indicator has been fluctuating at overbought extremes since May 3 and consistently showing bearish divergence with price. This occurs when price reaches new highs but the RSI fails to follow suit. It is a sign of underlying weakness.

The RSI has just moved out of overbought and re-entered neutral territory during the last bar, giving a sell signal. Taken together with the pullback in price it suggests the possibility of a deeper correction unfolding.

The zone of support between $2.42 and $2.32 MMBtu is likely to underpin any declines, however, and provide a springboard to a resumption of the uptrend eventually. 

After the correction Natural Gas will probably continue to new highs in line with the dominant uptrend. A break above the $2.50 MMBtu level would indicate a continuation higher, potentially to an initial target at roughly $2.60 MMBtu. 

If Natural Gas price breaks below $2.32 MMBtu it will bring the uptrend into doubt and suggest the possibility that a reversal has occurred and a new downtrend is beginning. In such a scenario, short positions as opposed to long positions would be favored.


Disclaimer: For information purposes only. Past performance is not indicative of future results.
placeholder
Gold Price Forecast: XAU/USD declines below $4,050 on USD strength and hawkish Fed comments Gold price (XAU/USD) extends the decline to around $4,030 during the early Asian session on Tuesday. The precious metal edges lower as traders dialed back expectations of a US interest rate cut next month.
Author  FXStreet
Nov 18, Tue
Gold price (XAU/USD) extends the decline to around $4,030 during the early Asian session on Tuesday. The precious metal edges lower as traders dialed back expectations of a US interest rate cut next month.
placeholder
Top 3 Price Prediction: Bitcoin, Ethereum, Ripple – BTC, ETH and XRP Look for a Foothold After a Sharp ShakeoutBitcoin trades near $92,600 after a dip below $90,000, while Ethereum around $3,118 and XRP near $2.21–$2.23 sit on key support zones, as BTC, ETH and XRP all try to turn a sharp correction into a tradable rebound rather than a deeper slide.
Author  Mitrade
Nov 19, Wed
Bitcoin trades near $92,600 after a dip below $90,000, while Ethereum around $3,118 and XRP near $2.21–$2.23 sit on key support zones, as BTC, ETH and XRP all try to turn a sharp correction into a tradable rebound rather than a deeper slide.
placeholder
Could XRP Really Catch Ethereum? Analysts Revisit the Question as ETF Tailwinds BuildAs US spot XRP ETFs roll out and issuers like Canary Capital and Franklin Templeton step in, analysts say XRP’s market cap could climb on growing utility and ETF accumulation—but overtaking Ethereum’s $373 billion smart-contract powerhouse remains a long-shot, at least for now.
Author  Mitrade
Nov 20, Thu
As US spot XRP ETFs roll out and issuers like Canary Capital and Franklin Templeton step in, analysts say XRP’s market cap could climb on growing utility and ETF accumulation—but overtaking Ethereum’s $373 billion smart-contract powerhouse remains a long-shot, at least for now.
placeholder
Bitcoin's Drop to $86K Approaches 'Max Pain' Zone, Yet Presents Potential Buying OpportunityAnalysts identify the $84,000 to $73,000 range as Bitcoin's likely "max pain" territory where capitulation may occur.
Author  Mitrade
20 hours ago
Analysts identify the $84,000 to $73,000 range as Bitcoin's likely "max pain" territory where capitulation may occur.
placeholder
Market Meltdown: BTC, ETH, and XRP Capitulate as Bears Seize ControlBitcoin trades around $85,900 after breaking below $86,000, with Ethereum under $2,791 and XRP below $1.99 as BTC, ETH and XRP extend weekly losses of 8–10%, forcing traders to focus on supports at $85,000, $2,749 and $1.77 for clues on whether this sell-off has further to run.
Author  Mitrade
19 hours ago
Bitcoin trades around $85,900 after breaking below $86,000, with Ethereum under $2,791 and XRP below $1.99 as BTC, ETH and XRP extend weekly losses of 8–10%, forcing traders to focus on supports at $85,000, $2,749 and $1.77 for clues on whether this sell-off has further to run.
goTop
quote