


WTI explores downside but remains close to $83 as Crude Oil markets froth
- Crude Oil eases back from risk-on bump, but US inventory declines limit losses.
- WTI remains hampered by $83.00 per barrel technical level.
- API, EIA both report inventory declines.
West Texas Intermediate (WTI) US Crude Oil slipped back slightly on Wednesday, stumbling away from $83.50 per barrel to trade down to $82.50 as broad-market risk appetite from Tuesday evaporates in the mid-week market session. Despite easing buying pressure in barrel markets, Crude Oil declines remain limited after US barrel counts declined on a week-on-week basis.
The Energy Information Administration (EIA) reported a -6.368M barrel decline in US barrel counts for the week ended April 19, missing the forecast uptick of 1.6M and erasing the previous week’s 2.735M buildup. The EIA’s reported decline in Crude Oil stocks adds to the reported inventory decline from the American Petroleum Institute (API) late Tuesday, which showed a -3.23M barrel drawdown for the same period, also missing a forecast 1.8M buildup and eating away at most of the previous week’s increase of 4.09M barrels.
Declining US barrel stocks are helping to balance out broad-market risk aversion flows as commodities take a hit on Wednesday. Volatility is on the rise and investors are turning to Thursday’s upcoming US Gross Domestic Product (GDP) print. Markets desperate for any signs of a US Federal Reserve (Fed) rate cut over the horizon are hoping that the US’ quarterly GDP results for Q1 will ease back to at least 2.5% compared to the previous print of 3.4%.
This week will wrap up with another print of the US Personal Consumption Expenditure (PCE) Price Index inflation metric. Core US PCE MoM in March is expected to hold steady at 0.3%, and rate-cut-hungry market participants are looking for further signs of inflation weakness. At current cut, the Fed is expected to deliver a first rate cut in September, well later than the March rate cut that was expected back in December.
WTI technical outlook
WTI continues to get hung up on the 200-hour Exponential Moving Average (EMA) near $83.00, hampering topside momentum in the near-term as barrel bids continue to look for bullish bounces from the $81.00 region. Intraday barrel bidding remains significantly down from recent highs near $87.00, but further downside momentum will need to break below $80.00 before pushing lower.
Daily candles remain on the high side of the 200-day EMA at $79.11, and despite recent bearish pulldown, Crude Oil remains well up from 2024’s early lows near $70.00 per barrel.
WTI hourly chart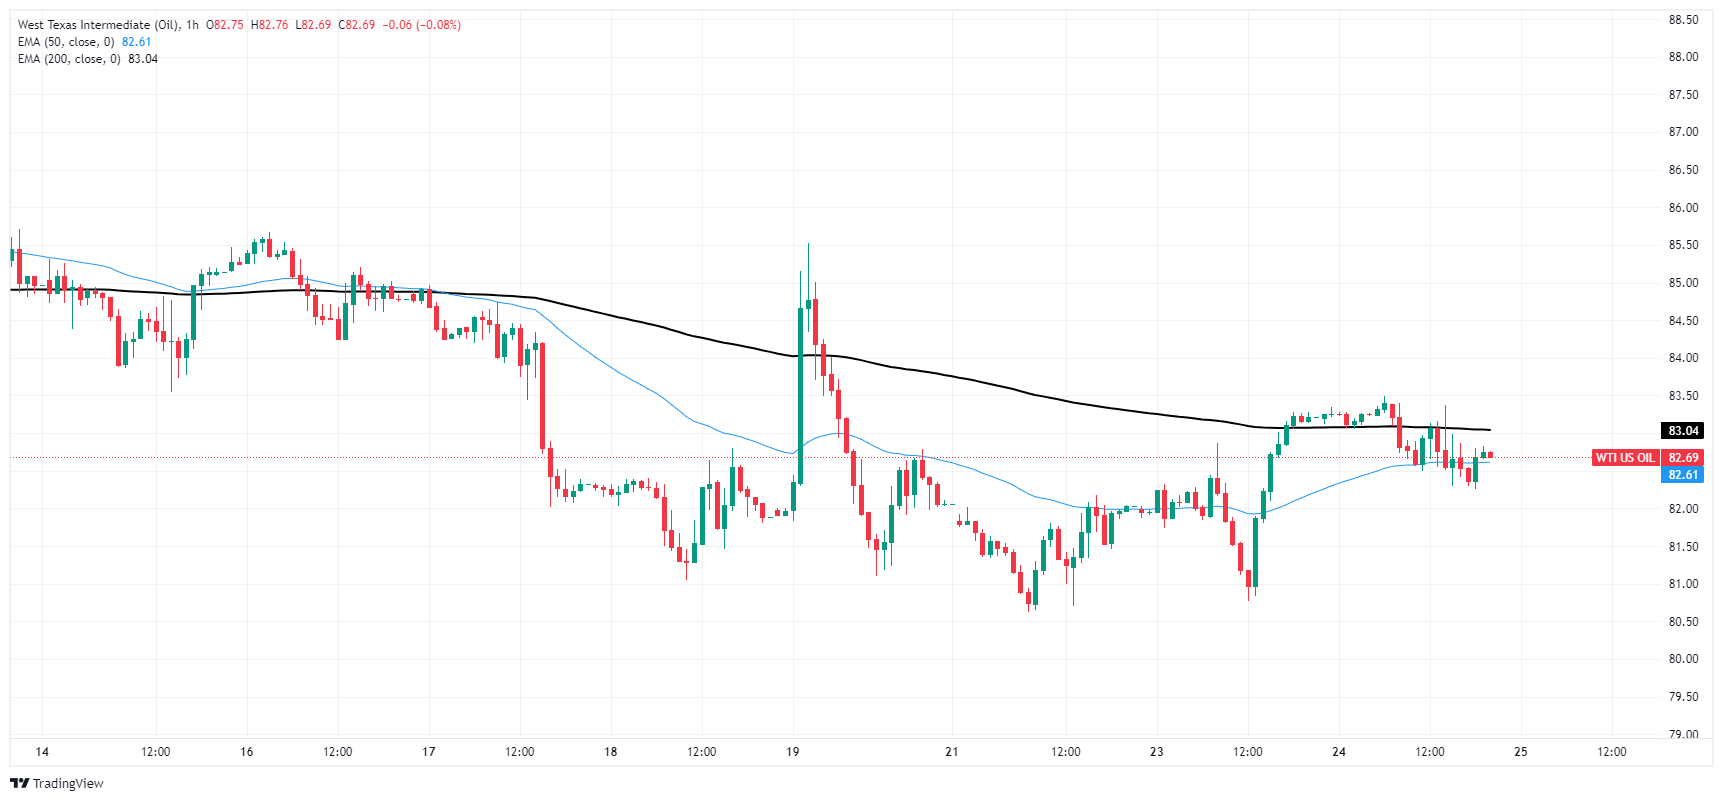
WTI daily chart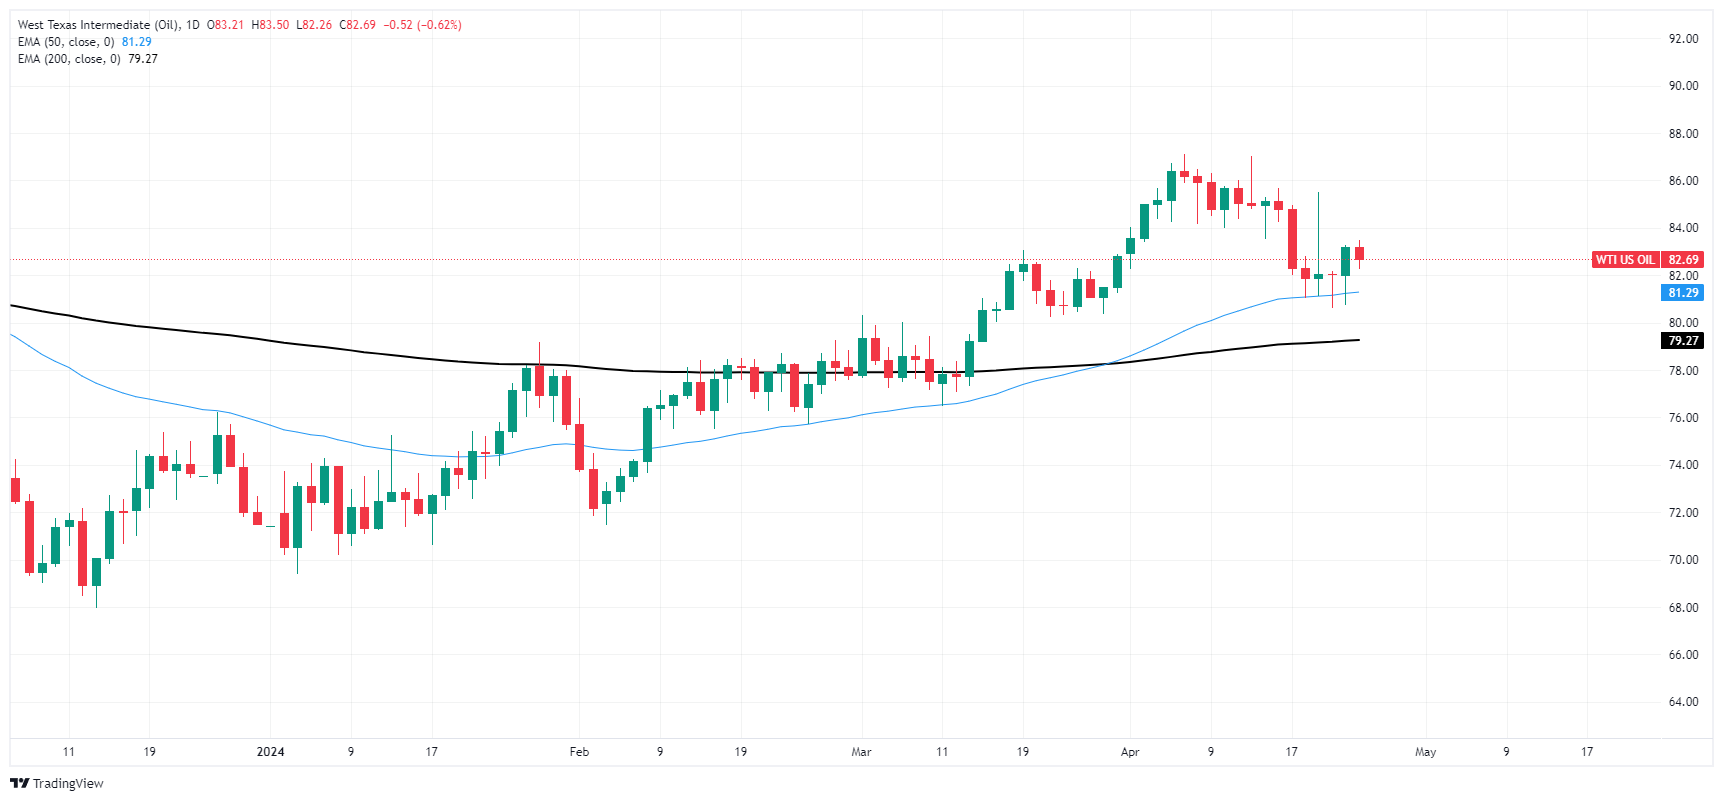
Recommended Articles


