Silver Price Analysis: Trading at the top of a four-year consolidation zone

Source Fxstreet
  • Silver price has risen up and touched the top of a huge four-year consolidation at just shy of $30.00. 
  • XAG/USD has since pulled back and the RSI is flashing overbought on the weekly chart. 
  • There is a risk of a deeper correction, although a clear break above the consolidation would confirm more upside. 

Silver (XAG/USD) has broken out of the narrow range it was trapped in since the start of 2023, which ran from between roughly $21.00 and $26.00, and risen up to the top of a larger consolidation.  

The precious metal has rallied rapidly over the last two weeks and reached the next key resistance level at the 2020 highs of $29.86. This is also the ceiling of a massive consolidation zone Silver price has been trading up and down in since 2020. 

Since touching the top of the zone earlier this week XAG/USD has pulled back down to the $28.60s over the last few days. 

Silver Weekly Chart

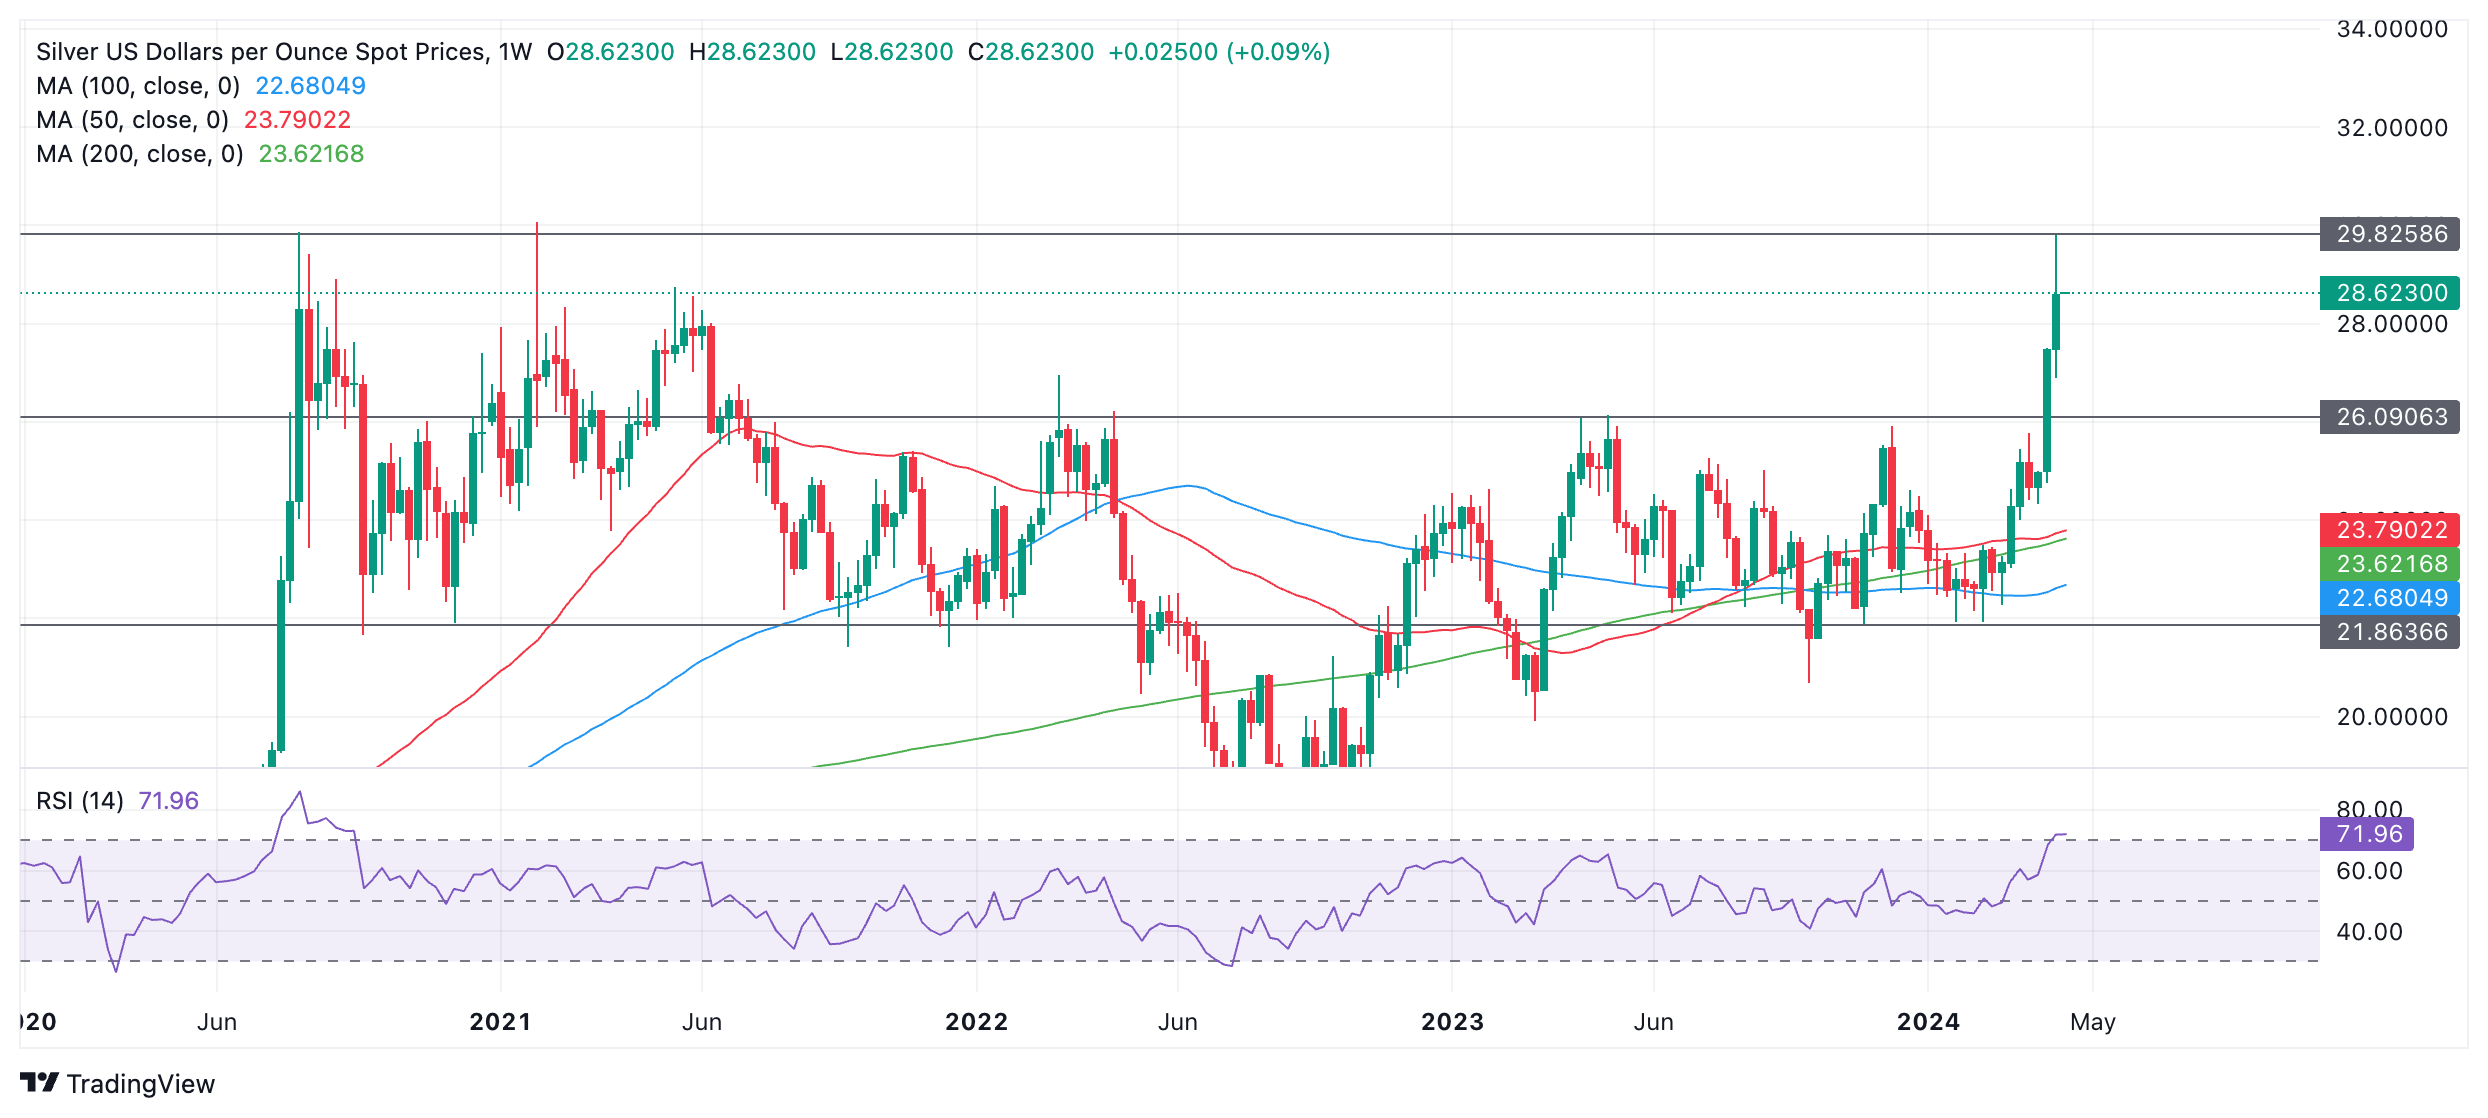
The Relative Strength Index (RSI) momentum indicator has entered overbought territory at 71.96, which indicates Silver may be peaking. There is an increased risk of a pullback evolving and long holders are advised not to add to their positions. 

It is rare for the RSI to reach overbought on the weekly chart. The last time this occurred was at the August 2020 highs over three and a half years ago. A considerable pullback then followed, which took Silver price back down to $21.00 – an over 30% decline. 

It is too early to say the same will happen this time, but there is clearly a risk of a deep correction. 

The short and intermediate-term trends are bullish, however, so there is also a possibility of a continuation higher. 

A decisive break above the 2021 high of $30.07 would provide confirmation of a continuation higher and a breakout of the whole four-year consolidation Silver has been trading in. Such a move might be expected to reach $32.40 initially, where former resistance lies. 

If a correction evolves, however, the exchange rate would be expected to fall to support from the former range highs at $26.00 initially, however, given the shorter time frame trends are bullish a recovery thereafter could very well also unfold. 


Disclaimer: For information purposes only. Past performance is not indicative of future results.
placeholder
The 2026 Fed Consensus Debate: Not Hassett, It’s About Whether Powell Stays or GoesKevin Hassett, White House National Economic Council Director, is poised to succeed Jerome Powell as the next Federal Reserve Chair. This development signals a potentially more dovish mon
Author  TradingKey
9 hours ago
Kevin Hassett, White House National Economic Council Director, is poised to succeed Jerome Powell as the next Federal Reserve Chair. This development signals a potentially more dovish mon
placeholder
Avalanche Bulls Eye Trend Reversal, Though Muted Derivatives Signal CautionAvalanche (AVAX) consolidates above $14.00 after an 8% breakout, but with open interest below $600 million and key resistance at $17.14 looming, traders remain cautious.
Author  Mitrade
11 hours ago
Avalanche (AVAX) consolidates above $14.00 after an 8% breakout, but with open interest below $600 million and key resistance at $17.14 looming, traders remain cautious.
placeholder
Bitcoin Bollinger Bands indicate another 'parabolic' bull signal like late 2023Historical patterns indicate that low BandWidth levels often precede significant BTC price increases.
Author  Mitrade
12 hours ago
Historical patterns indicate that low BandWidth levels often precede significant BTC price increases.
placeholder
AUD/USD sticks to gains above 0.6600, highest since late October after Aussie trade dataThe AUD/USD pair prolongs its strong uptrend witnessed over the past two weeks or so and advances to a fresh high since late October during the Asian session on Thursday.
Author  FXStreet
17 hours ago
The AUD/USD pair prolongs its strong uptrend witnessed over the past two weeks or so and advances to a fresh high since late October during the Asian session on Thursday.
placeholder
Solana Price Forecast: ETF Demand and Derivatives Flows Fuel a Sharper ReboundSolana (SOL) trades above $140 after a 10% daily jump, as ETF inflows flip positive, futures open interest climbs 6.75% and on-chain TVL and stablecoin liquidity rise, setting up a potential double-bottom breakout toward the 50-day EMA at $158 if SOL can secure a daily close above $145.
Author  Mitrade
Yesterday 06: 36
Solana (SOL) trades above $140 after a 10% daily jump, as ETF inflows flip positive, futures open interest climbs 6.75% and on-chain TVL and stablecoin liquidity rise, setting up a potential double-bottom breakout toward the 50-day EMA at $158 if SOL can secure a daily close above $145.
goTop
quote