Silver Price Forecast: XAG/USD plummets to $28.40 as uncertainty over Fed rate cut timing deepens

Source Fxstreet
  • Silver price plunges to $28.40 as the US Dollar capitalizes on uncertainty over Fed rate cut timing.
  • US bond yields rise further as the Fed is expected to consider rate cuts later this year.
  • Geopolitical tensions keep safe-haven demand intact.

Silver price (XAG/USD) slumps to $28.40 in Tuesday’s European session. The white metal faces intense selling pressure as the US Dollar extends its upside to more than five-month high around 106.40. The US Dollar strengthens after robust United States Retail Sales data for March deepened uncertainty about when the Federal Reserve (Fed) will start reducing interest rates.

S&P 500 futures have posted some losses in the European session, portraying a decline in the risk appetite of the market participants. 10-year US Treasury yields hover near a fresh five-month high around 4.63%. US bond yields extend their upside on expectations that the Fed will delay rate cuts later this year. The US Dollar Index (DXY) rises to 106.33 and continues its winning streak for the fifth trading session on Tuesday.

Fed policymakers see no urgency for a reduction in interest rates. San Francisco Fed Bank President Mary Daly emphasized keeping the monetary policy restrictive until policymakers get convinced that inflation is on course towards the 2% target.

The near-term outlook of Silver remains strong amid fears that tensions in the Middle East region could spread beyond Gaza. After a cabinet meeting on Monday with Israel Prime Minister Benjamin Netanyahu, Israel’s military Chief of Staff Herzi Halev said they would respond to Iran’s attack on their territory. On Saturday, Iran launched hundreds of drones and missiles to retaliate against Israel’s attack on the Iranian embassy in Syria near Damascus, in which two high-ranked generals died.

Silver technical analysis

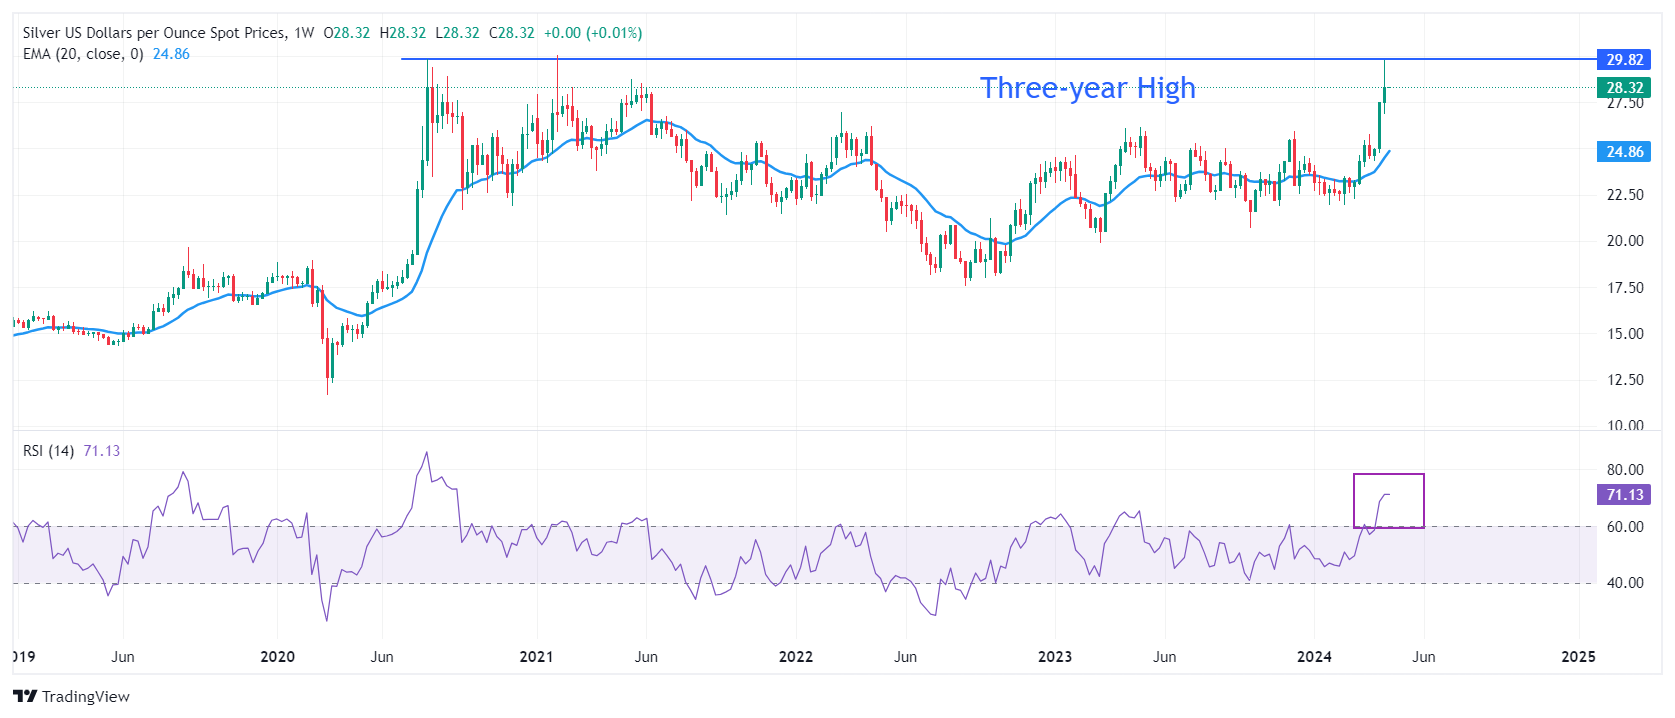
Silver price faces selling pressure while attempting to break above horizontal resistance plotted from 3 August 2020 high at $29.86. The long-term outlook of the white metal is bullish as the 20-week Exponential Moving Average (EMA) at $24.85 is sloping higher.

The 14-period Relative Strength Index (RSI) shifts into the bullish range of 60.00-80.00, suggesting a strong upside momentum.

Silver weekly chart

XAG/USD

Overview
Today last price 28.28
Today Daily Change -0.59
Today Daily Change % -2.04
Today daily open 28.87
 
Trends
Daily SMA20 26.28
Daily SMA50 24.46
Daily SMA100 24
Daily SMA200 23.63
 
Levels
Previous Daily High 28.89
Previous Daily Low 27.62
Previous Weekly High 29.8
Previous Weekly Low 26.88
Previous Monthly High 25.77
Previous Monthly Low 22.51
Daily Fibonacci 38.2% 28.41
Daily Fibonacci 61.8% 28.11
Daily Pivot Point S1 28.03
Daily Pivot Point S2 27.19
Daily Pivot Point S3 26.77
Daily Pivot Point R1 29.3
Daily Pivot Point R2 29.73
Daily Pivot Point R3 30.57


Disclaimer: For information purposes only. Past performance is not indicative of future results.
placeholder
Nearly $2 Billion Wiped Out in Crypto Liquidations Amid Brutal Sell-OffThe crypto market experienced nearly $2 billion in liquidations over the past 24 hours, as the total market capitalization dropped below $3 trillion for the first time in five months.Bitcoin (BTC) alo
Author  Beincrypto
Yesterday 10: 24
The crypto market experienced nearly $2 billion in liquidations over the past 24 hours, as the total market capitalization dropped below $3 trillion for the first time in five months.Bitcoin (BTC) alo
placeholder
Market Meltdown: BTC, ETH, and XRP Capitulate as Bears Seize ControlBitcoin trades around $85,900 after breaking below $86,000, with Ethereum under $2,791 and XRP below $1.99 as BTC, ETH and XRP extend weekly losses of 8–10%, forcing traders to focus on supports at $85,000, $2,749 and $1.77 for clues on whether this sell-off has further to run.
Author  Mitrade
Yesterday 04: 15
Bitcoin trades around $85,900 after breaking below $86,000, with Ethereum under $2,791 and XRP below $1.99 as BTC, ETH and XRP extend weekly losses of 8–10%, forcing traders to focus on supports at $85,000, $2,749 and $1.77 for clues on whether this sell-off has further to run.
placeholder
Bitcoin's Drop to $86K Approaches 'Max Pain' Zone, Yet Presents Potential Buying OpportunityAnalysts identify the $84,000 to $73,000 range as Bitcoin's likely "max pain" territory where capitulation may occur.
Author  Mitrade
Yesterday 03: 35
Analysts identify the $84,000 to $73,000 range as Bitcoin's likely "max pain" territory where capitulation may occur.
placeholder
Whale Dump Meets Quantum Panic: Bitcoin Slips to $86,000 and Blows $220 Million LongsBitcoin fell below $87,000 on November 20, 2025, amid a storm of quantum security fears and $1.3 billion whale capitulation. In the process, it blew almost $220 million in long positions out of the wa
Author  Beincrypto
Yesterday 03: 11
Bitcoin fell below $87,000 on November 20, 2025, amid a storm of quantum security fears and $1.3 billion whale capitulation. In the process, it blew almost $220 million in long positions out of the wa
placeholder
EUR/USD dives further as traders pare back Fed cuts betsEUR/USD extends losses for the fifth consecutive day and trades at 1.1520 at the time of writing on Thursday after a sharp reversal from levels near 1.1600 on Wednesday.
Author  FXStreet
Nov 20, Thu
EUR/USD extends losses for the fifth consecutive day and trades at 1.1520 at the time of writing on Thursday after a sharp reversal from levels near 1.1600 on Wednesday.
goTop
quote