
Gold Price Forecast: XAU/USD consolidates gains above $3,615
- Gold maintains its bullish trend intact, with bears contained above $3,615 so far.
- The US Dollar extends losses as markets brace for Fed monetary easing.
- XAU/USD maintains the $3,675 all-time high at a short distance.
Gold failed to find acceptance above the $3,660 area and is trading lower on Thursday, returning to $3,620, as the US Dollar appreciates for the third consecutive day, with all eyes on the US Consumer Prices Index release.
XAU/USD islands tall at a short distance of the all-time high, at $3,675 on Monday. A weaker US Dollar, weighed by market expectations that the Fed will cut rates later this week, keeps precious metals buoyed, with deonside attemots contained above $3,615.
The US Dollar Index, which measures the US Dollar value against a basket of currencies, is trading 0.2% lower today, drifting closer to two-month lows. Investors are positioning for a 25 bps rate cut on Wednesday and also for a dovish turn on the interest rate projections, the so-called “dot plot” and on the bank’s forward guidance.
XAU/USD downside attempts find buyers
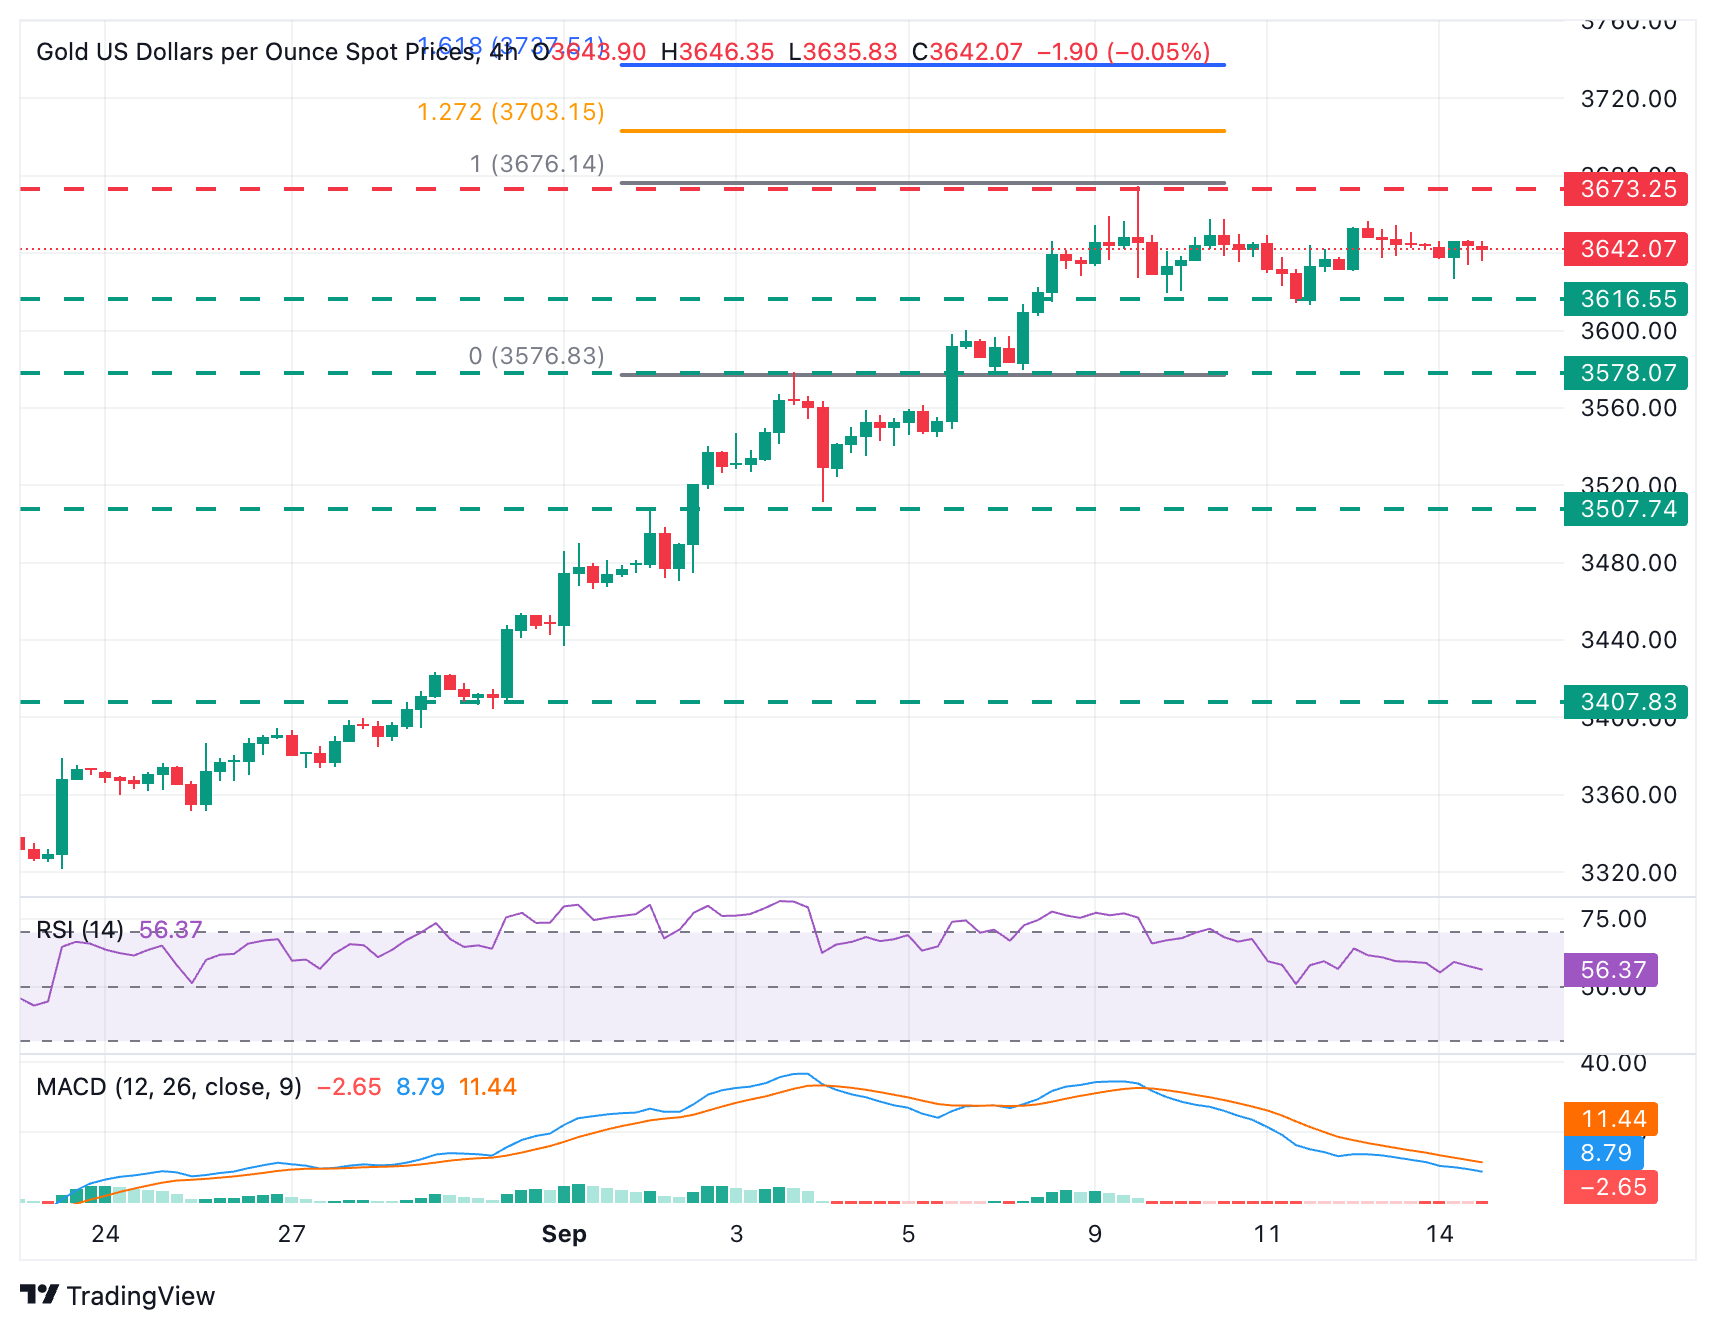
Gold’s consolidation pattern seen over the last few days has contributed to pulling the 4-hour Relative Strength Index down from the oversold levels seen last week, but it is still above the key 50 level. The MACD in the same timeframe is bearish yet with downside momentum fading.
Downside attempts have been contained above $3,615 so far. Further down, the $3,580 support (September 3 high, September 8 low) might provide some support ahead of the September 4 low, at $3,510.
To the upside, immediate resistance is the September 9 high, at $3,675. Beyond this, the psychological $3,700 level emerges as the next target, and then probably the 161.8% extension of last week’s rally, near $3,740.
US Dollar Price Today
The table below shows the percentage change of US Dollar (USD) against listed major currencies today. US Dollar was the strongest against the Canadian Dollar.
| USD | EUR | GBP | JPY | CAD | AUD | NZD | CHF | |
|---|---|---|---|---|---|---|---|---|
| USD | -0.17% | -0.37% | -0.21% | -0.09% | -0.22% | -0.09% | -0.19% | |
| EUR | 0.17% | -0.17% | -0.09% | 0.09% | 0.00% | 0.04% | -0.02% | |
| GBP | 0.37% | 0.17% | 0.16% | 0.27% | 0.17% | 0.21% | 0.04% | |
| JPY | 0.21% | 0.09% | -0.16% | 0.09% | 0.03% | 0.10% | 0.02% | |
| CAD | 0.09% | -0.09% | -0.27% | -0.09% | -0.03% | -0.05% | -0.22% | |
| AUD | 0.22% | -0.00% | -0.17% | -0.03% | 0.03% | 0.04% | -0.05% | |
| NZD | 0.09% | -0.04% | -0.21% | -0.10% | 0.05% | -0.04% | -0.17% | |
| CHF | 0.19% | 0.02% | -0.04% | -0.02% | 0.22% | 0.05% | 0.17% |
The heat map shows percentage changes of major currencies against each other. The base currency is picked from the left column, while the quote currency is picked from the top row. For example, if you pick the US Dollar from the left column and move along the horizontal line to the Japanese Yen, the percentage change displayed in the box will represent USD (base)/JPY (quote).
Recommended Articles


