

Gold gleam diminishes on US Dollar strength and high US Treasury yields
- Gold prices retrace, experience pullback from recent highs as US Dollar strengthens.
- Risk-off sentiment, lower Gold demand follows Fed announcement on monetary policy.
- Fed cautious on economy, eyes on inflation, labor market.
- US 10-year Treasury yields, Dollar Index rise, both headwinds for Gold prices.
Gold prices (XAU/USD) fell from all-time highs of $2,223 and broke below the $2,200 figure on Thursday, clocking losses of 0.29% as the Greenback stages a comeback while US Treasury yields paired yesterday’s losses. A risk-off impulse and the lack of demand for the yellow metal above the $2,200 mark sponsored XAU/USD’s leg down toward the $2,179 mark.
Financial markets continued to digest the Federal Reserve’s (Fed) dovish hold following its March 21 meeting. Fed Chairman Jerome Powell and his colleagues acknowledged that the economy is robust, the labor market is gradually cooling, and inflation remains high despite decreasing from higher levels last seen in the 1980s.
Fed officials reiterated that they expect three rate cuts in 2024, though policy would stay put unless data suggests the disinflation process is evolving. In the meantime, the US 10-year Treasury yield benchmark note has pared its losses, while the US Dollar Index (DXY) posted gains of 0.58% at 103.98.
Daily digest market movers: Gold price dips as US yields recover
- Jerome Powell emphasized the Fed had made progress on tempering inflation, and despite printing two straight months of higher prices, that hasn’t changed the Fed’s outlook in regard to price stability.
- Fed policymakers kept the Dot Plot unchanged for 2024. Still, the 2025 Dot Plot was revised up from 3.6% to 3.9%.
- For 2024, the Federal Open Market Committee (FOMC) forecasts that the economy will grow 2.1%, up from 1.4%, while the Unemployment Rate will remain at 4%.
- Inflation figures in the United States as measured by the Fed’s favorite gauge for inflation, the Personal Consumption Expenditures (PCE), weren’t changed. They were expected to be at 2.4%, while core PCE is projected to end at 2.6%, up from 2.4%.
- The US economic schedule revealed that Initial Jobless Claims for the week ending March 16 rose by 210K, below estimates of 215K and the prior week’s figures.
- S&P Global PMI figures for the United States were mixed with Services and Composite PMI readings cooling but remaining in expansionary territory. The S&P Global Manufacturing PMI was the outlier, exceeding estimates of 51.7 and the previous reading of 52.2 by jumping to 52.5.
- Existing Home Sales rose by 9.5% from 4 million to 4.38 million.
- According to the CME FedWatch Tool, expectations for a June rate cut stand at 74%, down from 59% at the beginning of the week.
Technical analysis: Gold traders' failure at $2,200 exposed the $2,180 mark
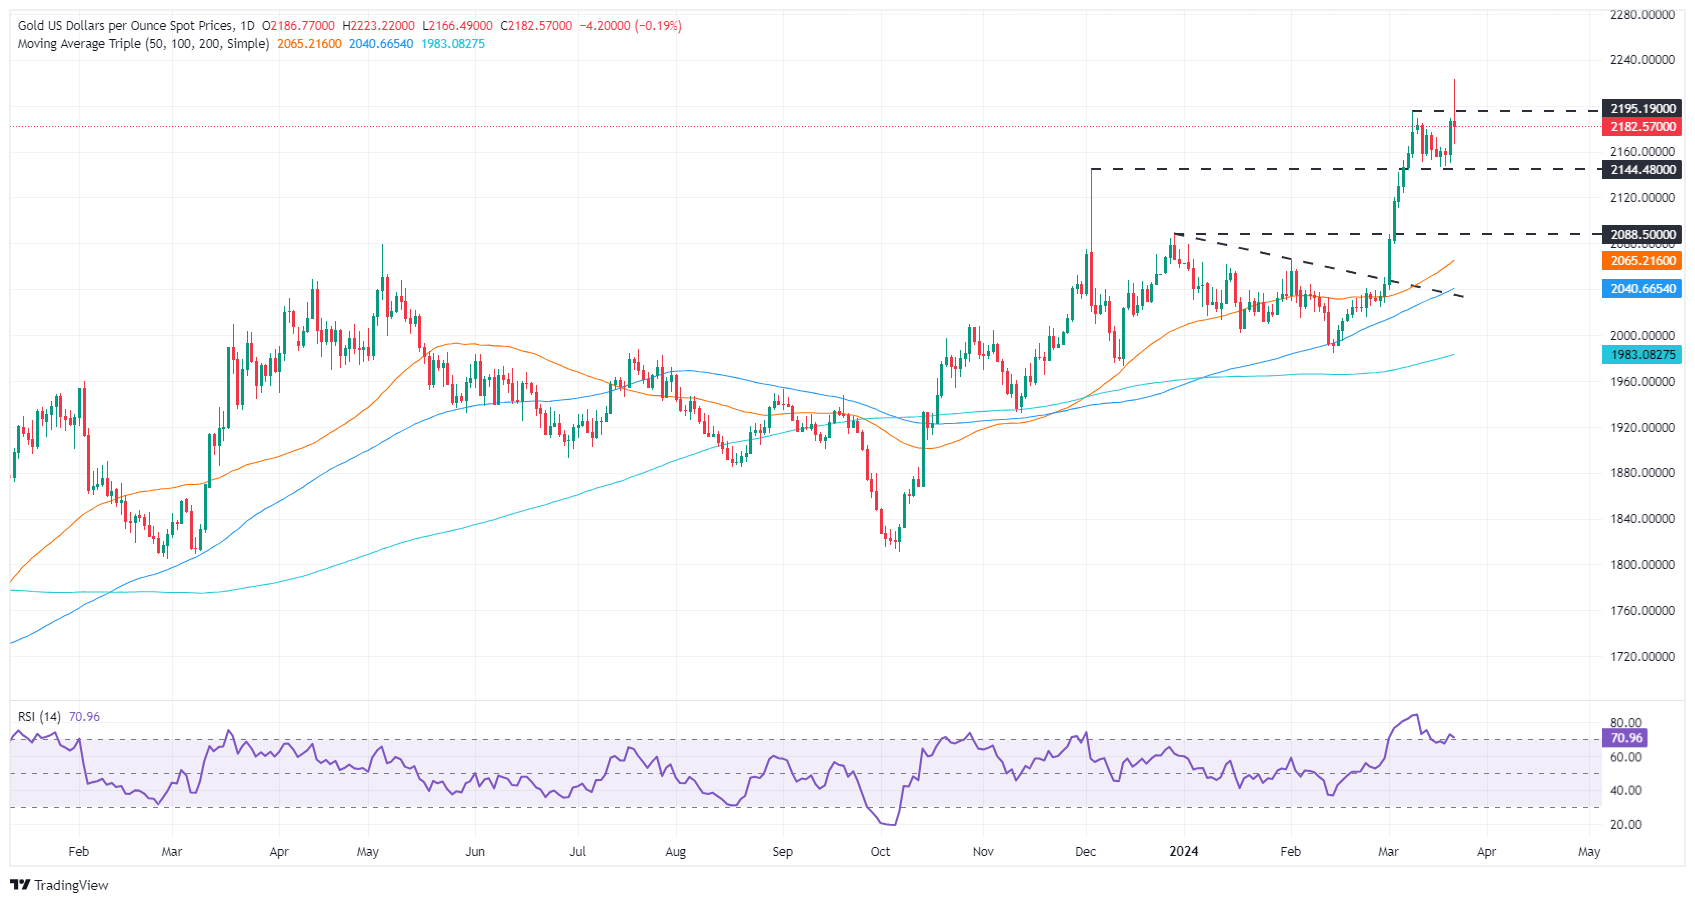
The XAU/USD price has fallen below the $2,200 mark and sits below the previous all-time high of $2,195 as sellers moved in. However, to further extend the yellow metal losses, they must drag prices toward the December 4 high, which turned support at $2,146, before challenging the $2,100 figure.
On the flip side, if buyers push prices toward $2,200, that will expose the current all-time high at $2,223 before aiming toward $2,250.
Risk sentiment FAQs
In the world of financial jargon the two widely used terms “risk-on” and “risk off'' refer to the level of risk that investors are willing to stomach during the period referenced. In a “risk-on” market, investors are optimistic about the future and more willing to buy risky assets. In a “risk-off” market investors start to ‘play it safe’ because they are worried about the future, and therefore buy less risky assets that are more certain of bringing a return, even if it is relatively modest.
Typically, during periods of “risk-on”, stock markets will rise, most commodities – except Gold – will also gain in value, since they benefit from a positive growth outlook. The currencies of nations that are heavy commodity exporters strengthen because of increased demand, and Cryptocurrencies rise. In a “risk-off” market, Bonds go up – especially major government Bonds – Gold shines, and safe-haven currencies such as the Japanese Yen, Swiss Franc and US Dollar all benefit.
The Australian Dollar (AUD), the Canadian Dollar (CAD), the New Zealand Dollar (NZD) and minor FX like the Ruble (RUB) and the South African Rand (ZAR), all tend to rise in markets that are “risk-on”. This is because the economies of these currencies are heavily reliant on commodity exports for growth, and commodities tend to rise in price during risk-on periods. This is because investors foresee greater demand for raw materials in the future due to heightened economic activity.
The major currencies that tend to rise during periods of “risk-off” are the US Dollar (USD), the Japanese Yen (JPY) and the Swiss Franc (CHF). The US Dollar, because it is the world’s reserve currency, and because in times of crisis investors buy US government debt, which is seen as safe because the largest economy in the world is unlikely to default. The Yen, from increased demand for Japanese government bonds, because a high proportion are held by domestic investors who are unlikely to dump them – even in a crisis. The Swiss Franc, because strict Swiss banking laws offer investors enhanced capital protection.
Related Articles


