
USD/JPY surges closer to 149.00 as US inflation climbs, Fed rate cut bets trimmed
- US CPI hits 2.7% YoY, reinforcing Fed's hawkish stance amid inflation concerns
- Treasury yields jump, with 10-year note reaching 4.483%, boosting USD/JPY
- Trump renews pressure on Fed, calling for aggressive 3% rate cuts
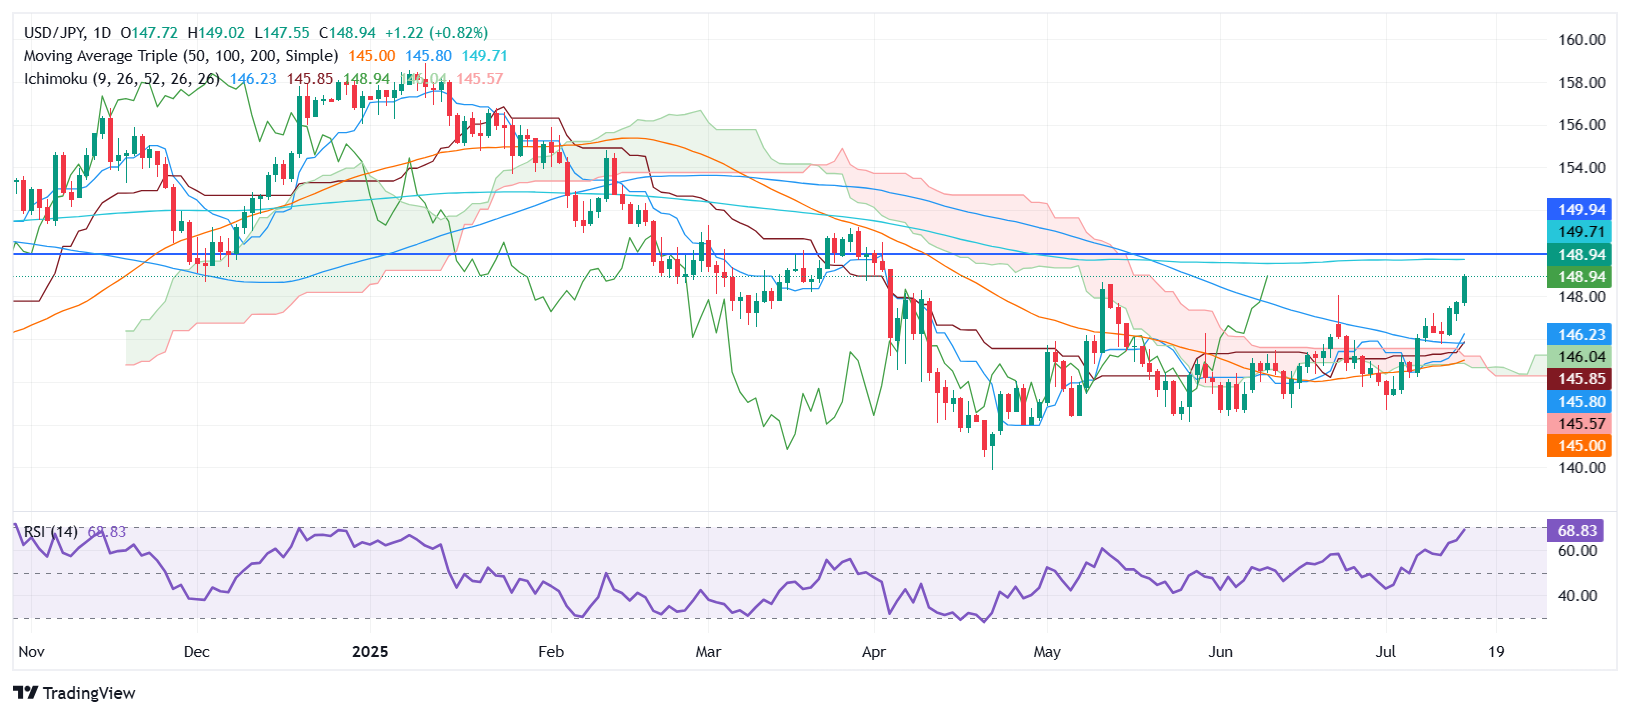
The USD/JPY rallies sharply over 0.86% during the North American session, trading at 148.95, approaching the 149.00 figure for the first time since April 2025. A slightly hot CPI report in the United States (US) sent US Treasury yields soaring, while traders priced out a short-term rate cut.
Dollar surges 0.86% against Yen after US inflation tops forecasts and Trump urges massive Fed cuts
The US Bureau of Labor Statistics (BLS) revealed that June Consumer Price Index (CPI) rose by 2.7% YoY and remains far from the Fed’s 2% goal. Core figures were also up, approaching the 3% threshold amid comments from US President Donald Trump, who once again attacked the Fed, adding that they should cut rates by 3%.
Money markets suggest that the Fed will keep rates unchanged at around the 4.25%-4.50% range in Jun, with odds standing at 95.87% according to data revealed by Prime Market Terminal.
The US 10-year Treasury note yield, which correlates closely with the USD/JPY, is up four and a half basis points at 4.483%, underpinning the US Dollar.
USD/JPY Price Forecast: Technical outlook
The USD/JPY daily chart suggests that further upside is seen, but buyers will face resistance at the 200-day SMA at 149.61. If surpassed, the pair would shift bullish, and be poised to challenge 150.00. Otherwise, if the pair stays below 149.00, traders can drive the exchange rate towards June 23 high turned support at 148.02.
Japanese Yen PRICE This week
The table below shows the percentage change of Japanese Yen (JPY) against listed major currencies this week. Japanese Yen was the strongest against the New Zealand Dollar.
| USD | EUR | GBP | JPY | CAD | AUD | NZD | CHF | |
|---|---|---|---|---|---|---|---|---|
| USD | 0.64% | 0.83% | 1.18% | 0.17% | 0.83% | 0.99% | 0.57% | |
| EUR | -0.64% | 0.16% | 0.52% | -0.48% | 0.17% | 0.34% | -0.08% | |
| GBP | -0.83% | -0.16% | 0.30% | -0.64% | 0.01% | 0.18% | -0.10% | |
| JPY | -1.18% | -0.52% | -0.30% | -0.87% | -0.33% | -0.12% | -0.54% | |
| CAD | -0.17% | 0.48% | 0.64% | 0.87% | 0.66% | 0.82% | 0.40% | |
| AUD | -0.83% | -0.17% | -0.01% | 0.33% | -0.66% | 0.14% | -0.28% | |
| NZD | -0.99% | -0.34% | -0.18% | 0.12% | -0.82% | -0.14% | -0.42% | |
| CHF | -0.57% | 0.08% | 0.10% | 0.54% | -0.40% | 0.28% | 0.42% |
The heat map shows percentage changes of major currencies against each other. The base currency is picked from the left column, while the quote currency is picked from the top row. For example, if you pick the Japanese Yen from the left column and move along the horizontal line to the US Dollar, the percentage change displayed in the box will represent JPY (base)/USD (quote).
Recommended Articles


